. 2020 Sep 23;11(1):4816.
doi: 10.1038/s41467-020-18512-7.

Dental cell type atlas reveals stem and differentiated cell types in mouse and human teeth

Affiliations

Dental cell type atlas reveals stem and differentiated cell types in mouse and human teeth

Jan Krivanek et al. Nat Commun. .

Abstract

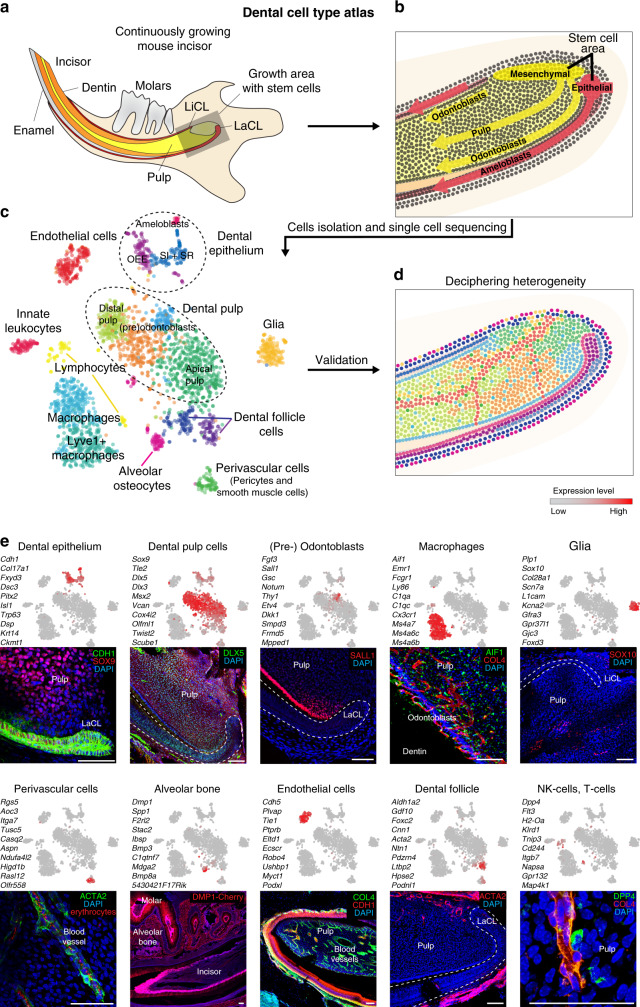
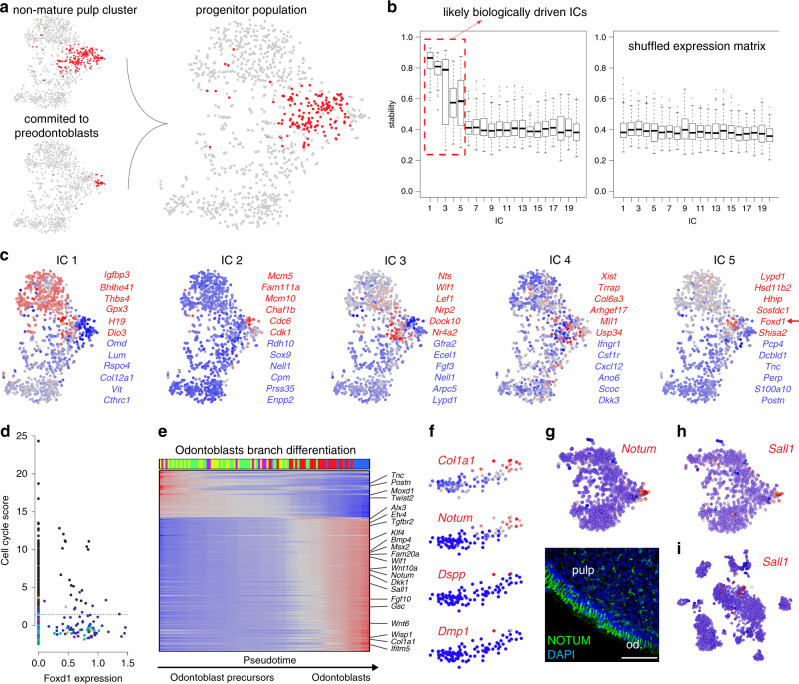
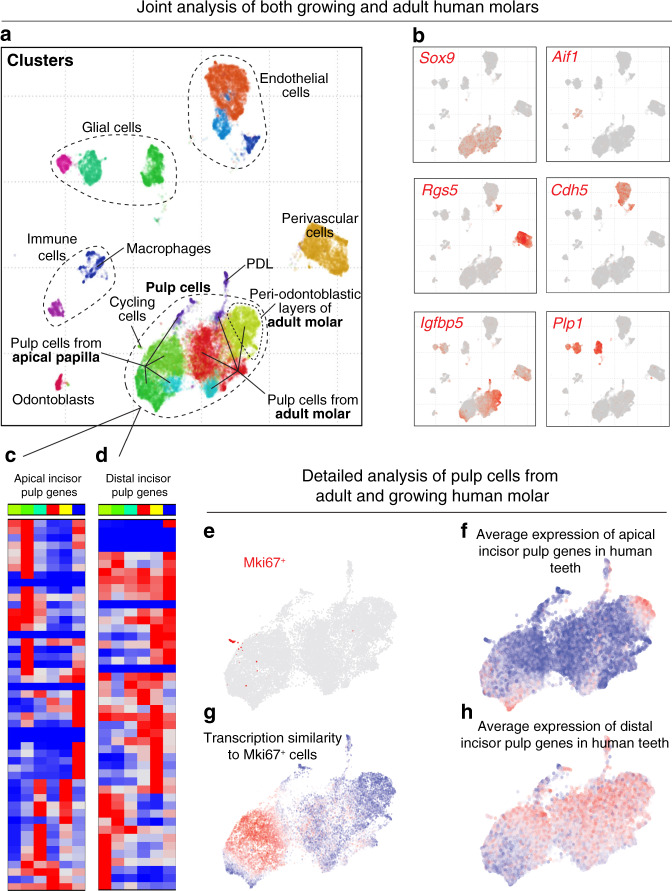
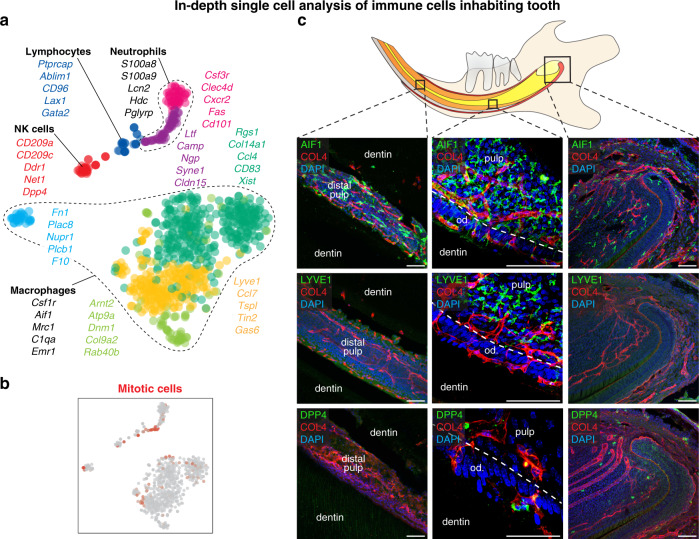
Understanding cell types and mechanisms of dental growth is essential for reconstruction and engineering of teeth. Therefore, we investigated cellular composition of growing and non-growing mouse and human teeth. As a result, we report an unappreciated cellular complexity of the continuously-growing mouse incisor, which suggests a coherent model of cell dynamics enabling unarrested growth. This model relies on spatially-restricted stem, progenitor and differentiated populations in the epithelial and mesenchymal compartments underlying the coordinated expansion of two major branches of pulpal cells and diverse epithelial subtypes. Further comparisons of human and mouse teeth yield both parallelisms and differences in tissue heterogeneity and highlight the specifics behind growing and non-growing modes. Despite being similar at a coarse level, mouse and human teeth reveal molecular differences and species-specific cell subtypes suggesting possible evolutionary divergence. Overall, here we provide an atlas of human and mouse teeth with a focus on growth and differentiation.


Conflict of interest statement

P.V.K. serves on the Scientific Advisory Board to Celsius Therapeutics Inc. Other authors declare no competing interests.

Figures

Fig. 1
Fig. 1. Unbiased identification, validation, and spatial mapping of major dental cell types and subpopulations.
a Schematic drawing of continuously growing mouse incisor with highlighted stem-cell area. b Cell dynamics during self-renewal and growth based on the activity of the dental epithelial and mesenchymal stem cells. c Unbiased identification of dental cell types and subpopulations. t-SNE dimensional reduction visualizes the similarity of the expression profiles of 2889 single cells (individual points). Colors demonstrate 17 clusters as defined by PAGODA clustering. All major clusters correspond to cell types in the mouse incisor, defined by expression of known markers. d Schematic drawing summarizing validation and mapping of the observed cellular subpopulations back onto the incisor tissue preparations. e Validations and mapping of unbiasedly identified populations based on the expression of selected marker genes. All validations were performed by immunohistochemistry except of alveolar bone panel where DSPPcerulean/DMP1Cherry mice was used (only red channel showed). Note. SOX9 is well-known marker for pulp cells, COL4 for blood vessels, CDH1 for epithelium, and ACTA2 for dental follicle (and perivascular cells). All these marker genes are highly and specifically expressed in corresponding clusters (Supplementary Table 1), but do not belong to top10 genes shown in plots above the images. (LiCL Lingual Cervical Loop, LaCL Labial Cervical Loop, SI Stratum Intermedium, SR Stellate reticulum, OEE Outer Enamel Epithelium). Scare bars: 50 µm.
Fig. 2
Fig. 2. In-depth single-cell analysis of dental epithelium.
a t-SNE dimensional reduction shows subpopulations of 268 single epithelial cells. 13 unbiased clusters (colors) reveal previously unrecognized stem, progenitor and mature epithelial subtypes. Inset: mitotic signature as defined by average expression of cell-cycle-related genes. b Identification of a previously unrecognized cellular subtypes of epithelial layer. RYR2+ cells in ameloblasts’ layer and THBD+ subpopulation of stratum intermedium organized into cuboidal layer found by immunohistochemistry. c Panel on the right shows localization of ACTA2-expressing cells inside the labial cervical loop (immunohistochemistry) and corresponding expression of Acta2 predicted from RNA-seq analysis (left panel). d Long-term (2 months) lineage tracing of a Acta2CreERT2/R26tdTomato dental epithelial stem cells shows the traced cells in both apical (near the cervical loop) and distal ameloblasts. Ameloblast character was proved both morphologically and by expression of CALB1 (immunohistochemistry). e Transcriptional program of ameloblasts differentiation. Four clusters corresponding to different stages of ameloblasts maturation (upper). Transcriptional states of ameloblasts progenitors were modeled as a single trajectory, which reveals sequence of cell state transitions and linked activity developmental gene modules (bottom). Heatmap: the cells (columns) are arranged according to estimated pseudotime, genes (rows) were clustered in nine modules. Smoothed gene expression profiles are shown. f Transient progenitor population found in labial cervical loop is demarcated by the expression of Egr1 and Fos. Panels in the bottom part shows the lineage tracing of FosCreERT2/R26ZsGreen1. Insets show the lineage traced cells in outer enamel epithelium. Of note, FosCreERT2/R26ZsGreen1 traced cells in epithelial and mesenchymal compartments are of distinct origins since compartments are spatially separated. (LaCL Labial Cervical Loop, SI Stratum Intermedium, Am. Ameloblasts). Scale bars: b, d, e: 50 µm; c and insets of e: 10 µm.
Fig. 3
Fig. 3. Identification of previously unrecognized cell types in dental epithelium and stem cells.
ae In situ hybridization (Igfbp5, Gjb3) and immunohistochemistry (PIEZO2, EGR1, and CLDN10) validations of selected markers demarcating different progenitor and differentiated states in epithelial layer. Note: Validation of expression of Igfbp5 enables identification of outer enamel epithelium clusters on a t-SNE representation (a). Validation of PIEZO2-expressing cells shows sporadic cells inside the ameloblast layer (b). Egr1+ cells are present in the progenitor area on the edge of stellate reticulum and outer enamel epithelium (c). Mapping of Gjb3 on the section tissue consistently reveals the position in stellate reticulum within the labial cervical loop (d). Validation of Cldn10 expression helps to outline all non-ameloblastic parts of epithelial differentiation including developing stratum intermedium and outer enamel epithelium (e). f Acta2CreERT2/R26tdTomato genetic tracing shows significant contribution of Acta2+ cells of the labial cervical loop to more differentiated cell types of dental epithelium including ameloblasts, stellate reticulum, outer enamel epithelium, and stratum intermedium after 3 days, 2 weeks, and 1 month long tracing period. g, h Immunohistochemistry identification of the Cuboidal layer of stratum intermedium (expressing THBD) and spatial relation to the neighboring blood vessels submerged into the papillary structure of stratum intermedium. COL4 expression characterizes the blood vessels on left panel. h Papillary structure of stratum intermedium with submerged blood vessels (COL4) and CDH1 expressing ameloblasts and cells from stratum intermedium. Note. Cuboidal layer characterized by THBD expression (g) forms subpopulation of stratum intermedium cells (h). Immunohistochemistry. i Comparison of RYR2+ ameloblasts in healthy (mean 6.71 ± 0.93 SEM per FOV, Field Of View) and unilaterally clipped (mean 6.04 ± 0.61 SEM per FOV) mouse incisor. Counts of RYR2+ ameloblasts per FOV are plotted, and the color-code of dots corresponds to 3 individual animals per healthy or clipped condition. (am. ameloblasts, od. odontoblasts, LaCL Labial Cervical Loop, SI stratum intermedium, OEE Outer Enamel Epithelium, am. Ameloblasts, PDL periodontal ligamentum). Scale bars: 50 µm.
Fig. 4
Fig. 4. Extended analysis of the heterogeneity of dental epithelial subtypes.
a t-SNE dimensional reduction visualizes the similarity of the expression profiles of 268 single dental epithelial cells. Thirteen unbiased clusters shown by different colors including revealed stem, progenitor and mature epithelial subtypes. b Previously unrecognized identified stem-cell subpopulation shows expression of Lgr5, Lrig1, and Sox2. Unlike Lgr5 and Lrig1, Sox2 is more widely expressed also in TAC’s (also shown in panel g). c Shh is expressed in the progenitor populations including the stellate reticulum, stratum intermedium progenitors or preameloblasts (clusters 2, 11, and 12). df Transcriptional factor code associated with ameloblasts differentiation. f Schematic drawing summarizing expression of various selected transcription factors in different stages of ameloblasts development. g Heatmap showing the expression of mitotic and stem-cell markers within identified clusters of dental epithelial cells. Population hierarchy axis colors resemble the same populations on tSNE from panel a. Note that some of previously described stem-cell markers: Lrig1, Sox2, Bmi1, Gli1, Lgr5, or Igfbp5 are co-expressed only within a subcluster of cluster 13. This subcluster possesses a unique and extensive multigenic signature, including previously unknown markers Pknox2, Zfp273, Spock1, and Pcp4. The putative DESCs from cluster 13 might represent one type of epithelial stem cells in the tooth. The listed stem-cell markers show reasonably large and partly overlapping domains of expression that coincide with clusters containing proliferating progenitors. Sox2+ DESCs give rise to Shh+ populations including transient amplifying cells (TAC’s) in the epithelial compartment. In agreement with that, we observe that the Sox2+/Shh+ clusters 12 and 2 contain the majority of TAC’s and most likely represent less differentiated states as compared to Sox2-/Shh+ clusters 11, 5, 1, and 13. h, i Expression of well-known markers corresponding to a different ameloblast stage proving the gradual differentiation from secretory ameloblasts stage (Enam+) through maturation ameloblast stage (Klk4+, Odam+) into postmaturation ameloblast stage (Gm17660+).
Fig. 5
Fig. 5. Developmental dynamics of dental mesenchyme.
a Analysis of mouse-incisor dental mesenchymal cells isolated for separate analysis from general dataset. Colors show unbiased clusters. The principal tree correctly captures positions of mature mesenchymal derivative and progenitor populations. b Analysis of RNA velocity shows major directions of cell progression in the transcriptional space. The arrow start- and endpoints indicate current and predicted future cell states. c Model of stem-cell dynamics in mesenchymal compartment with relation to dental follicle. d Prediction and validation of spatially restricted Foxd1+ stem cells. The Foxd1-associated axis was selected for validation, and is shown on t-SNE (genes with the strongest positive and negative associations are shown in red and blue respectively). Foxd1+ cells (in situ hybridization) are located in the mesenchyme surrounding the labial cervical loop. e Lineage tracing of FoxD1CreERT2/R26tdTomato strain confirmed the predicted stem-cell nature of Foxd1+ mesenchymal cells. In short-term tracing (5days) tdTomato+ cells are predominantly around LaCL in contrast to long-term (1-month-long and 3 months) tracing where pulp and odontoblast progeny are observed. Importantly, tdTomato+ cells are maintained in their original position in the long-term manner (3 months) and at the same time point tdTomato+ distally located odontoblasts can be observed supporting the theory of Foxd1+ cells being a long-living mesenchymal stem cells. f Nature of Foxd1+ cells progeny confirmed by a combination of FoxD1CreERT2/R26tdTomato tracing and SALL1 and SOX9 immunohistochemical stainings. FoxD1CreERT2/R26tdTomato-traced cells contribute to both the SALL1+ odontoblasts (arrows) and SOX9+ pulp cells (arrowheads). Asterisks show the of subodontoblast layer FoxD1CreERT2/R26tdTomato traced cells. g Variability of cells assigned to a branch leading to odontoblasts (inset) was reanalysed using principal component analysis. Colors mark five clusters obtained by unbiased hierarchical clustering. Left-right axis reflects developmental stages of odontoblasts. h Gradual odontoblast differentiation (suggested in g) from near-CL area into fully differentiated odontoblasts. Left: expression pattern acquired from scRNA-seq, right: in situ hybridization-based histological validations of the proximal part of the mouse incisor proving suggested gradual transition. i Spatial pattern of a discovered (pre)odontoblast transcription factor—SALL1 (Immunohistochemistry). (LaCL Labial Cervical Loop, pre-od. preodontoblasts, Od. Odontoblasts, Am. Ameloblasts). Scare bars: 50 µm.
Fig. 6
Fig. 6. Portrait of transcriptional heterogeneity in dental mesenchymal populations.
a t-SNE representations of selected, previously known marker genes. b t-SNE representation showing position of Mki67+ cells. c t-SNE representation showing position of Foxd1+ cells. d Immunohistochemistry (SMOC2) and in situ hybridization (Igfbp5, Syt6, and Tac1) characterization of key populations in the mesenchymal population. Importantly, Igfbp5 and Syt6 demarcate more distal pulp and Tac1 is a unique marker for dental pulp attached to the lingual cervical loop. e Landscape of mesenchymal cells of dental pulp (dots) and follicle (crosses) is reproduced and extended with 10× Chromium. t-SNE embedding shows 2552 mesenchymal cells grouped in clusters, where clusters colours reflect colours of annotated Smart-seq2 pulp clusters (see Fig. 3a). Of note, cells from apical pulp gradually extend into cells of dental follicle. f Experimental validations of gradual spatio-transcriptional gradient from apical pulp to dental follicle. Immunohistochemistry of SMOC2 highlights the position of the apical pulp state, corroborated by Smart-seq2 and 10× Chromium single-cell datasets. In situ hybridization of Sfrp2, consistent with 10x Chromium and Smart-seq2 t-SNE representations, labels coherent states between apical pulp and dental follicle. Immunohistochemistry for SOX9 labels all pulp cells but not odontoblasts or dental follicle. g In silico mapping of mitotic cells onto non-mitotic landscape pinpoints progenitor states of active cell division (upper). To remove effect of mitotic program, mitotic cells were re-positioned as average of 10 transcriptionally similar non-mitotic cells. Comparison of intensity of odontoblast (lower, X-axis) and cell cycle (lower, Y-axis) programs in each cell reveals a subset of mitotic cells with activated odontoblast program (lower). Dashed lines demarcate cells with active programs. h Mutually exclusive activation of fate-specific programs (odontoblasts, distal and apical fates). An estimate of activity of fate-specific programs in each cell was based on average expression of 20 fate-specific markers. Comparison of pairs of fates (three panels of fate pairs) shows activation of only one of fates indicating lack of noticeable multilineage priming.
Fig. 7
Fig. 7. Detailed analysis of mesenchymal branching point and odontoblast lineage.
a Selection of non-mature subpopulation. An unbiased cluster of cells that do not represent mature pulp populations was selected (left, upper), and preodontoblasts (left, lower), were excluded from it, resulting in non-mature subpopulation (right). b Analysis of ICs stability reveals five biologically driven aspects of heterogeneity of non-mature subpopulation. Average correlation of ICs to the most similar ICs across 100 runs of subsamplings of 70% of cells (right) reveals 5 out of 20 ICs with stability substantially higher than expected from shuffled control (left). Stability of all ICs of control shuffled matrix and 15 ICs of original matrix are around 0.4 indicating background expectations of spurious components. c Five ICs of non-mature subpopulation reveal processes related to (from left to right) apical gradient (IC 1), cell cycle (IC 2), Fgf3-mediated (IC 3), and Foxd1-mediated (IC 5) heterogeneity restricted to the progenitor states. Colors show intensities of identified ICs. Genes that have the highest (red) and lowest (blue) associations with corresponding IC are shown. d Graph showing cells expressing Foxd1 in comparison to cell-cycle score. e Transcriptional events during pulp differentiation trajectories. Each trajectory encompasses cell states from progenitor, as identified from analysis of preodontoblasts, to mature states with cells arranged by pseudotime reflecting maturation process. The black cells belong to the trajectory being shown, while other cells are shown in light gray (upper panels). Heatmap shows smoothed gene expression profiles with cells arranged by pseudotime and genes (rows) arranged by pseudotime of maximal expression (lower panels). fi Expression analysis of the selected genes determining odontoblasts (Col1a1, Dmp1, and Dspp) and together with previously unrecognized identified odontoblast marker genes (Notum and Sall1). Notum expression is visualized on t-SNE embedding of the pulp dataset and immunohistochemistry proves NOTUM to be expressed in odontoblasts (g). Sall1 expression is visualized on t-SNE embeddings of the both pulp (h) and complete incisor dataset (i). Scale bars: 50 µm.
Fig. 8
Fig. 8. Single-cell analysis of human adult and growing teeth.
a Scheme of pulp regions isolated for single-cell RNA-seq from adult human molars and apical papillae of growing human molars (dotted regions). b Characterization of cell composition across five adult and two growing human molars using scVI deep learning framework. UMAP dimensionality reduction visualizes similarity of expression profiles of 39,095 single cells. Colors correspond to individual datasets and indicate clustering by cell types. c Characterization of dental cell types in human teeth. Colors demonstrate 17 clusters as defined by leiden clustering. Major clusters are defined by expression of known markers. d Human dental pulp have at least six transcriptionally distinct states. Top color bar reflects colors of clusters shown in c). Top 198 genes enriched in each cluster are shown (maximum to medium expression across clusters is at least four-fold and p value < 10−50, one-way ANOVA test). e, f Identification of apical-like-mouse-incisor regions in the growing apical papilla of human molar shown by the expression of SFRP2 and SMOC2 (immunohistochemistry) in the growing region of apical papilla. g Dividing, MKI67+ cells are positioned in the growing part of the apical papilla. h, i Expression of POSTN shows very regionalized pattern in two main clusters: periodontal ligament (PDL) on the samples from apical papillae (h), but also demarcate the periodontal layers of adult dental pulp previously recognized as a cell-rich and cell-free zones (i). Immunohistochemical POSTN staining. j S100A13 was proposed as a marker of human odontoblasts. This gene is highly overexpressed in one of the subclusters, which is on t-SNE located in the close proximity to dental pulp. S100A13 was proved to be expressed in odontoblasts by immunohistochemistry. (Od. Odontoblasts; PDL periodontal ligament). Scale bars: 50 µm, insets: 250 µm.
Fig. 9
Fig. 9. Analysis of adult and growing human molars.
a Dental cell types in human teeth, see Fig. 4. b Expression of selected marker genes. c, d Expression of genes coordinately active in apical (51 genes, c) or distal (48 genes, d) incisor pulp across clusters of human mesenchyme reveals divergence of pulp expression programs. Apical incisor genes were defined as at least three-fold and significantly (p < 10−10, two-sided t-test) overexpressed in apical compared to distal incisor pulp in both 10× Chromium and Smart-seq2 datasets. The same for distal incisor genes. e Expression of MKI67 in cells of human pulp shows a group dividing cells. f Transcriptional similarity of the group of dividing cells to individual nondividing mesenchyme cells. g, h Average expression of apical incisor genes (g) and distal incisor genes (h) in cells of human mesenchyme outline tendency to expression in complementary cell states.
Fig. 10
Fig. 10. Heterogeneity of immune cells in mouse incisor.
a t-SNE dimensional reduction shows ten identified populations of immune cells. b Position of mitotic cells in the immune cluster. c Location of tissue-residential immune cells in the different parts of mouse incisor. AIF1+ macrophages are located in the whole incisor including apical pulp, cervical loop, odontoblast layer, and distal pulp in contrast to LYVE+ macrophages which mostly resides in the middle part of the pulp, but not inside the odontoblast layer. DPP4+ immune cells are sporadically located in the apical part of the tooth and odontoblast layer. COL4 immunohistochemical staining visualize the blood vessels. (Od. Odontoblasts), Scale bars: 50 µm.

Similar articles

Cited by

References

    1. Jussila M, Thesleff I. Signaling networks regulating tooth organogenesis and regeneration, and the specification of dental mesenchymal and epithelial cell lineages. Cold Spring Harb. Perspect. Biol. 2012;4:a008425. doi: 10.1101/cshperspect.a008425. - DOI - PMC - PubMed
    1. Balic A, Thesleff I. Tissue interactions regulating tooth development and renewal. Curr. Top. Dev. Biol. 2015;115:157–186. doi: 10.1016/bs.ctdb.2015.07.006. - DOI - PubMed
    1. Krivanek J, Adameyko I, Fried K. Heterogeneity and developmental connections between cell types inhabiting teeth. Front. Physiol. 2017;8:376. doi: 10.3389/fphys.2017.00376. - DOI - PMC - PubMed
    1. Zhang YD, Chen Z, Song YQ, Liu C, Chen YP. Making a tooth: growth factors, transcription factors, and stem cells. Cell Res. 2005;15:301–316. doi: 10.1038/sj.cr.7290299. - DOI - PubMed
    1. Balic A. Biology explaining tooth repair and regeneration: a mini-review. Gerontology. 2018;64:382–388. doi: 10.1159/000486592. - DOI - PubMed

Publication types

MeSH terms