. 2020 Sep 23;11(9):787.
doi: 10.1038/s41419-020-02950-8.

Heme oxygenase 1 protects human colonocytes against ROS formation, oxidative DNA damage and cytotoxicity induced by heme iron, but not inorganic iron

Affiliations

Heme oxygenase 1 protects human colonocytes against ROS formation, oxidative DNA damage and cytotoxicity induced by heme iron, but not inorganic iron

Nina Seiwert et al. Cell Death Dis. .

Abstract

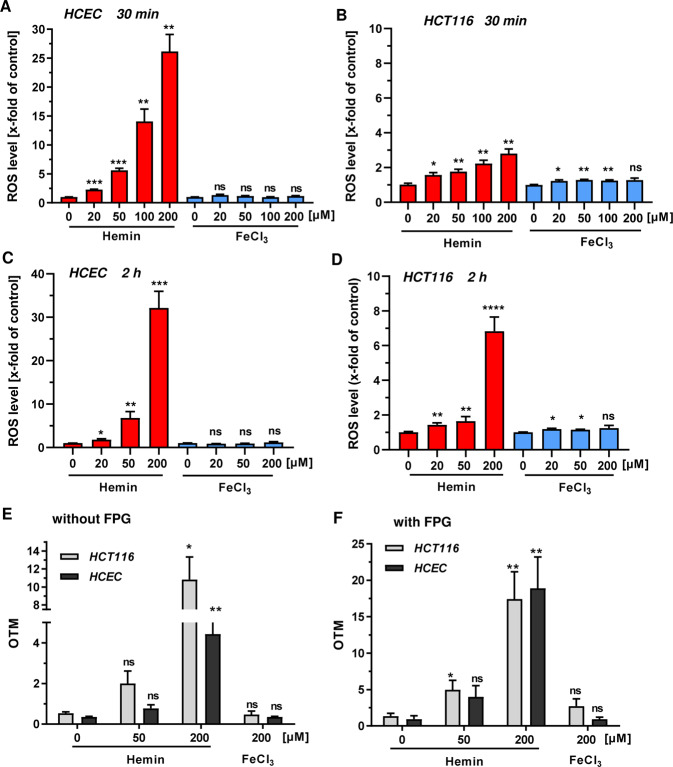
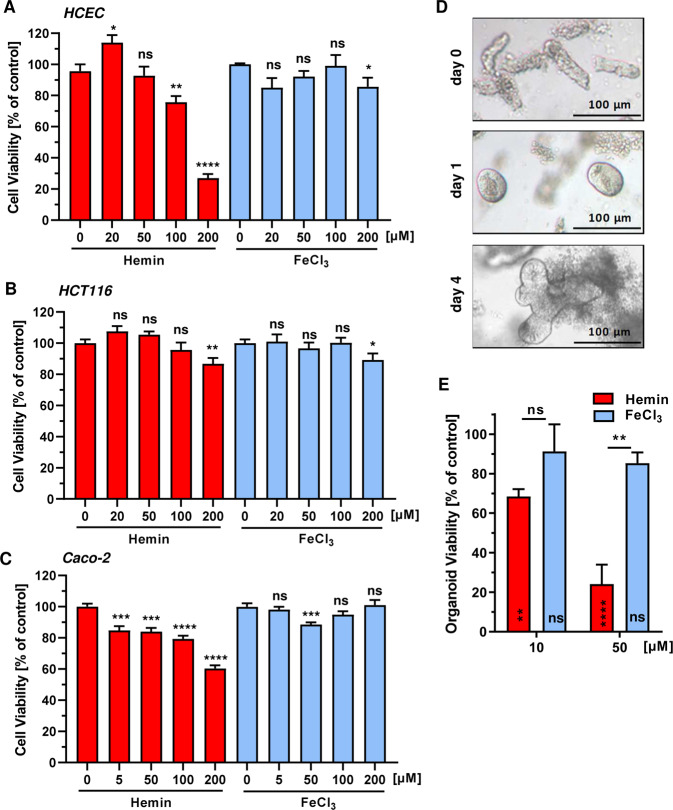
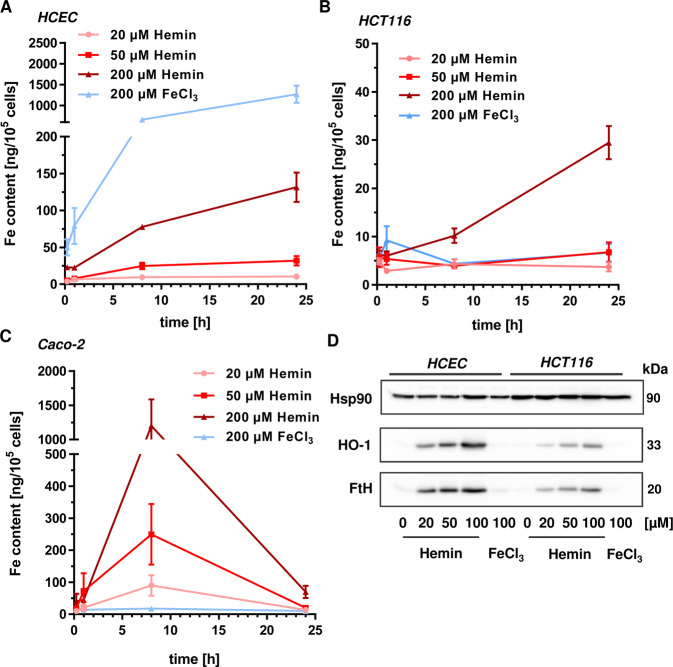
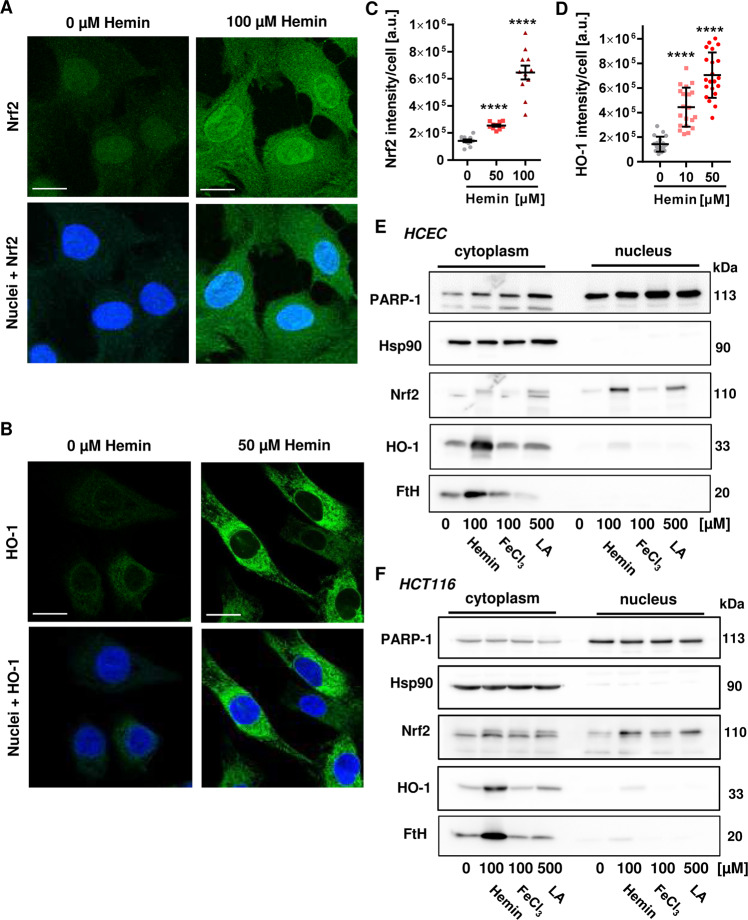
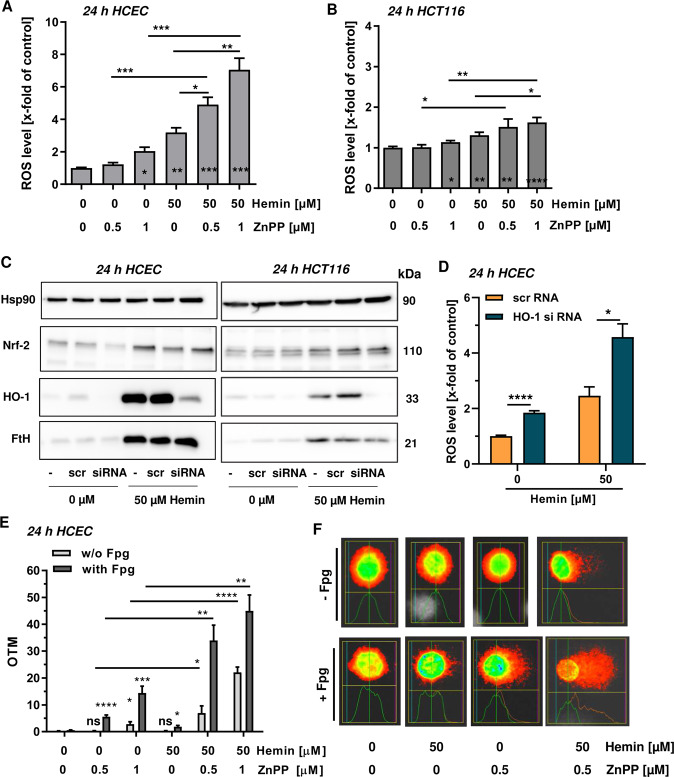
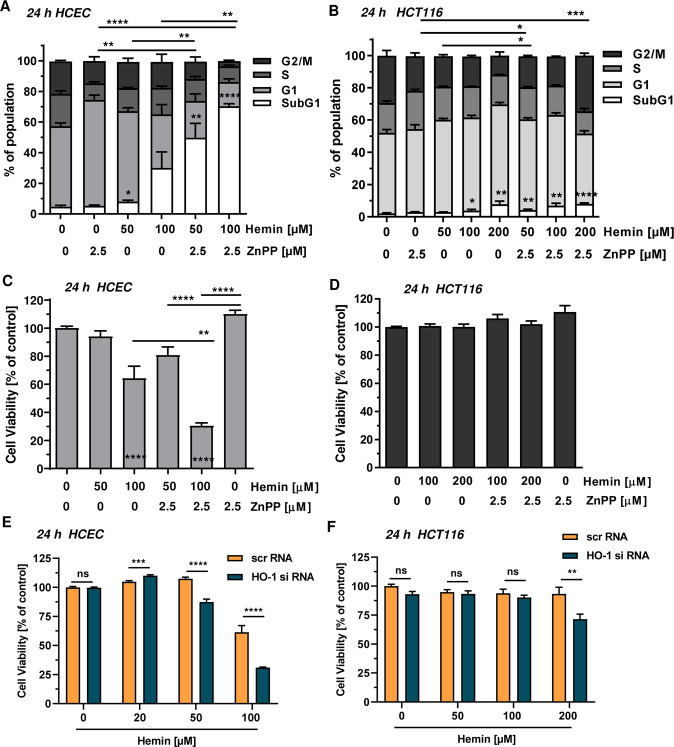
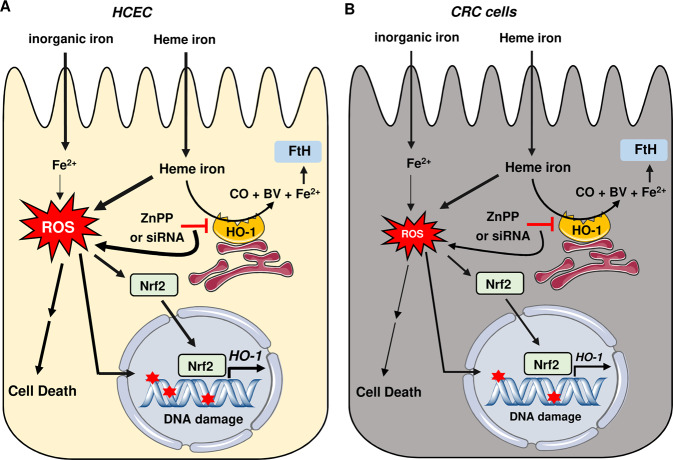
The consumption of red meat is probably carcinogenic to humans and is associated with an increased risk to develop colorectal cancer (CRC). Red meat contains high amounts of heme iron, which is thought to play a causal role in tumor formation. In this study, we investigated the genotoxic and cytotoxic effects of heme iron (i.e., hemin) versus inorganic iron in human colonic epithelial cells (HCEC), human CRC cell lines and murine intestinal organoids. Hemin catalyzed the formation of reactive oxygen species (ROS) and induced oxidative DNA damage as well as DNA strand breaks in both HCEC and CRC cells. In contrast, inorganic iron hardly affected ROS levels and only slightly increased DNA damage. Hemin, but not inorganic iron, caused cell death and reduced cell viability. This occurred preferentially in non-malignant HCEC, which was corroborated in intestinal organoids. Both hemin and inorganic iron were taken up into HCEC and CRC cells, however with differential kinetics and efficiency. Hemin caused stabilization and nuclear translocation of Nrf2, which induced heme oxygenase-1 (HO-1) and ferritin heavy chain (FtH). This was not observed after inorganic iron treatment. Chemical inhibition or genetic knockdown of HO-1 potentiated hemin-triggered ROS generation and oxidative DNA damage preferentially in HCEC. Furthermore, HO-1 abrogation strongly augmented the cytotoxic effects of hemin in HCEC, revealing its pivotal function in colonocytes and highlighting the toxicity of free intracellular heme iron. Taken together, this study demonstrated that hemin, but not inorganic iron, induces ROS and DNA damage, resulting in a preferential cytotoxicity in non-malignant intestinal epithelial cells. Importantly, HO-1 conferred protection against the detrimental effects of hemin.


Conflict of interest statement

The authors declare no conflict of interest.

Figures

Fig. 1
Fig. 1. Time-dependent formation of ROS and oxidative DNA damage in HCEC and CRC cells by heme iron versus inorganic iron.
a, c HCEC were incubated for 30 min (a) or 2 h (c) with increasing doses of hemin or FeCl3 (0–200 µM). Reactive oxygen species (ROS) levels were assessed by live cell staining and subsequent flow cytometry-based analysis. b, d HCT116 were treated for 30 min (b) or 2 h (d) and analyzed as described under a. Data (ad) is shown as mean + SEM (n ≥ 3, except for 20 µM in HCT116 at 2 h: n = 2). Ns: p > 0.05; *p < 0.05; **p < 0.01; ***p < 0.001, ****p < 0.0001 (versus respective control). e, f Cells were exposed to hemin (0–200 µM) or FeCl3 (200 µM) for 2 h. DNA strand break induction and formation of oxidative DNA damage was determined by the alkaline Comet assay without (e) or with Fpg (f). Data are presented as mean + SEM (n ≥ 3). Ns: p > 0.05; *p < 0.05; **p < 0.01 (versus control).
Fig. 2
Fig. 2. Impact of heme iron and inorganic iron on cell and intestinal organoid viability.
ac HCEC (a), HCT116 (b) and Caco-2 (c) were treated with increasing concentrations of hemin or FeCl3 (0–200 µM). Cell viability was determined after 72 h using the MTS assay. Data are given as mean + SEM (n ≥ 3, triplicates). Ns: p > 0.05; *p < 0.05; **p < 0.01; ***p < 0.001; ****p < 0.0001 (versus respective control). d Microscopic images of isolated intestinal crypts (day 0) and the developing intestinal organoids (day 1 and 4). e Intestinal organoids were treated with hemin or FeCl3 for 24 h and viability was determined by the MTT assay. Date are given as mean + SEM (n = 2). Ns: p > 0.05; **p < 0.01; ****p < 0.0001.
Fig. 3
Fig. 3. Uptake of hemin and inorganic iron into HCEC and CRC cells.
a HCEC were incubated with hemin or FeCl3 for different periods (0, 0.25, 8 and 24 h) at the concentrations indicated. Cells were then collected and iron content was determined by ICP-MS as described. Data are depicted as mean + SEM (n ≥ 3). b HCT116 cells were treated with hemin or FeCl3 and iron content was analyzed as mentioned above. Data are shown as mean + SEM (n = 7). c Caco-2 cells were treated and analyzed as described under a. Data are presented as mean + SEM (n ≥ 6). d HCEC and HCT116 cells were exposed to hemin or FeCl3 for 24 h. Cells were harvested, lysed and subjected to Western blot analysis for heme oxygenase-1 (HO-1) and ferritin heavy chain gene (FtH). Hsp90 was detected as loading control.
Fig. 4
Fig. 4. Impact of hemin and inorganic iron on Nrf2 signaling in HCEC and CRC cells.
a HCEC were exposed to hemin (0–100 µM) for 2 h. Cells were fixed, processed for Nrf2 staining and analyzed by confocal microscopy. Representative images are shown. Nrf2 is depicted in green and nuclei are shown in blue. Scale bar: 20 µm. b HCEC were treated with hemin (0–50 µM) for 8 h. Cells were fixed, processed for HO-1 staining and analyzed by confocal microscopy. Representative images are shown. HO-1 is depicted in green and nuclei are shown in blue. Scale bar: 20 µm. c Quantitative evaluation of Nrf2 staining shown in a. Nrf2 intensity was quantified by ImageJ. Data are given as mean + SEM (n = 2). ****p < 0.0001. d Quantitative evaluation of HO-1 staining shown in b. HO-1 intensity was quantified by ImageJ and data are indicated as mean + SEM (n = 3). ****p < 0.0001. e HCEC were incubated for 8 h with 100 µM hemin, 100 µM FeCl3, or 500 µM α-Lipoic acid (LA). Cell fractionation was performed as described. Cytoplasmic and nuclear protein extracts were then analyzed by SDS-PAGE and western blot detection of Nrf2, HO-1 and FtH. PARP-1 served as nuclear loading control, while Hsp90 was used as cytoplasmic loading control. f HCT116 were treated, processed and analyzed as stated under e.
Fig. 5
Fig. 5. Influence of HO-1 on hemin-triggered ROS and oxidative DNA damage in HCEC and CRC cells.
a HCEC were incubated with hemin (0 or 50 µM) in the absence or presence of the HO-1 inhibitor zinc protoporphyrin (ZnPP; 0.5 or 1 µM) for 24 h. Cells were stained with the CM-H2DCFDA dye and levels of reactive oxygen species (ROS) were assessed by flow cytometry. Data are presented as mean + SEM (n ≥ 3). *p < 0.05; **p < 0.01; ***p < 0.001. b HCT116 cells were treated and analyzed as described above. Data are given as mean + SEM (n = 4). *p < 0.05; **p < 0.01; ****p < 0.0001. c HCEC and HCT116 cells were transiently transfected with scrambled (scr) or HO-1-specific siRNA. 24 h after transfection, cells were treated with hemin and incubated for another 24 h. Whole-cell extracts were analyzed by SDS-PAGE and immunoblot detection of Nrf2 and FtH. Hsp90 served as loading control, whereas HO-1 was visualized to confirm knockdown. d Knockdown of HO-1 in HCEC followed by hemin exposure for 24 h and analysis of ROS formation. ROS were measured by flow cytometry as stated above. Data are given as mean + SEM (n = 4). *p < 0.05; ****p < 0.0001. e HCEC were treated with hemin (0 or 50 µM) in the absence or presence of the HO-1 inhibitor ZnPP (ZnPP; 0.5 or 1 µM) for 24 h. Cells were then subjected to the alkaline Comet assay with or without Fpg. OTM, olive tail moment. Data are given as mean + SEM (n = 5). Ns: p > 0.05; *p < 0.05; **p < 0.01; ***p < 0.001, ****p < 0.0001. f Representative pictures of the data shown in e.
Fig. 6
Fig. 6. Influence of HO-1 on hemin-triggered cell cycle distribution and cytotoxicity in HCEC and CRC cells.
a HCEC were treated with hemin (0–100 µM) in the absence or presence of the HO-1 inhibitor zinc protoporphyrin (ZnPP; 2.5 µM) for 24 h and collected for cell cycle analysis by flow cytometry. Data were evaluated by BD FACS Diva software and are shown as mean + SEM (n = 4). Statistical evaluation performed for subG1 population (white bars). *p < 0.05; **p < 0.01; ****p < 0.0001. b HCT116 cells were treated and analyzed as described above. Data are given as mean + SEM (n ≥ 3). *p < 0.05; **p < 0.01; ***p < 0.001; ****p < 0.0001. c HCEC were treated as described in a and cell viability was assessed using the MTS assay. Data are shown as mean + SEM (n ≥ 2, triplicates). **p < 0.01; ****p < 0.0001 d HCT116 cells were treated and analyzed as described in a. Data are given as mean + SEM (n = 2, triplicates). e HCEC were transiently transfected with scrambled (scr) or HO-1-specific siRNA. 24 h following transfection, cells were treated with increasing hemin concentrations for another 24 h. Cell viability was determined by the MTS assay. Data are shown as mean + SEM (n = 4, triplicates). Ns: p > 0.05; ***p < 0.001, ****p < 0.0001. f HCT116 cells were transiently transfected with scrRNA or HO-1 specific siRNA. Further treatment and analysis as described under e. Data are shown as mean + SEM (n ≥ 3, triplicates). Ns: p > 0.05; **p < 0.01.
Fig. 7
Fig. 7. Model of heme-triggered DNA damage and cytotoxicity in HCEC versus CRC cells and role of HO-1.
a Heme iron is taken up into HCEC, where it catalyzes the formation of reactive oxygen species (ROS) and induces oxidative DNA lesions as well as DNA strand breaks (indicated by red asterisks). This finally results in cytotoxicity, which is more prominent in HCEC than in CRC cell lines. In contrast, internalized inorganic iron causes little ROS production and DNA damage, and only slightly impairs cell viability. Heme-dependent ROS formation activates the transcription factor Nrf2, which shuttles from the cytoplasm to the nucleus, where it drives the transcription of its target genes such as heme oxygenase-1 (HO-1). This enzyme degrades heme to Fe2+, carbon monoxide (CO) and biliverdin (BV). Concomitant to HO-1 induction, ferritin heavy chain gene (FtH) is upregulated by hemin. Genetic abrogation of HO-1 by siRNA or its pharmacological inhibition by ZnPP potentiated heme-induced ROS, DNA damage and cell death, strongly suggesting that heme iron, and not its breakdown product Fe2+, initiates ROS formation and thus DNA damage induction. b Internalization of heme iron and inorganic iron in CRC cells. Similar to HCEC, inorganic iron causes little ROS production and DNA damage, and only slightly impairs viability in CRC cells. Hemin is taken up differentially into CRC cells (Caco-2 > HCT116), causing less ROS formation and oxidative DNA damage as in HCEC. Furthermore, CRC cells are in general more resistant against hemin-triggered cytotoxicity and HO-1 abrogation moderately affects cell survival in the presence of high heme concentrations. This figure was created using Servier Medical Art templates, which are licensed under a Creative Commons Attribution 3.0 Unported License; https://smart.servier.com.

Similar articles

Cited by

References

    1. Hurrell R, Egli I. Iron bioavailability and dietary reference values. Am. J. Clin. Nutr. 2010;91:1461S–1467S. doi: 10.3945/ajcn.2010.28674F. - DOI - PubMed
    1. Reedy CJ, Gibney BR. Heme protein assemblies. Chem. Rev. 2004;104:617–649. doi: 10.1021/cr0206115. - DOI - PubMed
    1. Hooda J, Shah A, Zhang L. Heme, an essential nutrient from dietary proteins, critically impacts diverse physiological and pathological processes. Nutrients. 2014;6:1080–1102. doi: 10.3390/nu6031080. - DOI - PMC - PubMed
    1. Shayeghi M, et al. Identification of an intestinal heme transporter. Cell. 2005;122:789–801. doi: 10.1016/j.cell.2005.06.025. - DOI - PubMed
    1. Latunde-Dada GO, Takeuchi K, Simpson RJ, McKie AT. Haem carrier protein 1 (HCP1): expression and functional studies in cultured cells. FEBS Lett. 2006;580:6865–6870. doi: 10.1016/j.febslet.2006.11.048. - DOI - PubMed

Publication types