. 2020 Sep 23;11(1):4798.
doi: 10.1038/s41467-020-18538-x.

Macrophage secretion of miR-106b-5p causes renin-dependent hypertension

Affiliations

Macrophage secretion of miR-106b-5p causes renin-dependent hypertension

J Oh et al. Nat Commun. .

Abstract

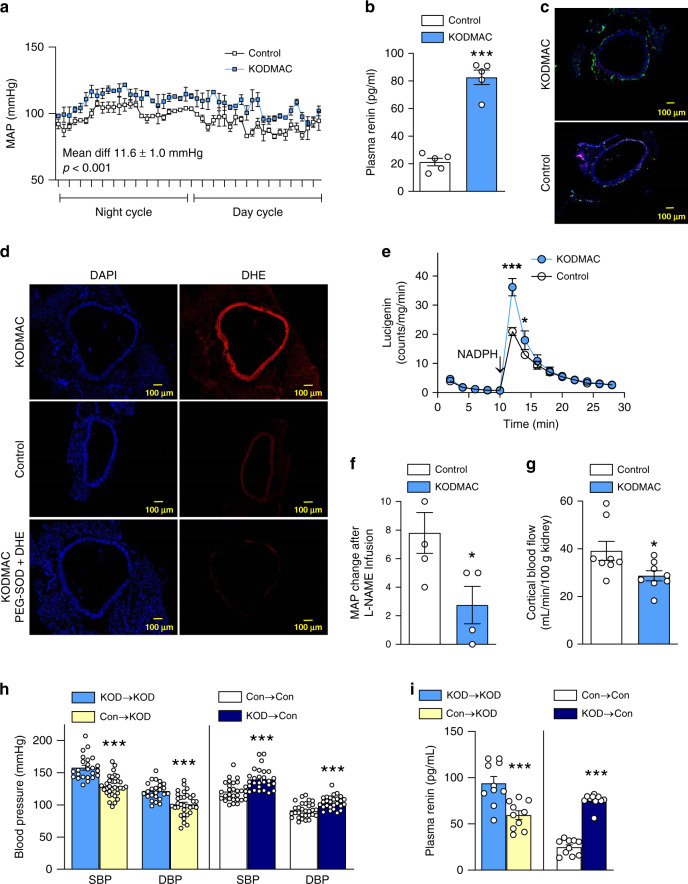
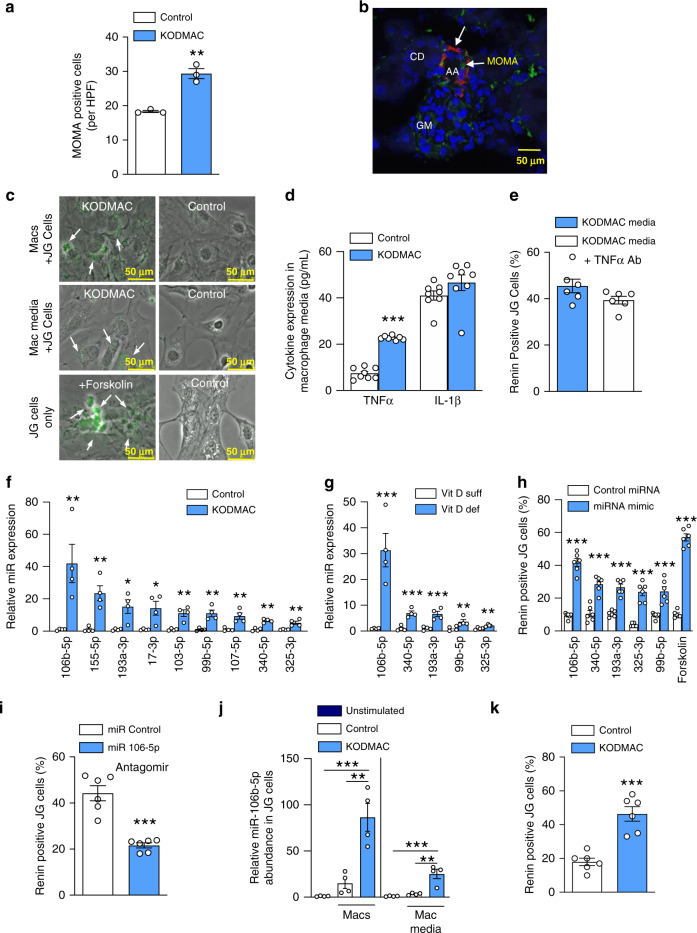
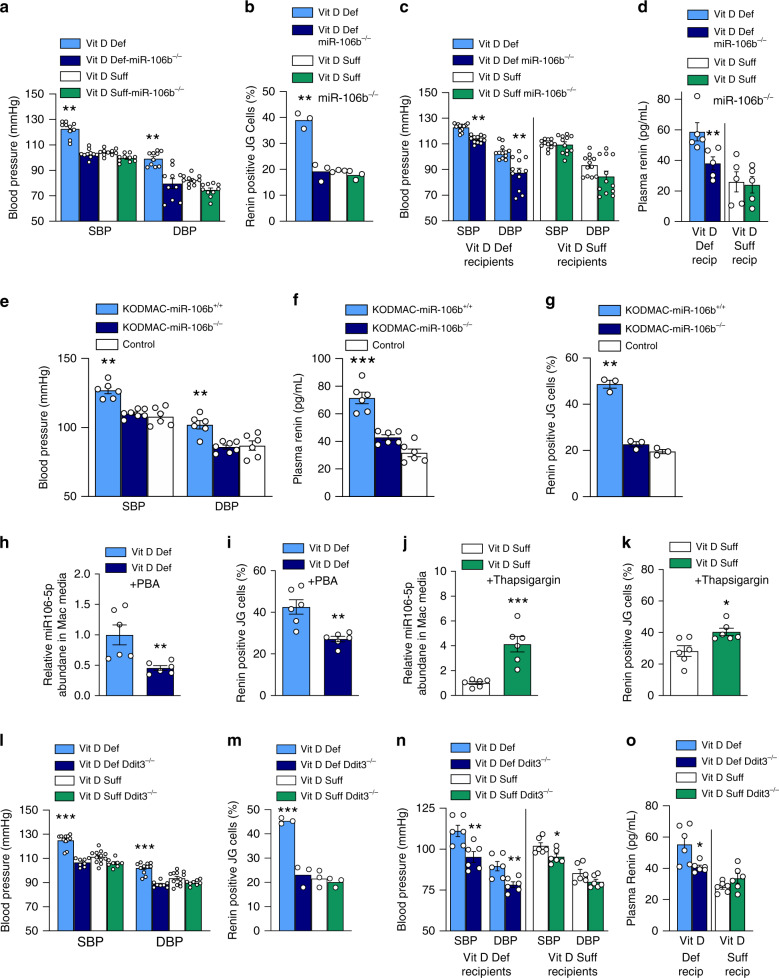
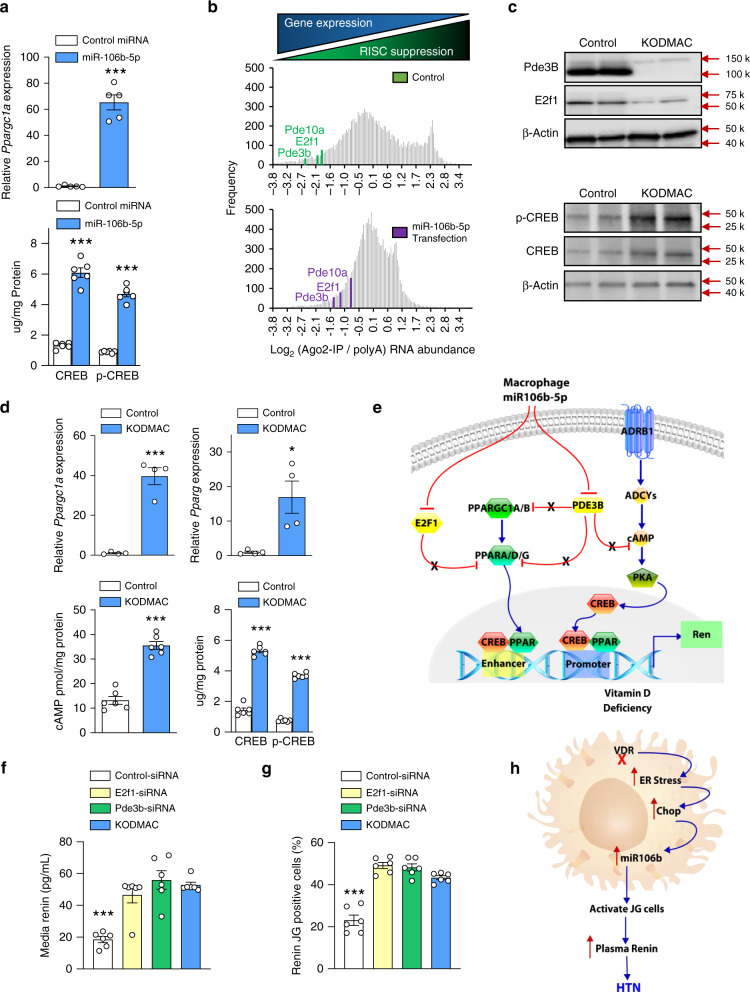
Myeloid cells are known mediators of hypertension, but their role in initiating renin-induced hypertension has not been studied. Vitamin D deficiency causes pro-inflammatory macrophage infiltration in metabolic tissues and is linked to renin-mediated hypertension. We tested the hypothesis that impaired vitamin D signaling in macrophages causes hypertension using conditional knockout of the myeloid vitamin D receptor in mice (KODMAC). These mice develop renin-dependent hypertension due to macrophage infiltration of the vasculature and direct activation of renal juxtaglomerular (JG) cell renin production. Induction of endoplasmic reticulum stress in knockout macrophages increases miR-106b-5p secretion, which stimulates JG cell renin production via repression of transcription factors E2f1 and Pde3b. Moreover, in wild-type recipient mice of KODMAC/miR106b-/- bone marrow, knockout of miR-106b-5p prevents the hypertension and JG cell renin production induced by KODMAC macrophages, suggesting myeloid-specific, miR-106b-5p-dependent effects. These findings confirm macrophage miR-106b-5p secretion from impaired vitamin D receptor signaling causes inflammation-induced hypertension.


Conflict of interest statement

The authors declare no competing interests.

Figures

Fig. 1
Fig. 1. Myeloid Vdr deletion induces hypertension by increasing vascular ROS.
In 8-week-old KODMAC (light-blue bar) or control mice (white bar): a invasive mean arterial BP (n = 3/group), b plasma renin (n = 5/group), distal thoracic aortic assessment of (c) MOMA staining (green, DAPI = blue) (representative of four/group, scale bars: 100 µm), d DHE staining (red, DAPI = blue) in the presence or absence of PEG-superoxide dismutase (representative of four/group, scale bars: 100 µm), e NADPH-stimulated lucigenin-enhanced chemiluminescence (n = 4/group), f increase in mean arterial blood pressure (MAP) with L-NAME (n = 5 Con/4 KOD), and g renal cortical blood flow (n = 8/group). Irradiated KODMAC mice transplanted with BM from KODMAC (KOD→KOD) (light-blue bar) or control (Con→KOD) (yellow bar) and irradiated control mice transplanted with BM from KODMAC (KOD→Con) (dark-blue bar) or control (Con→Con) (white bar). h Noninvasive BP (n = 24–33/group) and i plasma renin (n = 5/group). Data presented as mean ± SEM from (a) mixed model analysis, (bg) Student’s two-tailed unpaired t test with *P < 0.05, ***P < 0.001 vs. control, and (h, i) Student’s two-tailed unpaired t test with ***P < 0.001 vs. matched donor/recipient control transplant.
Fig. 2
Fig. 2. KODMAC macrophage miR-106b-5p secretion induces JG cell renin production.
a MOMA-positive cells per high-power field (HPF) in the kidney of KODMAC (light-blue bar) or control mice (white bar) (n = 3/group). b Confocal microscopy of JG apparatus in KODMAC mice with staining for renin (red), macrophages (green, MOMA-2), and merge (yellow) showing an afferent artery (AA), collecting duct (CD), and glomerulus (GM) (scale bars: 50 µm) (representative of n = 5). c Renin-positive (YFP-labeled Ren1c) JG cells (renin expression = green) cocultured with KODMAC or control macrophages or their media (forskolin = positive control) (representative of 6/group, scale bars: 50 µm). d Peritoneal macrophage media cytokine secretion from KODMAC or control mice (n = 8/group). e Renin-positive JG cells after culture with KODMAC macrophage media with or without anti-TNFα antibody (n = 6/group). Relative miRNA expression from (f) KODMAC or control peritoneal macrophage media exosomes (n = 4/group) and g vitamin D-deficient or -sufficient peritoneal macrophage media exosomes (n = 4/group). h Renin-positive JG cells after transfection with miRNA mimics (n = 6/group). i Renin-positive JG cells after transfection with miR-106b-5p antagomir or miR control and exposed to KODMAC macrophage media (n = 6/group). j miR-106b-5p abundance in JG cells before and after coculture with KODMAC or control peritoneal macrophages or their media (n = 4/group). k Renin positivity in JG cells transfected with pre-miR-106b siRNA, then cocultured with KODMAC or control macrophage media (n = 6/group). Data expressed as mean ± SEM from (ah, i, k) Student’s two-tailed unpaired t test with **P < 0.01, ***P < 0.001 vs. control or vitamin D-sufficient and j one-way ANOVA with Tukey’s post hoc test with **P < 0.01, ***P < 0.001.
Fig. 3
Fig. 3. Macrophage ER stress regulates miR-106-5p secretion and BP.
In dietary vitamin D-deficient or -sufficient miR-106b−/− or littermates: a noninvasive BP (n = 10/group) and b renin-positive (YFP-labeled Ren1c) JG cells (n = 3/group) after culture with macrophage media. In vitamin D-deficient (light- and dark-blue bars) or -sufficient control mice (white and green bars) transplanted with BM from miR-106b–/– or control mice on matched diet: c noninvasive BP (n = 12 recip/group) and d plasma renin (n = 5 recip/group). In wild-type recipients transplanted with BM from KODMAC/miR-106b−/− (light-blue bar), KODMAC/miR-106+/+ (dark-blue bar), or control Vdr+/+/miR-106+/+ mice (white bar): e noninvasive BP (n = 6/group), f plasma renin (n = 6/group), and g renin-positive JG cells after culture with macrophage media (n = 3/group). In JG cells cocultured with media from vitamin D-deficient peritoneal macrophages treated with (dark-blue bar) or without phenylbutyric acid (PBA) (light-blue bar): h miR-106b-5p abundance and i renin-positive cells (n = 6/group). In JG cells cocultured with media from vitamin D-sufficient peritoneal macrophages treated with (green bar) or without thapsigargin (white bar): j miR-106b-5p abundance and k renin-positive cells (n = 6/group). In Ddit3+/+ or Ddit3−/− mice fed vitamin D-deficient and -sufficient diets: l noninvasive BP (n = 8–11/group), m renin-positive JG cells after coculture with their peritoneal macrophage media (n = 3/group). In vitamin D-deficient (light- and dark-blue bars) or -sufficient control mice (white and green bars) transplanted with BM from Ddit3/ or control mice on matched diet: n noninvasive BP (n = 6 recip/group) and o plasma renin activity (n = 6 recip/group). Data expressed as mean ± SEM from (a, b, eg, l, m) one-way ANOVA with Tukey’s post hoc test with ***P < 0.001 vs. all, (c, d, n, o) Student’s two-tailed unpaired t test with *P < 0.05, **P < 0.01, ***P < 0.001 vs. matched donor/recipient diet, and (hk) Student’s two-tailed unpaired t test with *P < 0.05, **P < 0.01, ***P < 0.001 vs. vitamin D-deficient or -sufficient macrophage control media.
Fig. 4
Fig. 4. Enhancement of renin transcription by miR-106b-5p modulation of PPAR and CREB signaling.
a Pppargc1a mRNA expression and CREB (n = 5/group) and phospho-CREB protein abundance in miR-106b- (light-blue bar), or control- (white bar) transfected JG cells (n = 6/group). b Histogram displaying frequencies of log2 Ago2-IP vs. global polyA(RNA) abundance ratio for all detected mRNAs (gray bars) with positions of selected PPAR and CREB signaling mediators under control (green) and miR-106b-transfected (purple) conditions. c E2f1, Pde3b, CREB, and phospho-CREB protein expression in JG cells exposed to control (white bar) or KODMAC media (light-blue bar) (representative of 4/group). d Pppargc1a and Pparg mRNA expression (n = 4/group), and cAMP and CREB protein abundance in JG cells after culture with KODMAC or control peritoneal macrophage media (n = 6/group). e Schematic diagram of relevant cell signaling pathways. Macrophage miR-106b-5p inhibits JG cell E2f1 and Pde3b, removing inhibition of PCG1 and CREB pathways to induce renin production. Blue arrows represent stimulatory pathways and red lines represent inhibitory pathways, while X represents repressed inhibition. f Renin-positive (YFP-labeled Ren1c) JG cells and g renin secretion after transfection with siRNAs against E2f1 (yellow bar) or Pde3b (green bar) or coculture with KODMAC macrophage media (light-blue bar) (n = 6/group). h Mechanistic schematic diagram. Data expressed as mean ± SEM from (a, d) Student’s two-tailed unpaired t test with *P < 0.05, ***P < 0.001 vs. control and (f, g) one-way ANOVA with Tukey’s post hoc test with **P < 0.001 vs. all.

References

    1. Rapsomaniki E, et al. Blood pressure and incidence of twelve cardiovascular diseases: lifetime risks, healthy life-years lost, and age-specific associations in 1.25 million people. Lancet. 2014;383:1899–1911. doi: 10.1016/S0140-6736(14)60685-1. - DOI - PMC - PubMed
    1. Norlander AE, Madhur MS, Harrison DG. The immunology of hypertension. J. Exp. Med. 2018;215:21–33. doi: 10.1084/jem.20171773. - DOI - PMC - PubMed
    1. De Ciuceis C, et al. Reduced vascular remodeling, endothelial dysfunction, and oxidative stress in resistance arteries of angiotensin II-infused macrophage colony-stimulating factor-deficient mice: evidence for a role in inflammation in angiotensin-induced vascular injury. Arterioscler. Thromb. Vasc. Biol. 2005;25:2106–2113. doi: 10.1161/01.ATV.0000181743.28028.57. - DOI - PubMed
    1. Wenzel P, et al. Lysozyme M-positive monocytes mediate angiotensin II-induced arterial hypertension and vascular dysfunction. Circulation. 2011;124:1370–1381. doi: 10.1161/CIRCULATIONAHA.111.034470. - DOI - PubMed
    1. Scragg R, Sowers M, Bell C. Serum 25-hydroxyvitamin D, ethnicity, and blood pressure in the third national health and nutrition examination survey. Am. J. Hypertens. 2007;20:713–719. doi: 10.1016/j.amjhyper.2007.01.017. - DOI - PubMed

Publication types

Supplementary concepts