. 2020 Sep 23;11(1):4799.
doi: 10.1038/s41467-020-18534-1.

Risk prediction of late-onset Alzheimer's disease implies an oligogenic architecture

Collaborators, Affiliations

Risk prediction of late-onset Alzheimer's disease implies an oligogenic architecture

Qian Zhang et al. Nat Commun. .

Abstract

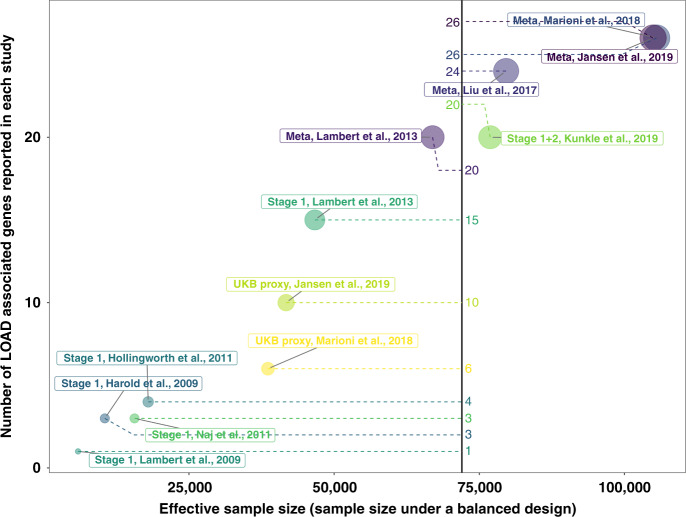
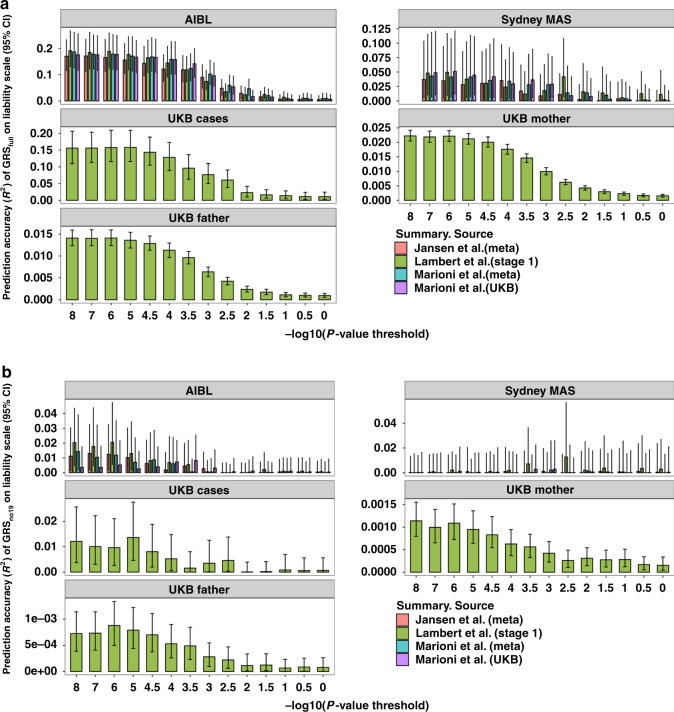
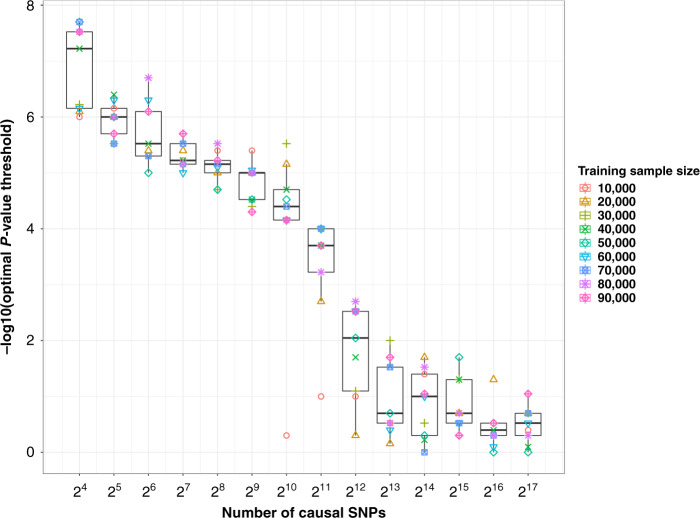
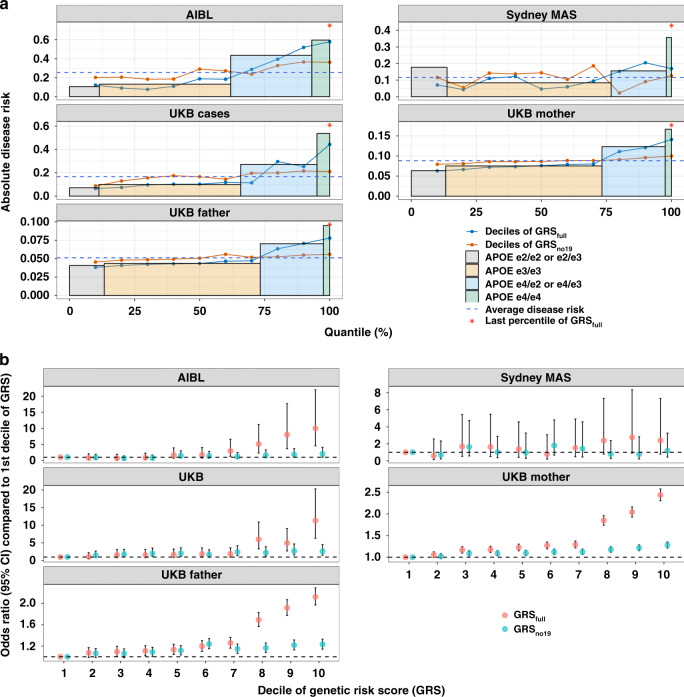
Genetic association studies have identified 44 common genome-wide significant risk loci for late-onset Alzheimer's disease (LOAD). However, LOAD genetic architecture and prediction are unclear. Here we estimate the optimal P-threshold (Poptimal) of a genetic risk score (GRS) for prediction of LOAD in three independent datasets comprising 676 cases and 35,675 family history proxy cases. We show that the discriminative ability of GRS in LOAD prediction is maximised when selecting a small number of SNPs. Both simulation results and direct estimation indicate that the number of causal common SNPs for LOAD may be less than 100, suggesting LOAD is more oligogenic than polygenic. The best GRS explains approximately 75% of SNP-heritability, and individuals in the top decile of GRS have ten-fold increased odds when compared to those in the bottom decile. In addition, 14 variants are identified that contribute to both LOAD risk and age at onset of LOAD.


Conflict of interest statement

The authors declare no competing interests.

Figures

Fig. 1
Fig. 1. The relationship between sample size and number of identified genes.
Sample size is calculated as the total number of cases and controls under a balanced design (50% cases and 50% controls). Genes associated with LOAD were collected from different studies. They are the closest genes to SNPs (minor allele frequency >0.01) genome-wide significantly (P< 5 × 10−8) associated with LOAD. “Stage 1” means summary statistics based on the samples from stage 1 in that study and “Meta” means summary statistics from the meta-analysis from that study.
Fig. 2
Fig. 2. The prediction performance of genetic risk score (GRS) in different datasets.
a The prediction accuracy of GRSfull based on SNPs selected using different P-value thresholds. GRSfull was calculated based on 1,056,154 HapMap3 SNPs and two APOE SNPs. b The prediction accuracy of GRSno19 based on SNPs selected using different P-value thresholds. GRSno19 is calculated based on HapMap3 SNPs excluding SNPs from chromosome 19, to avoid contamination with APOE. Prediction results on samples from UKB cases and UKB parents are based on summary statistics from Lambert et al. (stage 1) only. The error bars represent 95% confidence interval, and the confidence interval was calculated based on 1000 bootstrap replications.
Fig. 3
Fig. 3. The relationship between optimal GRS P-value threshold and number of causal SNPs.
Causal SNPs were selected from 1,037,804 HapMap3 SNPs. For each scenario, we generated a phenotype of 100,000 individuals based on a specified number of causal SNPs (e.g., 128) with heritability 0.09. We randomly selected 10,000 individuals as the test set. Based on the unselected individuals, we randomly chose 10,000, 20,000, 30,000, 40,000, 50,000, 60,000, 70,000, 80,000 and 90,000 individuals separately as training sets and used them to perform GWAS. We examined the performance of genetic risk score (based on LD clumping with 80 separate P-value thresholds) on the test set (Ntest = 10,000) and selected the optimal P-value threshold. Box plot shows the median (centre line), the interquartile range (box) and whiskers (±1.5 times interquartile range).
Fig. 4
Fig. 4. The comparison of LOAD prediction performance between GRS and APOE.
a The disease risk of late-onset Alzheimer’s disease of individuals in different deciles of GRS (both GRSfull and GRSno19), last percentile of GRSfull and in individuals with APOE ɛ2/ɛ2 or ɛ2/ɛ3, APOE ɛ3 homozygotes (ɛ3/ɛ3), APOE ɛ4 heterozygotes (ɛ4/ɛ3 or ɛ4/ɛ2) and APOE ɛ4 homozygotes (ɛ4/ɛ4). Samples from AIBL, Sydney MAS, UKB cases, UKB mother and UKB father were examined. b Odds ratio between individuals in the other deciles and first decile of GRS. GRSfull was calculated based on 1,056,154 HapMap3 SNPs and two APOE SNPs. GRSno19 was calculated based on HapMap3 SNPs but excluding SNPs from chromosome 19. Only independent (R2 < 0.01) SNPs with P < 1 × 10−8 were used to calculate the GRS. The error bars in b represent 95% confidence interval.

References

    1. Harman D. Alzheimer’s disease pathogenesis: role of aging. Ann. N.Y. Acad. Sci. 2006;1067:454–460. doi: 10.1196/annals.1354.065. - DOI - PubMed
    1. Gatz M, et al. Role of genes and environments for explaining Alzheimer disease. Arch. Gen. Psychiatry. 2006;63:168–174. doi: 10.1001/archpsyc.63.2.168. - DOI - PubMed
    1. Lee SH, et al. Estimation and partitioning of polygenic variation captured by common SNPs for Alzheimer’s disease, multiple sclerosis and endometriosis. Hum. Mol. Genet. 2013;22:832–841. doi: 10.1093/hmg/dds491. - DOI - PMC - PubMed
    1. Ridge PG, Mukherjee S, Crane PK, Kauwe JS, Alzheimer’s Disease Genetics Consortium. Alzheimer’s disease: analyzing the missing heritability. PLoS ONE. 2013;8:e79771. doi: 10.1371/journal.pone.0079771. - DOI - PMC - PubMed
    1. Brainstorm Consortium et al. Analysis of shared heritability in common disorders of the brain. Science. 2018;360:eaap8757. doi: 10.1126/science.aap8757. - DOI - PMC - PubMed

Publication types