Comparative Study
. 2020 Sep 23;11(1):4812.
doi: 10.1038/s41467-020-18611-5.

Massive and rapid COVID-19 testing is feasible by extraction-free SARS-CoV-2 RT-PCR

Affiliations
Comparative Study

Massive and rapid COVID-19 testing is feasible by extraction-free SARS-CoV-2 RT-PCR

Ioanna Smyrlaki et al. Nat Commun. .

Abstract

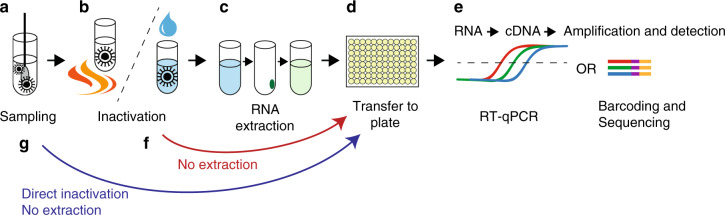
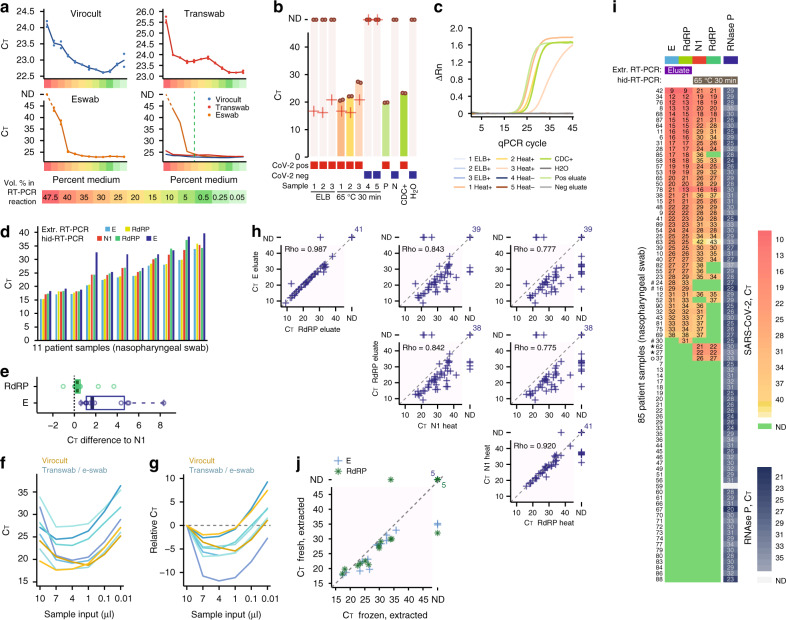
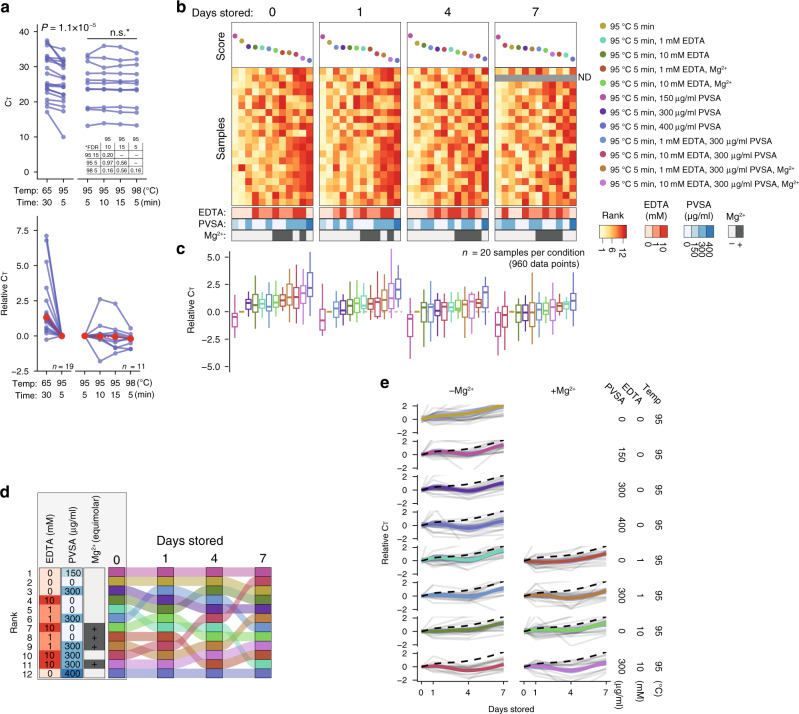
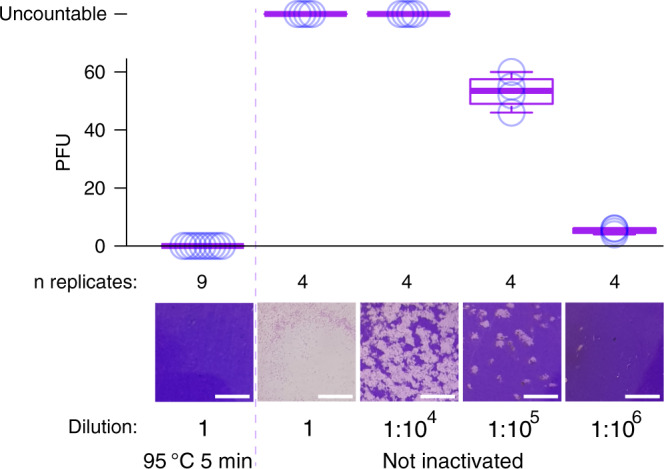
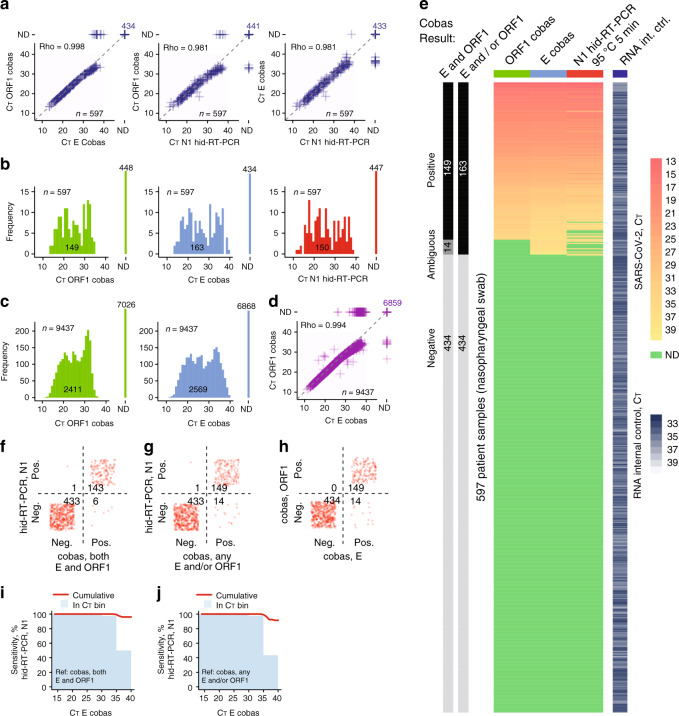
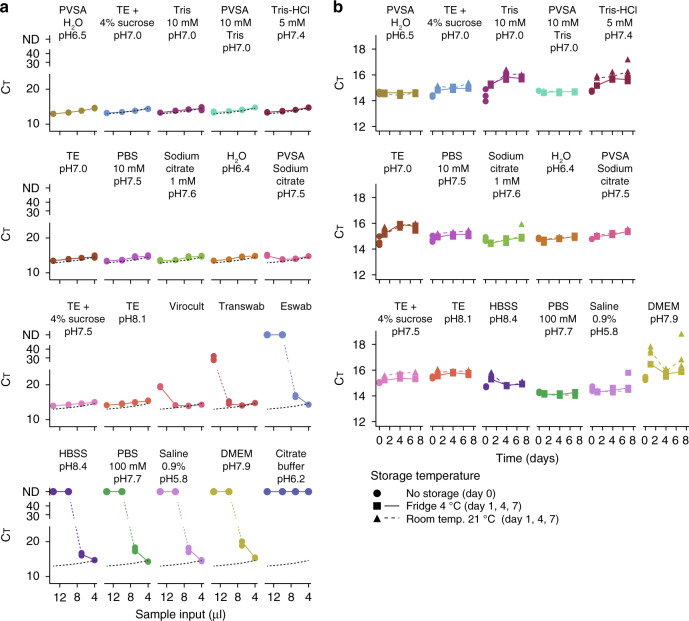
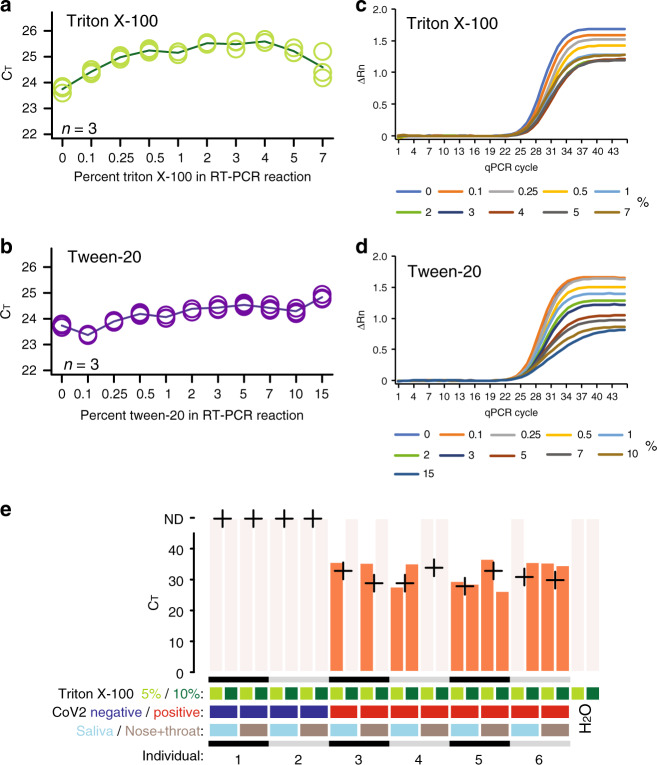
Coronavirus disease 2019 (COVID-19), caused by severe acute respiratory syndrome coronavirus 2 (SARS-CoV-2), is commonly diagnosed by reverse transcription polymerase chain reaction (RT-PCR) to detect viral RNA in patient samples, but RNA extraction constitutes a major bottleneck in current testing. Methodological simplification could increase diagnostic availability and efficiency, benefitting patient care and infection control. Here, we describe methods circumventing RNA extraction in COVID-19 testing by performing RT-PCR directly on heat-inactivated or lysed samples. Our data, including benchmarking using 597 clinical patient samples and a standardised diagnostic system, demonstrate that direct RT-PCR is viable option to extraction-based tests. Using controlled amounts of active SARS-CoV-2, we confirm effectiveness of heat inactivation by plaque assay and evaluate various generic buffers as transport medium for direct RT-PCR. Significant savings in time and cost are achieved through RNA-extraction-free protocols that are directly compatible with established PCR-based testing pipelines. This could aid expansion of COVID-19 testing.


Conflict of interest statement

The authors declare no competing interests.

Figures

Fig. 1
Fig. 1. Schematic overview of SARS-CoV-2 RT-PCR testing procedure.
The currently widely used procedure for COVID-19 testing involves: a Collection of patient material and deposition of potential SARS-CoV-2 viral particles in transport medium. b Inactivation of the virus by detergent/chaotropic reagents or by heating. c RNA extraction. d, e Transfer to PCR-plate (96/384-well) format in which cDNA synthesis by RT and detection by qPCR may take place. Alternatively, detection can be made by sample barcoding and high-throughput DNA sequencing. f, g Unlike the widely used approach, which includes an RNA extraction step (c) using industrial RNA extraction kits, direct sample testing circumvents this process by omitting extraction. Instead, after clinical samples are deposited in transport medium, viral particles are inactivated either through heating or by direct lysis in detergent-containing buffer. The inactivated samples are then used for the downstream RT-PCR diagnostic reaction.
Fig. 2
Fig. 2. SARS-CoV-2 hid-RT-PCR on frozen nasopharyngeal swab samples.
a CT values from RT-qPCR performed on dilution series of transport medium (Virocult, Transwab, and Eswab) using 50,000 spiked copies of synthetic full-genome SARS-CoV-2 RNA and the N1 primer-probe set. Lines represent the mean of duplicates, shown individually as dots. ND: not detected. b Bar plots of CT from SARS-CoV-2 hid-RT-PCR on clinical nasopharyngeal swabs inactivated with MagNA Pure 96 External Lysis Buffer (ELB) or heat (65 °C 30 min). Dots indicate CT of hid-RT-PCR duplicates and crosses indicate CT values from diagnostics performed on fresh extracted RNA. Positive controls were extracted RNA from a positive sample (P) and a CDC positive control DNA plasmid (CDC+). Negative controls were extracted RNA from a negative sample (N) and water (H2O). ND: not detected. c Amplification plots showing normalized reporter value (ΔRn, linear scale) as a function of qPCR cycle for the experiment and samples described in (b). (d) Bar plots of CT values of 11 positive nasopharyngeal swab samples using primer-probe sets targeting SARS-CoV-2 gene E, N, and RdRP. e Boxplots of CT difference in same samples as in (d) comparing E and RdRP with the N1 primer-probe-set. Center lines denote the median, hinges denote the interquartile range (IQR) and whiskers denote outlier points at maximum 1.5 × IQR. fg Line charts of CT from individual clinical samples (colored lines) using variable amount of sample input. Shown as absolute CT (f) or CT relative to the 10 μl input (g). h Scatter plots of CT values from clinical diagnostics performed on extracted RNA (y-axis) and hid-RT-PCR (x-axis) of 85 nasopharyngeal swab samples, shown for different primer-probe set comparisons. Rho indicates Spearman correlation of positive samples. ND: not detected. i Heatmap of CT values from diagnostics performed on 85 clinical samples using extracted RNA (E, RdRP) and hid-RT-PCR (N1, RdRP), ranked by E gene CT. Control for sample integrity by RT-PCR for RNase P in the same samples shown on the right. Two patients, marked with asterisk, were negative in extraction-based diagnostics but positive by hid-RT-PCR. The patients were later re-tested by extraction-based clinical diagnostics and confirmed to be SARS-CoV-2 positive. The patient marked with a ring was not re-tested. Three samples, marked with hash, were called COVID-19 positive by routine diagnostics but not by any primer-set in hid-RT-PCR. j Scatter plot of CT values from 19 matched fresh (y-axis) and freeze-thawed (x-axis) extracted samples, using the E gene (cross) and RdRP (star) primer-probe sets. ND: not detected. hid-RT-PCR shown in this figure was performed on previously diagnosed frozen samples.
Fig. 3
Fig. 3. Optimisation of heat-inactivation conditions for SARS-CoV-2 hid-RT-PCR.
a CT values for aliquots of nasopharyngeal swab samples inactivated at different temperature and time conditions, shown on absolute scale (left) and CT change relative to the 95 °C 5 min condition (right). P-values calculated as two-tailed Wilcoxon signed rank tests. *FDR corrected for multiple testing. Median values shown in red. b Heatmaps of ranks based on absolute CT values for nasopharyngeal swab samples (n = 20) with or without addition of polyvinylsulfonic acid (PVSA) and/or ethylenediaminetetraacetic acid (EDTA) before performing heat inactivation at 95 °C for 5 min. For EDTA-containing samples, equimolar supplement of MgCl2 was added to the RT-PCR reaction as indicated. The same samples were evaluated by RT-qPCR repeatedly at different number of days stored at 4 °C after the heat activation. All conditions are listed in Table 2. c Boxplots of CT values relative to the 95 °C condition without additives, ordered by the rank in (b). Center lines denote the median, hinges denote IQR and whiskers denote outlier points at maximum 1.5 × IQR. d Change in rank over days of storage at 4 °C. Colors and order same as in (b, c). Annotations refer to samples stored for 0 days. e Change in CT values over days stored at 4 °C across different conditions. Thick line and ribbon indicate fitted LOESS curve and ±95% confidence interval, respectively. The dashed line indicates the 95 °C (without additive) condition.
Fig. 4
Fig. 4. Heat-inactivation of SARS-CoV-2 confirmed by plaque assay.
Box plots showing the number of plaque forming units (PFU) observed after heat inactivation (95 °C 5 min, left) of in vitro propagated active SARS-CoV-2 as well as for a dilution series of SARS-CoV-2 without heat inactivation (right), with circles indicating the values of individual replicates. Center lines denote the median, hinges denote IQR and whiskers denote outlier points at maximum 1.5 × IQR. Virus was added to 9.6 cm2 dishes seeded with 1 million Vero E6 cells and plaque assays were performed as described in “Methods”. Undiluted samples contained ~2.5 million PFU of SARS-CoV-2. Representative images are shown below each condition (scale bar 5 mm).
Fig. 5
Fig. 5. Validation of SARS-CoV-2 hid-RT-PCR.
a Scatter plots of CT values from clinical diagnostics performed on the Roche Diagnostics cobas 6800 (y-axis) and hid-RT-PCR (x-axis) for 597 nasopharyngeal swab samples, shown for different primer-probe set comparisons. Rho indicates Spearman correlation of positive samples. ND: not detected. b Histograms of CT values from 597 paired nasopharyngeal swab samples shown for the following primer-probe sets and conditions: cobas ORF1, cobas E, and hid-RT-PCR N1. ND: not detected. c Histograms of CT values from 9437 clinical samples analysed on a cobas 6800, show for ORF1 (left) and E (right). d Scatter plots of CT values from 9437 clinical samples analysed on a cobas 6800. Rho indicates Spearman correlation of positive samples. ND: not detected. e Heatmap of CT values from diagnostics performed on 597 clinical nasopharyngeal swab samples using the cobas 6800 (ORF1 and E primer-probe sets) and hid-RT-PCR (N1). The bars to the left indicate the clinical call from the cobas diagnostics, considering detection either in both or only one (any) primer-probe set for the diagnostic call. fh Confusion matrix of diagnostic call from cobas 6000 and hid-RT-PCR (N1) for the data shown in (e). i Percent sensitivity of hid-RT-PCR (N1) using cobas ORF1 and E primer-probe sets as reference, shown as a function of CT threshold for the same sample as detected by the cobas primer-probe set E. The red lines denote the cumulative sensitivity below the given CT threshold and the bars denote the sensitivity in 5-CT bins. j Same as (i) but using cobas ORF1 and/or E primer-probe sets as reference for calculating sensitivity.
Fig. 6
Fig. 6. Identification of generic transport buffers optimal for SARS-CoV-2 hid-RT-PCR.
a Line charts of CT values (y-axis) from hid-RT-PCR (N1 primer-probe pair) for different volume of input sample (13.5, 10, 7, or 4 μl to a 20 μl reaction; x-axis), showing the inhibition profile of different transport buffers and media. The experiment was performed by adding equal amount of in vitro expanded SARS-CoV-2 to each buffer condition in experimental triplicates (dots). The dotted black lines indicate PVSA in H2O condition, included for comparison. The buffers are ordered according to minimal CT. b Line charts of CT values (y-axis) from hid-RT-PCR (N1 primer-probe pair, 4 μl input to 20 μl reactions) of in vitro expanded SARS-CoV-2 stored in different buffers for up to 7 days (x-axis) in fridge (4 °C, square) or room temperature (21 °C, triangle) before subjecting the samples to heat inactivation (95 °C 30 min) and hid-RT-PCR. The data are shown as individual replicates (points, n = 3) and median (line).
Fig. 7
Fig. 7. Direct SARS-CoV-2 RT-PCR detection from lysate.
a, b Line charts of CT values (y-axis) from RT-qPCR performed with different percent (vol./vol.) Triton X-100 (a) or Tween-20 (b) (x-axis) in the reaction. c, d Amplification plots showing normalized reporter value (ΔRn, linear scale) as a function of qPCR cycle for the experiments and samples described in (a, b). e Barplots of CT from SARS-CoV-2 RT-PCR using the N1 primer-probe set performed directly on lysed donor samples after storage and freeze thaw from self-sampling (saliva or nasal + throat swab suspensions taken with cotton tipped wooden sticks) without purification. Percent Triton X-100 indicates the percentage detergent in the sample (half concentration in the RT-PCR reaction). Crosses indicate CT values from diagnostics performed on extracted RNA from fresh aliquots.

References

    1. Taipale, J., Romer, P. & Linnarsson, S. Population-scale testing can suppress the spread of COVID-19. medRxiv.org, 2020.04.27.20078329 (2020).
    1. Ferguson, N. M. et al. Impact of non-pharmaceutical interventions (NPIs) to reduce COVID-19 mortality and healthcare demand. Imperial College COVID-19 Response Team; https://www.imperial.ac.uk/media/imperial-college/medicine/sph/ide/gida-... (2020). - PMC - PubMed
    1. Corman VM, et al. Assays for laboratory confirmation of novel human coronavirus (hCoV-EMC) infections. Eurosurveillance. 2012;17:2–10. - PubMed
    1. Corman VM, et al. Detection of 2019 novel coronavirus (2019-nCoV) by real-time RT-PCR. Eurosurveillance. 2020;25:23–30. - PMC - PubMed
    1. Centers for Disease Control and Prevention. Real-Time RT-PCR Panel for Detection 2019-Novel Coronavirus. https://www.cdc.gov/coronavirus/2019-ncov/downloads/rt-pcr-panel-for-det... (2020).

MeSH terms