

Identification of a distinct association fiber tract "IPS-FG" to connect the intraparietal sulcus areas and fusiform gyrus by white matter dissection and tractography
- PMID: 32968114
- PMCID: PMC7511306
- DOI: 10.1038/s41598-020-72471-z
Identification of a distinct association fiber tract "IPS-FG" to connect the intraparietal sulcus areas and fusiform gyrus by white matter dissection and tractography
Abstract
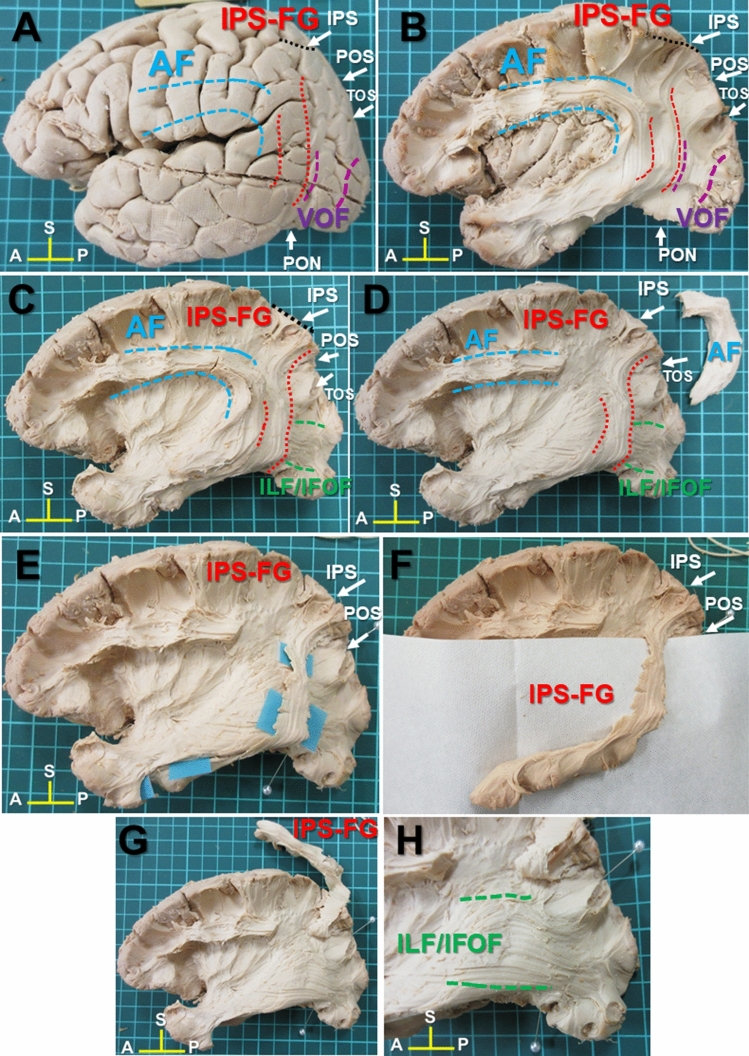
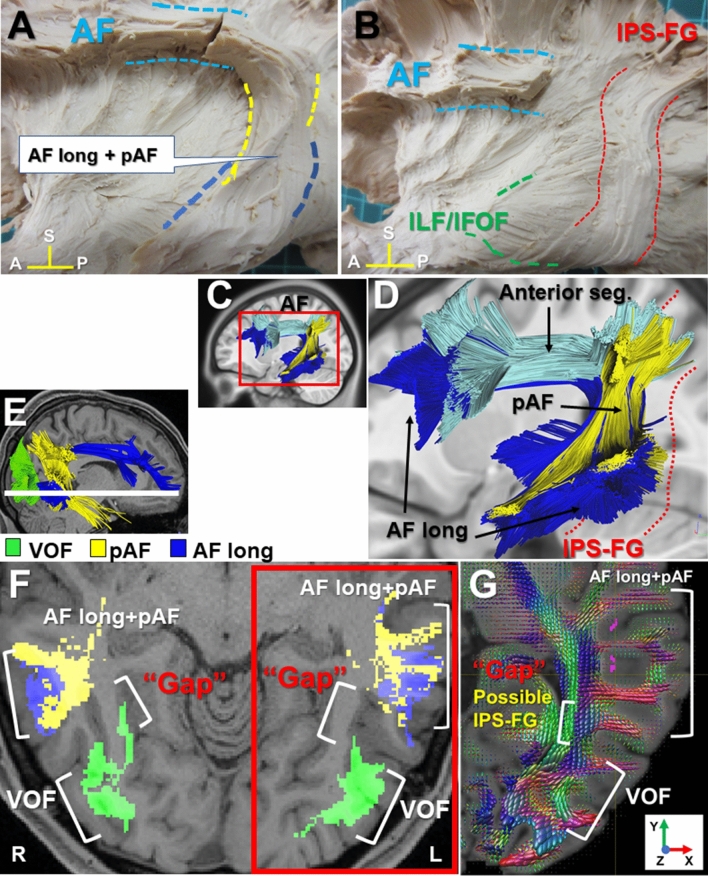
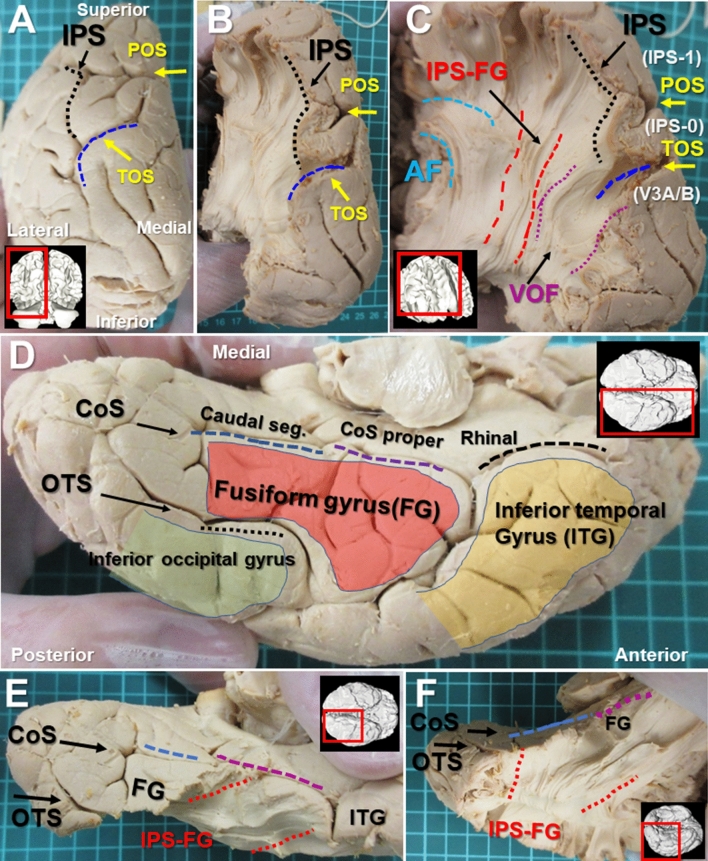
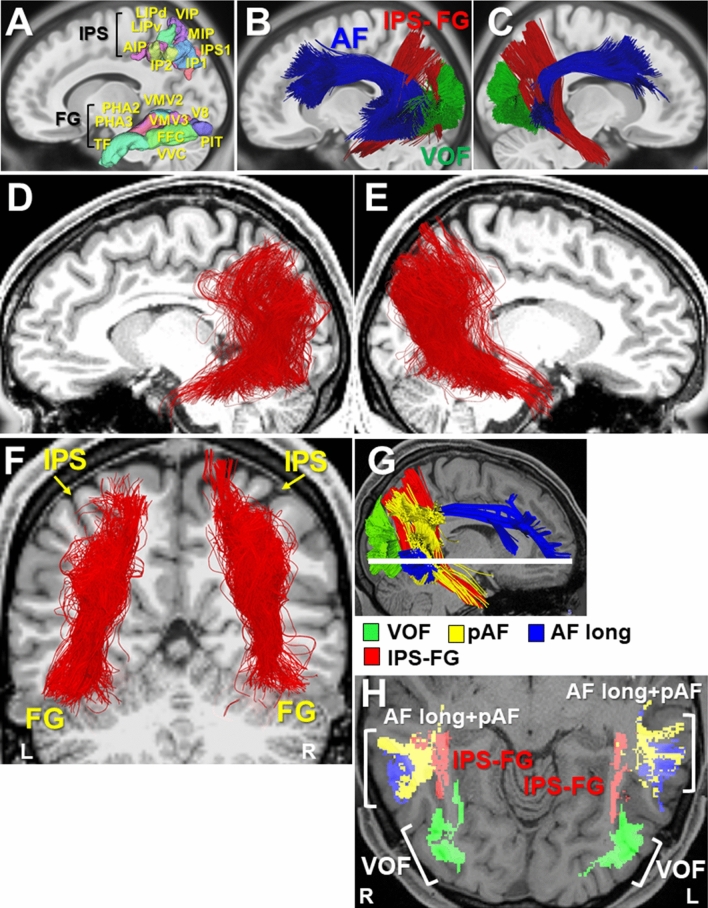
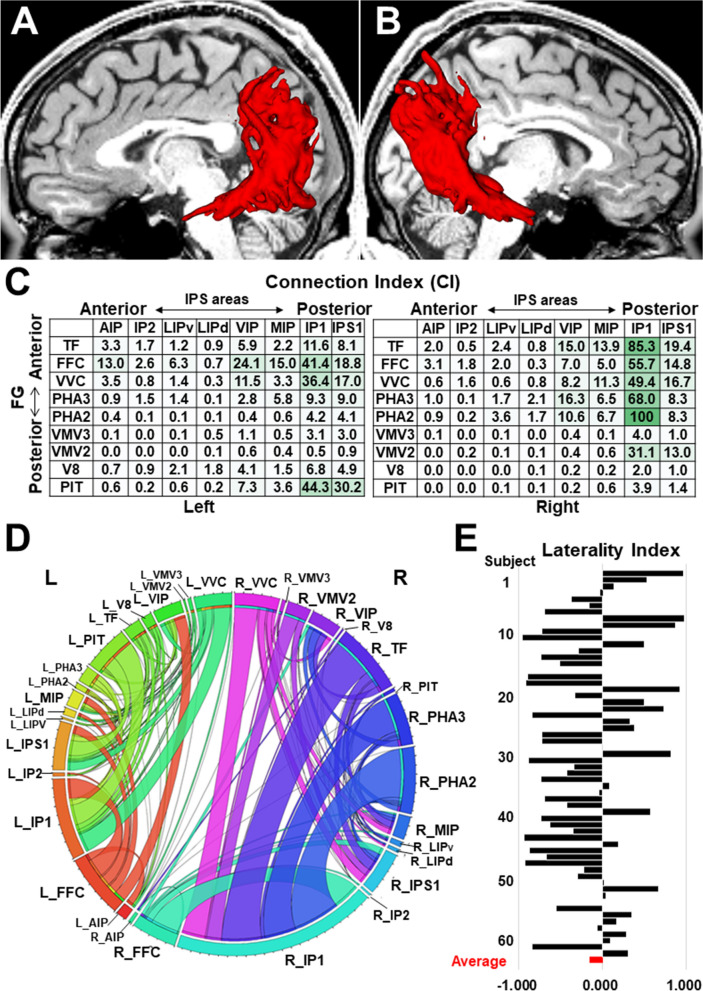
The intraparietal sulcus (IPS) in the posterior parietal cortex (PPC) is well-known as an interface for sensorimotor integration in visually guided actions. However, our understanding of the human neural network between the IPS and the cortical visual areas has been devoid of anatomical specificity. We here identified a distinctive association fiber tract "IPS-FG" to connect the IPS areas and the fusiform gyrus (FG), a high-level visual region, by white matter dissection and tractography. The major fiber bundles of this tract appeared to arise from the medial bank of IPS, in the superior parietal lobule (SPL), and project to the FG on the ventral temporal cortex (VTC) in post-mortem brains. This tract courses vertically at the temporo-parieto-occipital (TPO) junction where several fiber tracts intersect to connect the dorsal-to-ventral cortical regions, including the vertical occipital fasciculus (VOF). We then analyzed the structural connectivity of this tract with diffusion-MRI (magnetic resonance imaging) tractography. The quantitative tractography analysis revealed the major streamlines of IPS-FG interconnect the posterior IPS areas (e.g., IP1, IPS1) with FG (e.g., TF, FFC, VVC, PHA2, PIT) on the Human Connectome Project multimodal parcellation atlas (HCP MMP 1.0). Since the fronto-parietal network, including the posterior IPS areas, is recruited by multiple cognitive demands, the IPS-FG could play a role in the visuomotor integration as well as the top-down modulation of various cognitive functions reciprocally.
Conflict of interest statement
The authors declare no competing interests.
Figures
Similar articles
-
Structure, asymmetry, and connectivity of the human temporo-parietal aslant and vertical occipital fasciculi.Brain Struct Funct. 2019 Mar;224(2):907-923. doi: 10.1007/s00429-018-1812-0. Epub 2018 Dec 12. Brain Struct Funct. 2019. PMID: 30542766 Free PMC article.
-
Microsurgical Anatomy of the Vertical Rami of the Superior Longitudinal Fasciculus: An Intraparietal Sulcus Dissection Study.Oper Neurosurg. 2019 Feb 1;16(2):226-238. doi: 10.1093/ons/opy077. Oper Neurosurg. 2019. PMID: 29873781
-
The ventral pathway of the human brain: A continuous association tract system.Neuroimage. 2021 Jul 1;234:117977. doi: 10.1016/j.neuroimage.2021.117977. Epub 2021 Mar 21. Neuroimage. 2021. PMID: 33757905
-
The vertical superior longitudinal fascicle and the vertical occipital fascicle.J Neurosurg Sci. 2021 Dec;65(6):581-589. doi: 10.23736/S0390-5616.21.05368-6. J Neurosurg Sci. 2021. PMID: 35128919 Review.
-
Anatomical variability of the arcuate fasciculus: a systematical review.Surg Radiol Anat. 2019 Aug;41(8):889-900. doi: 10.1007/s00276-019-02244-5. Epub 2019 Apr 26. Surg Radiol Anat. 2019. PMID: 31028450
Cited by
-
A taxonomy of the brain's white matter: twenty-one major tracts for the 21st century.Cereb Cortex. 2022 Oct 8;32(20):4524-4548. doi: 10.1093/cercor/bhab500. Cereb Cortex. 2022. PMID: 35169827 Free PMC article.
-
The neural networks of touch observation.Imaging Neurosci (Camb). 2024 Jan 11;2:imag-2-00065. doi: 10.1162/imag_a_00065. eCollection 2024. Imaging Neurosci (Camb). 2024. PMID: 40800392 Free PMC article.
-
Reciprocal interactions among parietal and occipito-temporal representations support everyday object-directed actions.Neuropsychologia. 2024 Jun 6;198:108841. doi: 10.1016/j.neuropsychologia.2024.108841. Epub 2024 Feb 29. Neuropsychologia. 2024. PMID: 38430962 Free PMC article.
-
Searching for optimal machine learning model to classify mild cognitive impairment (MCI) subtypes using multimodal MRI data.Sci Rep. 2022 Mar 11;12(1):4284. doi: 10.1038/s41598-022-08231-y. Sci Rep. 2022. PMID: 35277565 Free PMC article.
-
Tactually-related cognitive impairments: sharing of neural substrates across associative tactile agnosia, agraphesthesia, and kinesthetic reading difficulty.Acta Neurol Belg. 2023 Oct;123(5):1893-1902. doi: 10.1007/s13760-022-02130-9. Epub 2022 Nov 7. Acta Neurol Belg. 2023. PMID: 36336779
References
Publication types
MeSH terms
Grants and funding
LinkOut - more resources
Full Text Sources
Miscellaneous
