. 2020 Sep 23;10(1):15562.
doi: 10.1038/s41598-020-72576-5.

Injectable pre-cultured tissue modules catalyze the formation of extensive functional microvasculature in vivo

Affiliations

Injectable pre-cultured tissue modules catalyze the formation of extensive functional microvasculature in vivo

Nicole E Friend et al. Sci Rep. .

Abstract

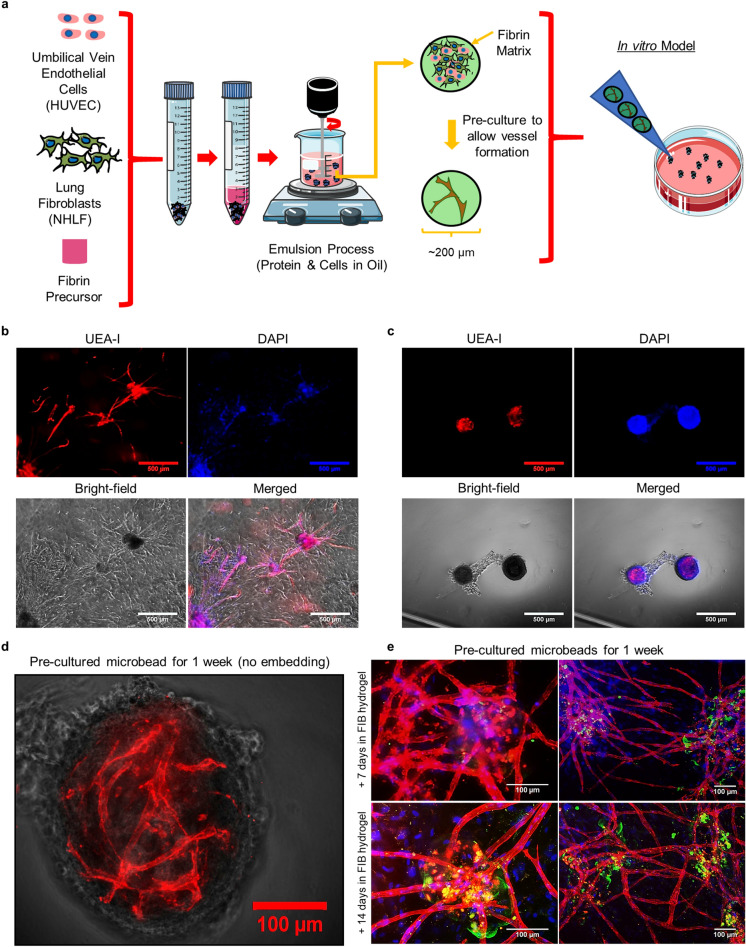
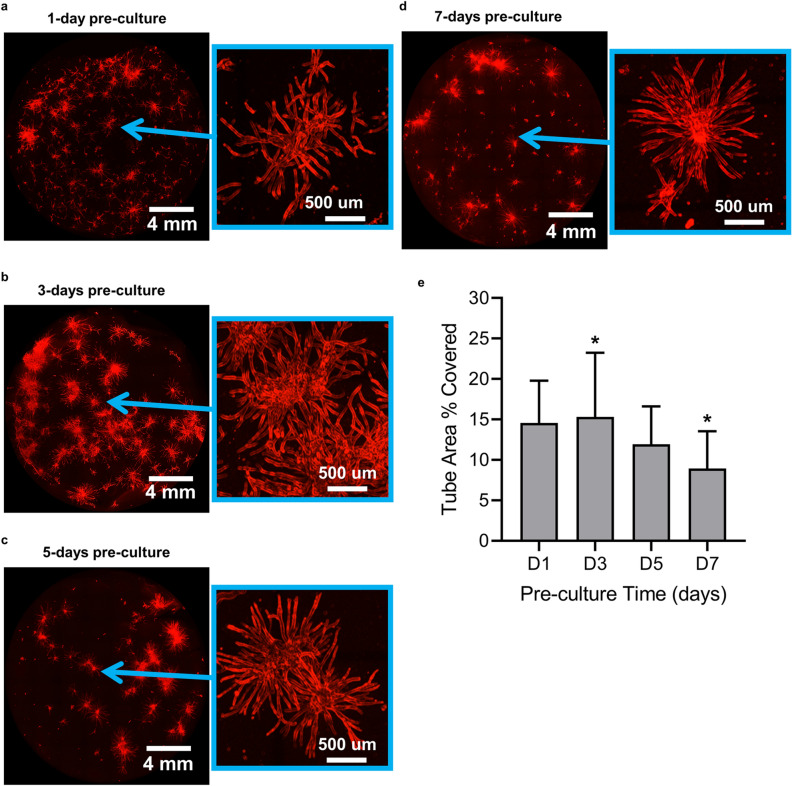
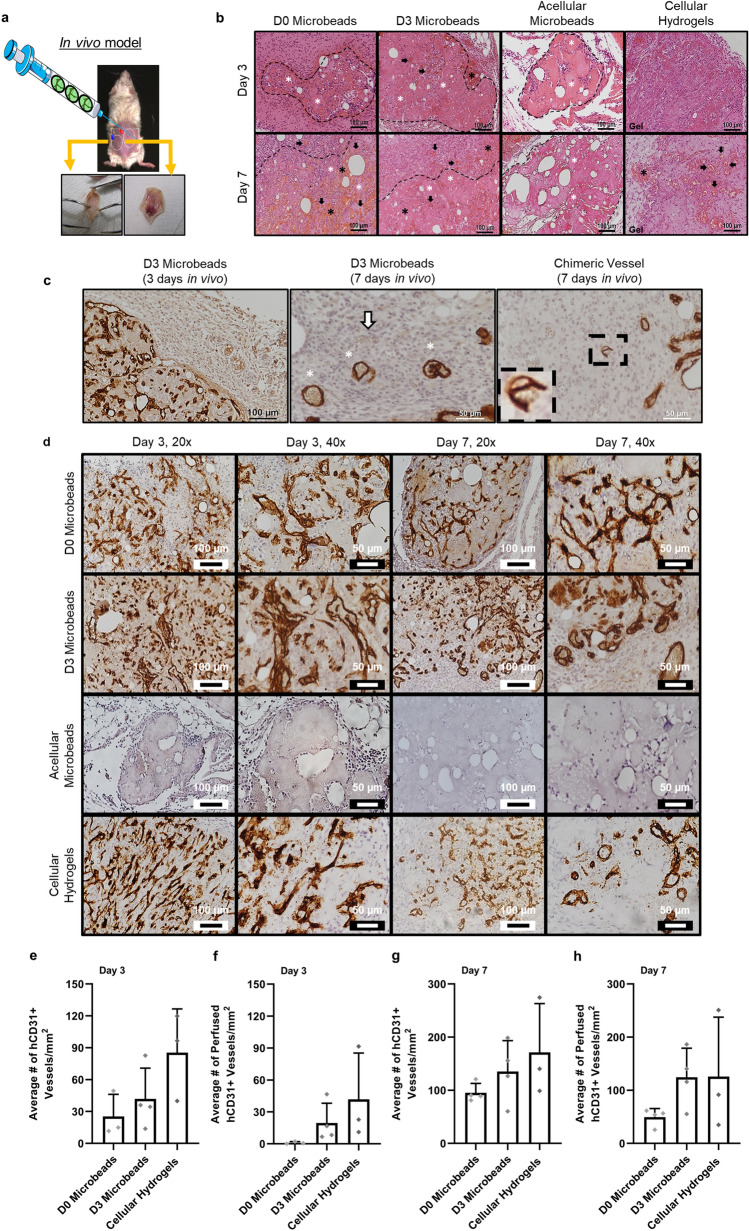
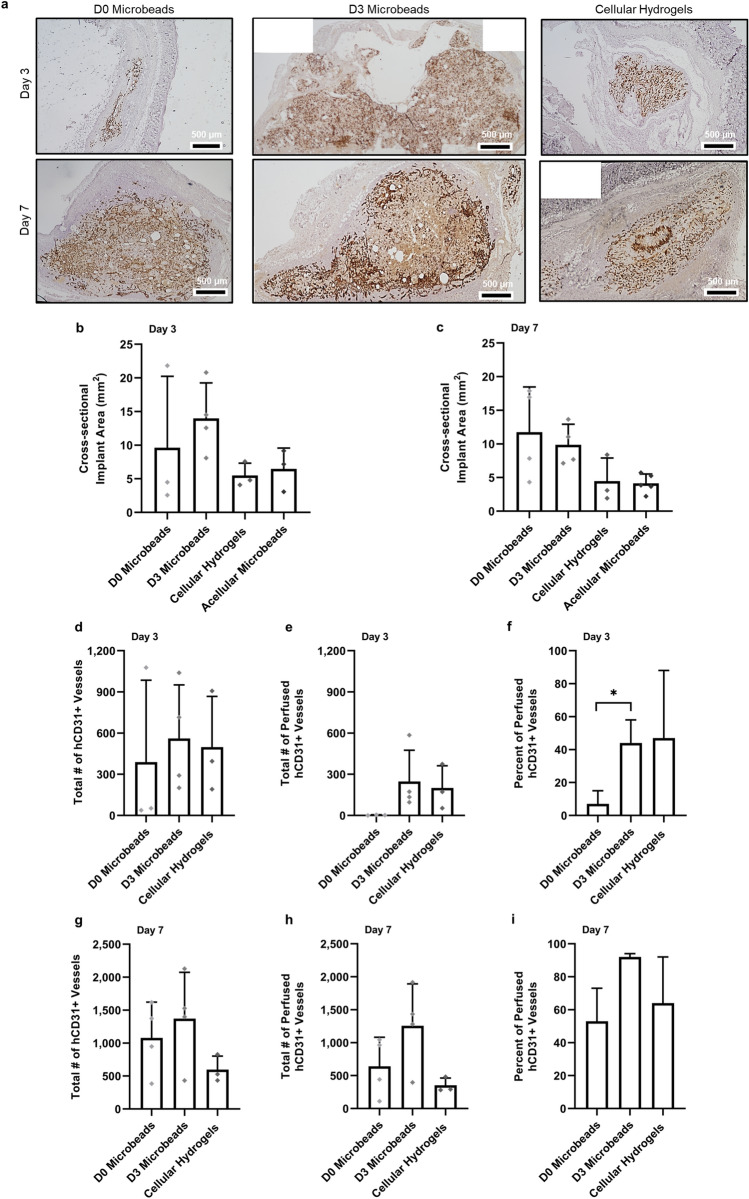
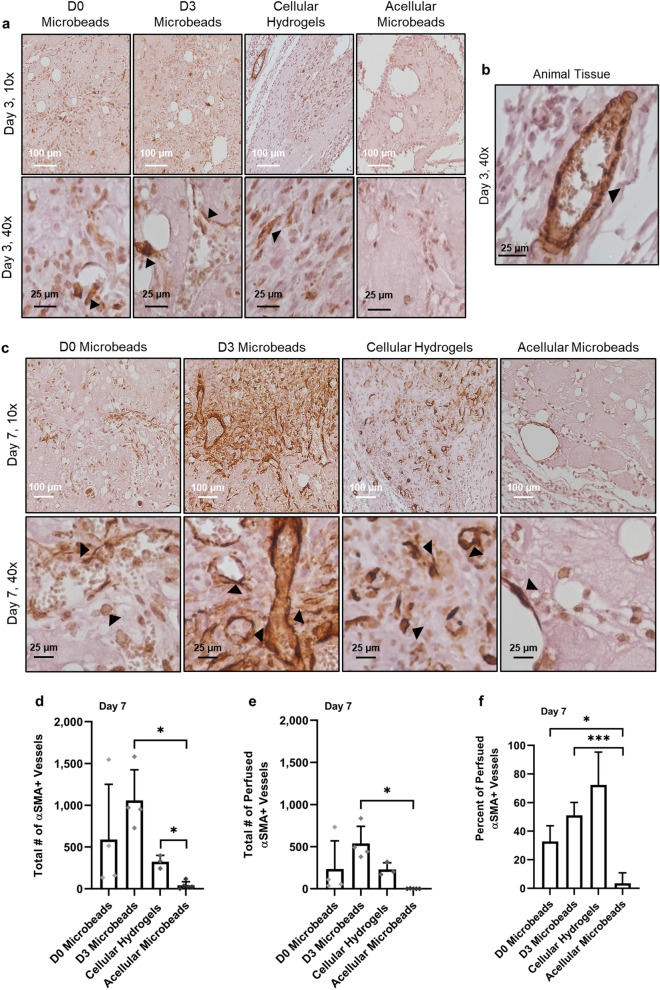
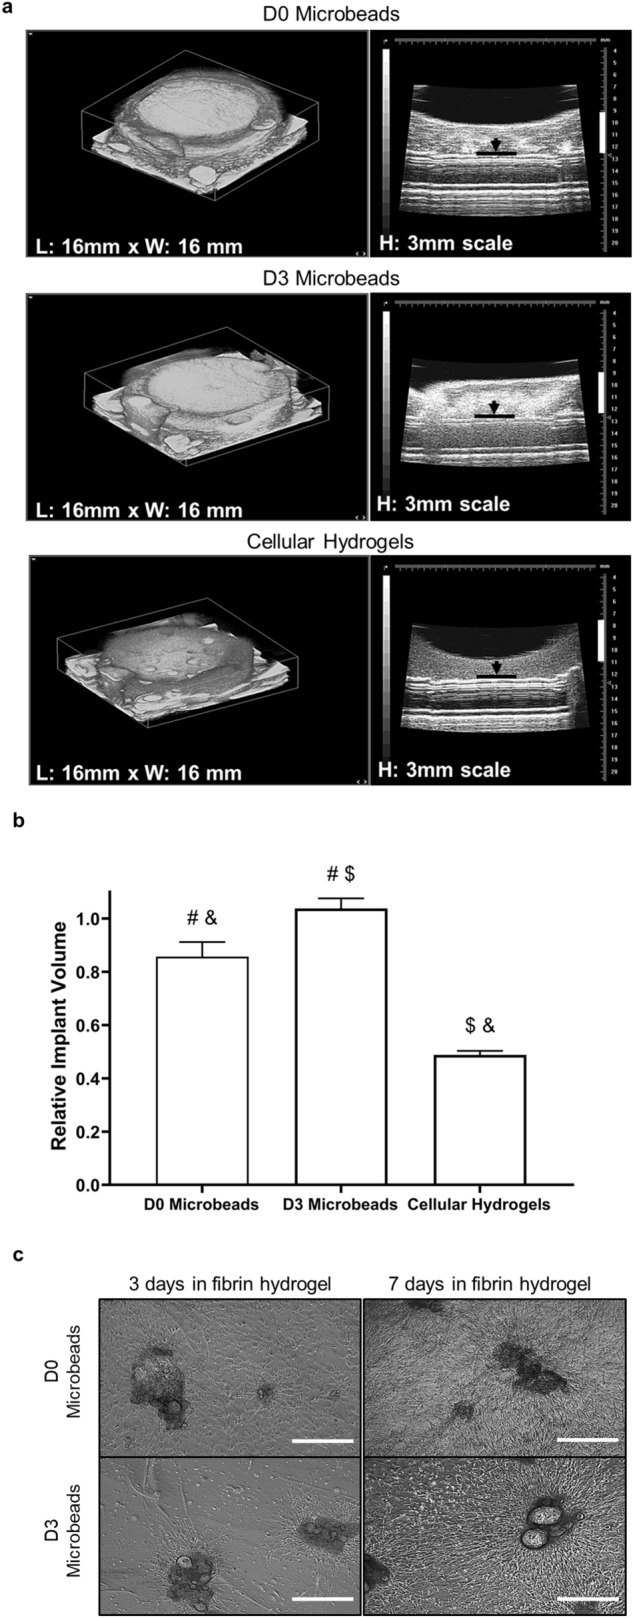
Revascularization of ischemic tissues is a major barrier to restoring tissue function in many pathologies. Delivery of pro-angiogenic factors has shown some benefit, but it is difficult to recapitulate the complex set of factors required to form stable vasculature. Cell-based therapies and pre-vascularized tissues have shown promise, but the former require time for vascular assembly in situ while the latter require invasive surgery to implant vascularized scaffolds. Here, we developed cell-laden fibrin microbeads that can be pre-cultured to form primitive vascular networks within the modular structures. These microbeads can be delivered in a minimally invasive manner and form functional microvasculature in vivo. Microbeads containing endothelial cells and stromal fibroblasts were pre-cultured for 3 days in vitro and then injected within a fibrin matrix into subcutaneous pockets on the dorsal flanks of SCID mice. Vessels deployed from these pre-cultured microbeads formed functional connections to host vasculature within 3 days and exhibited extensive, mature vessel coverage after 7 days in vivo. Cellular microbeads showed vascularization potential comparable to bulk cellular hydrogels in this pilot study. Furthermore, our findings highlight some potentially advantageous characteristics of pre-cultured microbeads, such as volume preservation and vascular network distribution, which may be beneficial for treating ischemic diseases.


Conflict of interest statement

The authors declare no competing interests.

Figures

Figure 1
Figure 1
Fibrin microbeads support vascular morphogenesis. (a) Fibrin microbeads containing human umbilical vein endothelial cells (HUVEC) and normal human lung fibroblasts (NHLF) were made via an emulsification process. (b) Cell-containing microbeads embedded in fibrin gels immediately after fabrication catalyzed morphogenesis from the beads into the surrounding microenvironment at day 7. (c) Those cultured in suspension for 7 days supported both inter-bead and intra-bead morphogenesis. (d) A higher magnification image of a cell-laden microbead pre-cultured for 7 days in suspension shows intra-bead vascular morphogenesis. (e) Subsequent embedding of these pre-cultured microbeads in fibrin gels for an additional 7 (top row) or 14 days (bottom row) led to the formation of extensive interconnected inter-bead vascular networks initiated from the pre-cultured microbeads. Endothelial sprouts (red) were stained with UEA-I, nuclei (blue) were stained with DAPI, and microbeads (green) were labeled with FITC-fibrinogen (scale bar = 500 µm in (b) and (c), and 100 µm in (d) and (e)). Portions of this figure were created using images modified from Servier Medical Art (Servier, https://smart.servier.com, licensed under a Creative Commons Attribution 3.0 Unported License).
Figure 2
Figure 2
Pre-culture time affects vascular distribution in vitro. Microbeads were pre-cultured in suspension for (a) 1 day, (b) 3 days, (c) 5 days, or (d) 7 days, and subsequently embedded in fibrin hydrogels for an additional 7 days. Endothelial sprouts (red) were stained with UEA-I. Images on the right for each pair show regions of the hydrogel that were magnified and adjusted with a Kirsch filter to facilitate edge detection and quantification. (e) Quantification of the fractional area of each fibrin construct occupied by tubular structures as a metric of distribution showed that 3 days of pre-culture time led to the most extensive vascular networks. The symbol (*) on the graph indicates values were statistically different (p ≤ 0.05). Error bars indicate ± SD.
Figure 3
Figure 3
Cell-laden fibrin microbeads catalyze the formation of functional microvasculature in vivo. (a) Implants were injected into the subcutaneous space on the dorsal surface of SCID mice. (b) Implants were retrieved, fixed, processed, embedded, and then stained with hematoxylin and eosin. Representative images of H&E-stained sections show vessel formation and cell infiltration in D0 microbeads (first column), D3 microbeads (second column), acellular microbeads (third column), and cellular hydrogels (fourth column) for 3 days (top row) and 7 days (bottom row). Dashed lines highlight the clusters of microbeads located within the implant. Arrows indicate representative vessels, black asterisks indicate representative regions where host erythrocytes are clearly present, and white asterisks indicate representative individual microbeads. (c) Implants were also IHC-stained for hCD31 (dark brown) to confirm the human origin of the neovessels. Implants containing D3 microbeads evaluated in vivo for 3 (left image) and 7 (middle and right image) days showed evidence of inosculation with host vessels. The white arrow in the day 7 micrograph (middle image) identifies a perfused mouse vessel (hCD31-), while white asterisks highlight hCD31+ vessels with red blood cells. The dashed black rectangle suggests a chimeric vessel formed by both mouse and human cells (right image). The magnified inset demonstrates the presence of host erythrocytes within the vessel. (d) Vessel structures containing human endothelial cells (hCD31+) were identified in all implants except for those containing acellular microbeads. Shown are representative 20× and 40× images of implants stained for hCD31 after 3 and 7 days in vivo. Quantification of both total and perfused human EC-derived vessel density for each condition after (e,f) 3 days and (g,h) 7 days was performed. No significant differences were observed in vessel and perfused vessel density between any of the experimental groups containing human endothelial cells after 3 or 7 days in vivo. Individual data points on graphs represent a single implant quantified per condition. Error bars indicate ± SD. Portions of this figure were created using images modified from Servier Medical Art (Servier, https://smart.servier.com, licensed under a Creative Commons Attribution 3.0 Unported License).
Figure 4
Figure 4
Cellular microbeads form extensive microvasculature in vivo. (a) Representative images of the cross-sectional areas of hCD31-stained tissues are shown for all 3 of the cell-containing experimental groups. D0 microbeads (left column), D3 microbeads (middle column), and cellular hydrogels (right column) were implanted for 3 (top row) and 7 days (bottom row) prior to their excision (black scale bar = 500 µm). Implant sizes were quantified by measuring the cross-sectional area of the implant region using H&E staining after (b) 3 and (c) 7 days in vivo. No significant differences in implant a rea were found between any of the experimental groups after 3 or 7 days. The total number of hCD31+ (d,g) vessels and (e,h) perfused vessel in the entire implant region was quantified after 3 and 7 days in vivo. No significant differences were observed between any of the cell-laden experimental groups after either time point. Percent of perfused hCD31+ vessels in the implant region after (f) 3 and (i) 7 days. After 3 days in vivo, D3 microbeads had a significantly greater percent of perfused vessel compared to D0 microbeads. After an additional 4 days in vivo, no significant differences were observed between any of the cellular conditions. Asterisks indicate statistically significant differences (p ≤ 0.05) between groups. Individual data points on graphs represent a single implant quantified per condition. Error bars indicate ± SD.
Figure 5
Figure 5
Implants containing cell-laden microbeads contained α-SMA supported vessels. (a) D0 microbeads (first column), D3 microbeads (second column), cellular hydrogels (third column), and acellular microbeads (fourth column) that were injected and kept in vivo for 3 days displayed minimal evidence of α-SMA+ staining. Images acquired via 10× (top row) and 40× (bottom row) objectives highlight α-SMA staining in brown (black arrows). (b) Vessels within the surrounding host tissue were positive for α-SMA as shown by 40× image from animal tissue near 3-day cellular hydrogel implant. (c) After 7 days, expression of α-SMA positive structures was higher in all conditions. White scale bar = 100 µm, and black scale bar = 25 µm. Quantification of total number of (d) α-SMA+ and (e) perfused α-SMA+ vessels in the implant region after 7 days in vivo. D3 microbeads had significantly higher α-SMA+ vessel and perfused vessel densities, and total number of perfused α-SMA+ vessels than acellular microbeads. D3 microbeads and cellular hydrogels both had a higher total number of α-SMA+ vessels than acellular microbeads. (f) Percent of perfused α-SMA+ vessels in the implant region after 7 days. Both D0 and D3 microbeads had a significantly greater percent of perfused vessel compared to acellular microbeads. Asterisks indicate statistically significant differences (p ≤ 0.05) between groups. Individual data points on graphs represent a single implant quantified per condition. Error bars indicate ± SD.
Figure 6
Figure 6
Constructs with D3 microbeads do not compact after 1 day of in vitro culture. (a) 3D ultrasound images of model fibrin implants containing D0 microbeads (top row), D3 microbeads (middle row), or uniformly suspended cells (cellular hydrogels, bottom row). Black lines and arrows in the images on the right-hand side show the bottom of the implant; white vertical lines are 3 mm scale bars. (b) Relative implant volumes were quantified and normalized to the model implants containing D3 microbeads, whose volumes were constant after 24 h of in vitro culture. Statistically significant differences (p ≤ 0.05) are indicated by matched symbols. Constructs containing D3 microbeads were of significantly larger volume than those containing D0 microbeads or the cellular hydrogels. (c) Cells deployed more slowly from D3 microbeads when embedded in fibrin hydrogels. Bright-field images of D0 (top row) and D3 (bottom row) microbeads embedded in fibrin hydrogels for 3 (left column) and 7 days (right column). Scale bar = 500 µm. Error bars indicate ± SD.

Similar articles

Cited by

References

    1. Falluji N, Mukherjee D. Critical and acute limb ischemia: an overview. Angiology. 2014;65:137–146. doi: 10.1177/0003319712470966. - DOI - PubMed
    1. Sanguily J, Martinsen B, Igyarto Z, Pham M. Reducing amputation rates in critical limb ischemia patients via a limb salvage program: a retrospective analysis. Vasc. Dis. Manag. 2016;13:E112–E119.
    1. Yost M. Critical Limb Ischemia Volume I: United States Epidemiology. San Francisco: The SAGE Group; 2010.
    1. Raval Z, Losordo DW. Cell therapy of peripheral arterial disease: From experimental findings to clinical trials. Circ. Res. 2013;112:1288–1302. doi: 10.1161/CIRCRESAHA.113.300565. - DOI - PMC - PubMed
    1. Ferrara N, Alitalo K. Clinical applications of angiogenic growth factors and their inhibitors. Nat. Med. 1999;5:1359–1364. doi: 10.1038/70928. - DOI - PubMed

Publication types