. 2020 Sep 23;10(1):15494.
doi: 10.1038/s41598-020-72543-0.

Boundary sequences flanking the mouse tyrosinase locus ensure faithful pattern of gene expression

Affiliations

Boundary sequences flanking the mouse tyrosinase locus ensure faithful pattern of gene expression

Davide Seruggia et al. Sci Rep. .

Abstract

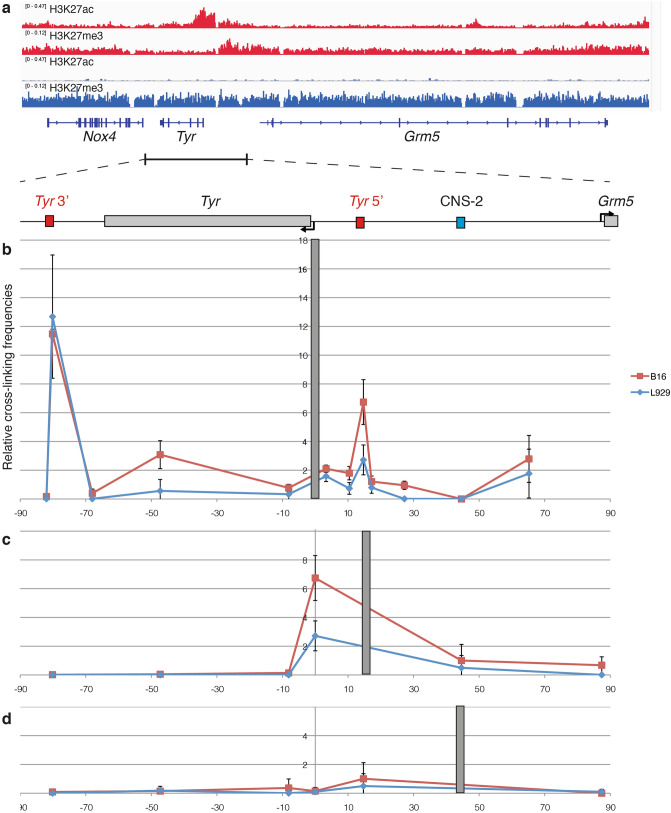
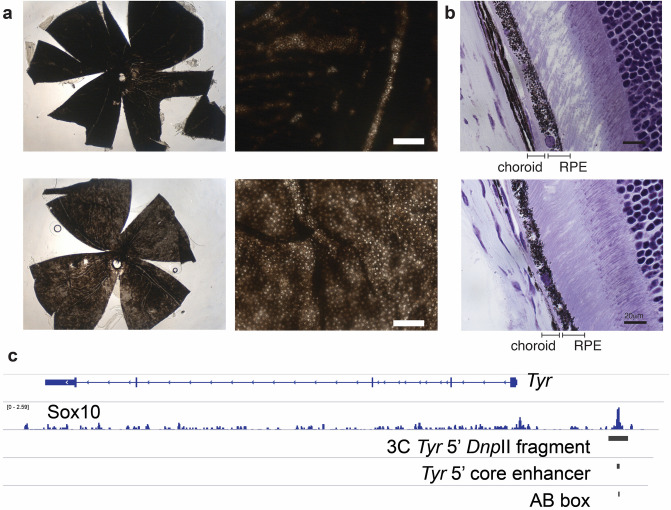
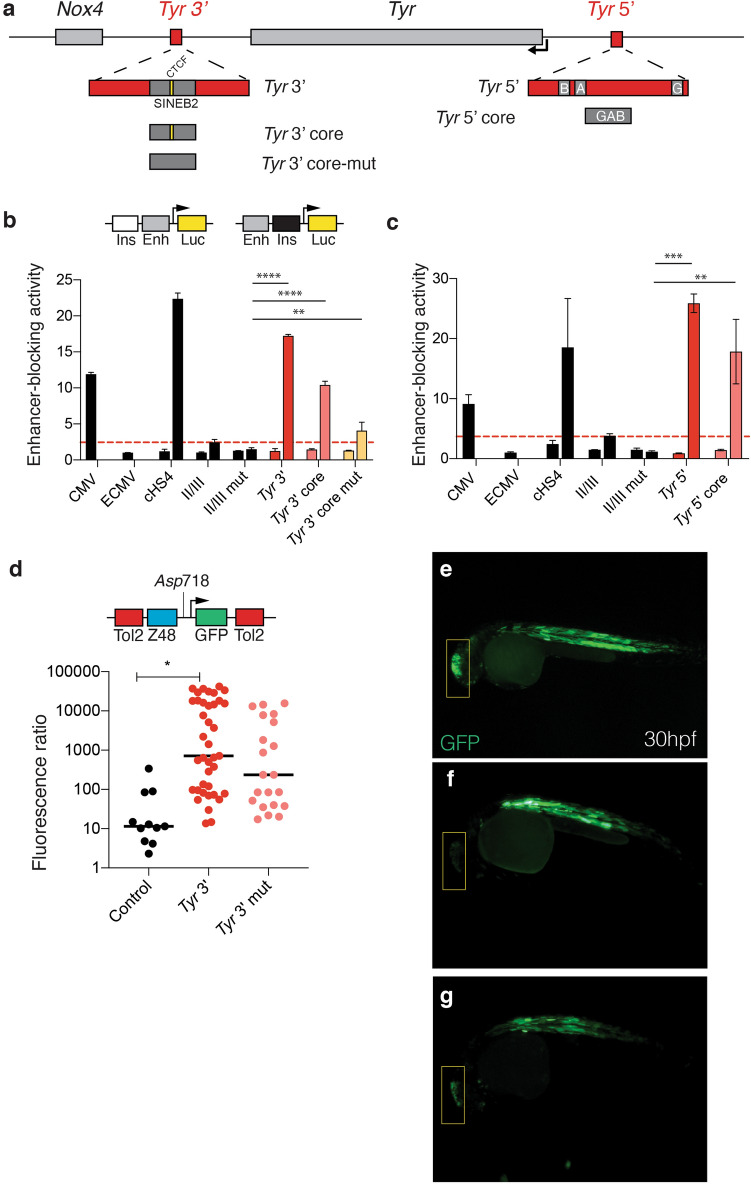
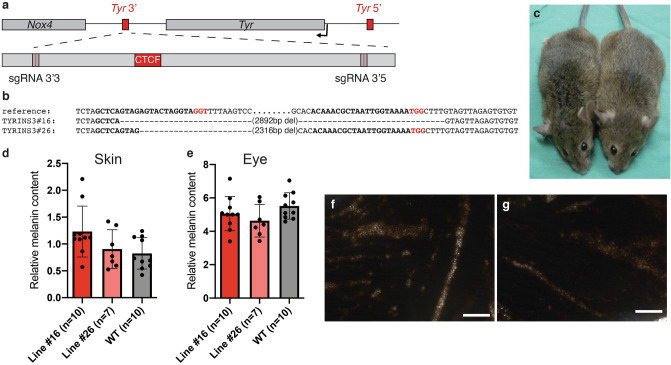
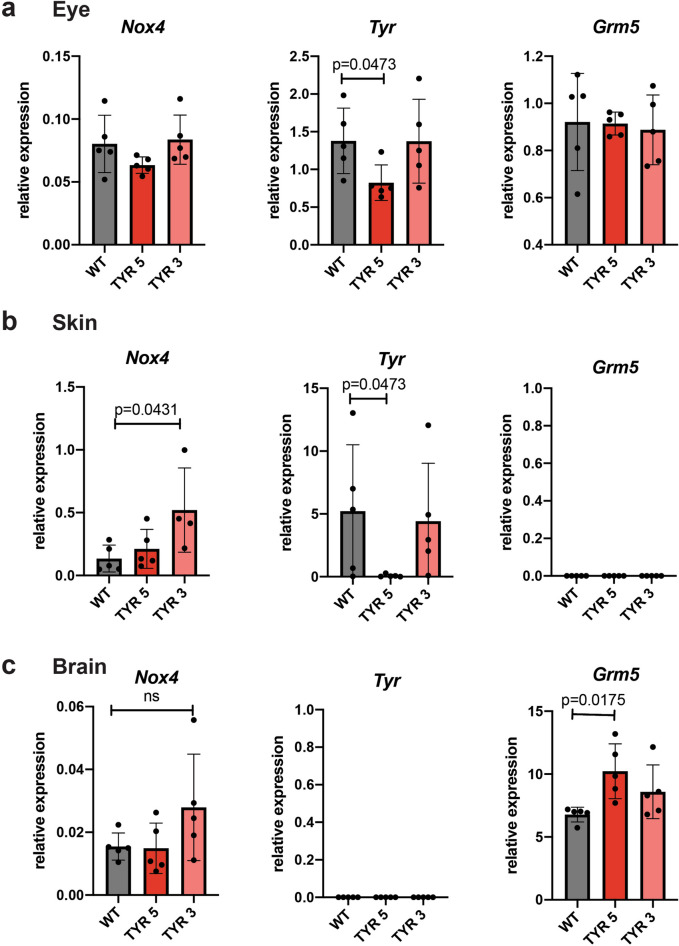
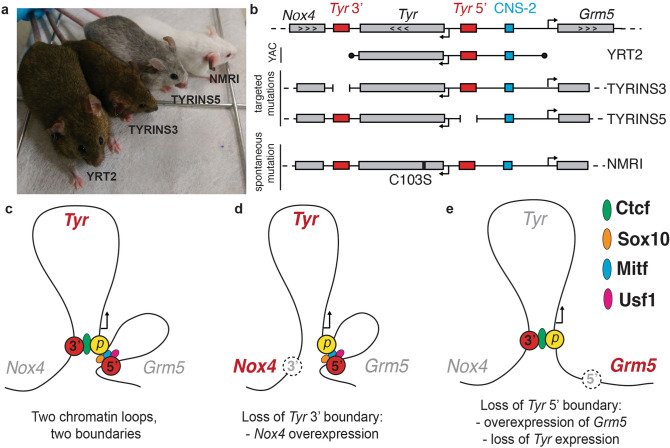
Control of gene expression is dictated by cell-type specific regulatory sequences that physically organize the structure of chromatin, including promoters, enhancers and insulators. While promoters and enhancers convey cell-type specific activating signals, insulators prevent the cross-talk of regulatory elements within adjacent loci and safeguard the specificity of action of promoters and enhancers towards their targets in a tissue specific manner. Using the mouse tyrosinase (Tyr) locus as an experimental model, a gene whose mutations are associated with albinism, we described the chromatin structure in cells at two distinct transcriptional states. Guided by chromatin structure, through the use of Chromosome Conformation Capture (3C), we identified sequences at the 5' and 3' boundaries of this mammalian gene that function as enhancers and insulators. By CRISPR/Cas9-mediated chromosomal deletion, we dissected the functions of these two regulatory elements in vivo in the mouse, at the endogenous chromosomal context, and proved their mechanistic role as genomic insulators, shielding the Tyr locus from the expression patterns of adjacent genes.


Conflict of interest statement

The authors declare no competing interests.

Figures

Figure 1
Figure 1
Chromosome conformation of the mouse Tyr locus. (a) Genomic view of the mouse Tyr locus with ChIP-sequencing data for H3K27ac and H3K27me3 profiles obtained from Melan-a (in red) and NIH-3T3 (in blue) cells. Data obtained from GSE69950, GSM1618720 and GSM2634342. (b) Chromosome Conformation Capture (3C) of mouse B16 melanoma cells (in red) and L292 fibroblasts (in blue). The grey bar indicates the anchor primer on Tyr promoter. (c) Chromatin loops detected when the anchor is located in correspondence of the Tyr 5′ element. (d) No interactions are detected when the CNS-2 is used as bait region. Figure prepared with Adobe Illustrator.
Figure 2
Figure 2
The Tyr 5′ element contains a melanocyte-specific Tyr enhancer. (a) Whole-mount retina from wild-type (top) or TYRINS5 homozygous animals (bottom). (b) Hematoxylin–Eosin (HE)-stained coronal sections of eye from adult wild-type (top) or TYRINS5 homozygous mice (bottom). (c) Genomic view of the Tyr upstream region. A region bound by Sox10 in melanocytes overlaps with the DpnII fragment interacting with the Tyr promoter, with the core Tyr 5′ enhancer and with its AB box. Figure prepared with Adobe Illustrator. The images included in this figure have been obtained by Davide Seruggia at the CNB-CSIC in Madrid under the supervision of Lluis Montoliu.
Figure 3
Figure 3
The Tyr locus is flanked by chromatin boundaries. (a) Schematics of the Tyr locus with cartoons illustrating the Tyr 3′ and Tyr 5′ boundaries. (b) Enhancer-blocking assay (EBA) of the Tyr 3′ element and its core sequence. Putative insulators are cloned upstream the CMV enhancers (control) or downstream the CMV enhancer (test). Enhancer-blocking activity is expressed as fold-repression values of normalized luciferase activity in test constructs compared to the CMV enhancer construct (ECMV). The full 1.2 kb sequence of the chicken 5′ HS4 insulator (cHS4) is used as positive control; a threshold line is indicated in red, corresponding to the enhancer-blocking activity of the cHS4 core sequence (II/III). As negative control a mutated version of II/III was used. Anova-Bonferroni multiple comparison test. Significant p < 0.05. (c) Enhancer-blocking assay (EBA) of the Tyr 5′ element and its core sequence. (d) Enhancer-blocking assay in zebrafish embryos. Putative insulators are inserted at the Asp718 site franking a hindbrain enhancer and a somite promoter driving GFP. Insertion of the Tyr 3′ core element increases the fluorescence ratio between somites and hindbrain. Mutation of the CTCF binding site decreases the fluorescence ratio. Median test; n = 11–39. Tyr 3′ versus control, p < 0.00726; Tyr 3′ mut versus control, p < 0.135; Tyr 3′ versus Tyr 3′ mut, p < 0.591. (e) Representative embryo injected with the empty pCAR48R vector. (f) Representative embryo injected with the Tyr 3′ core construct and (g) with the Tyr 3′ mutated core construct. The hindbrain location is indicated by a yellow box. Figure prepared with Adobe Illustrator.
Figure 4
Figure 4
Deleting the Tyr 3′ element in mice does not alter the pattern Tyr gene expression. (a) Diagram of the Tyr locus illustrating the position of the sgRNAs used for deletion of the Tyr 3′ boundary. (b) Alignment of the deletion alleles in two mouse lines. Line TYRINS3#16 carries a 2892 bp deletion; line TYRINS3#26 carries a smaller deletion (2316 bp) that spares the sequence targeted by sgRNA 3′5. (c) The coat color of wild-type (left) and TYRINS3 homozygous (right) animals is indistinguishable. (d) Skin and (e) eye relative melanin content of TYRINS3#16, TYRINS3#26 homozygous and wild-type mice. Whole mounts of retinae from wild-type (f) and TYRINS3 homozygous (g) animals. Figure prepared with Adobe Illustrator. The images included in this figure have been obtained by Davide Seruggia at the CNB-CSIC in Madrid under the supervision of Lluis Montoliu.
Figure 5
Figure 5
Inactivation of the Tyr boundaries perturbs the transcription of flanking genes in vivo. (a) Relative mRNA expression of Tyr, Nox4 and Grm5 in the eye of wild-type and homozygous TYRINS5 and TYRINS3 mice. (b) Relative mRNA expression in the skin and (c) brain of wild-type and homozygous TYRINS5 and TYRINS3 mice. N = 5 mice per group; Kruskal–Wallis test. Figure prepared with Adobe Illustrator.
Figure 6
Figure 6
Model of the Tyr locus. (a) Representative individuals of mouse models for the Tyr locus: YRT2, TYRINS3, TYRINS5 and albino NMRI, along with (b) schematics of their genomic modifications. (c) When transcriptionally active, the Tyr locus is organized in two loops, mediated by CTCF at the 3′ boundary and likely by Sox10, Mitf and Usf1 binding at the 5′ boundary. (d) Inactivation of the Tyr 3′ boundary results in ectopic expression of Nox4, the gene located beyond the boundary. (e) Inactivation of the Tyr 5′ boundary causes loss of Tyr expression and overexpression of Grm5, past the boundary. Figure prepared with Adobe Illustrator. The image included in this figure has been obtained by Davide Seruggia at the CNB-CSIC in Madrid under the supervision of Lluis Montoliu.

Similar articles

Cited by

References

    1. Bonev B, Cavalli G. Organization and function of the 3D genome. Nat. Rev. Genet. 2016;17:661–678. doi: 10.1038/nrg.2016.112. - DOI - PubMed
    1. Rao SSP, et al. A 3D map of the human genome at kilobase resolution reveals principles of chromatin looping. Cell. 2014;159:1665–1680. doi: 10.1016/j.cell.2014.11.021. - DOI - PMC - PubMed
    1. Fraser J, et al. Hierarchical folding and reorganization of chromosomes are linked to transcriptional changes in cellular differentiation. Mol. Syst. Biol. 2015;11:852. doi: 10.15252/msb.20156492. - DOI - PMC - PubMed
    1. Bonev B, et al. Multiscale 3D genome rewiring during mouse neural development. Cell. 2017;171:557–572.e24. doi: 10.1016/j.cell.2017.09.043. - DOI - PMC - PubMed
    1. Stadhouders R, Filion GJ, Graf T. Transcription factors and 3D genome conformation in cell-fate decisions. Nature. 2019;569:345–354. doi: 10.1038/s41586-019-1182-7. - DOI - PubMed

Publication types