. 2020 Sep 23;10(1):15514.
doi: 10.1038/s41598-020-72611-5.

Second wave COVID-19 pandemics in Europe: a temporal playbook

Affiliations

Second wave COVID-19 pandemics in Europe: a temporal playbook

Giacomo Cacciapaglia et al. Sci Rep. .

Abstract

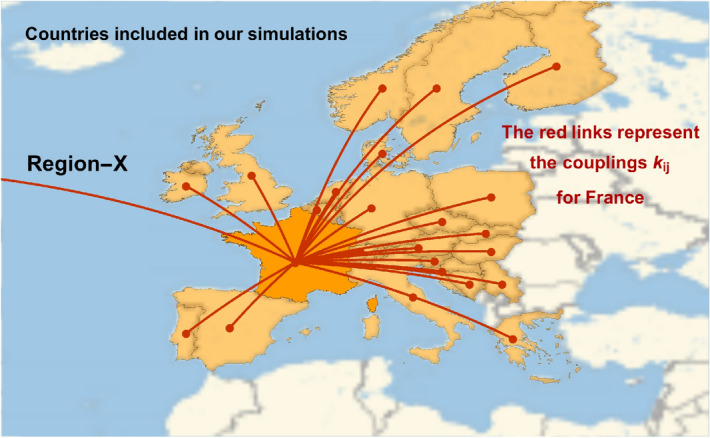
A second wave pandemic constitutes an imminent threat to society, with a potentially immense toll in terms of human lives and a devastating economic impact. We employ the epidemic Renormalisation Group (eRG) approach to pandemics, together with the first wave data for COVID-19, to efficiently simulate the dynamics of disease transmission and spreading across different European countries. The framework allows us to model, not only inter and extra European border control effects, but also the impact of social distancing for each country. We perform statistical analyses averaging on different level of human interaction across Europe and with the rest of the World. Our results are neatly summarised as an animation reporting the time evolution of the first and second waves of the European COVID-19 pandemic. Our temporal playbook of the second wave pandemic can be used by governments, financial markets, the industries and individual citizens, to efficiently time, prepare and implement local and global measures.


Conflict of interest statement

The authors declare no competing interests.

Figures

Figure 1
Figure 1
Illustration of the connections kij between, i.e., France and the other countries considered in this study. Each line represents the exchange of infected cases. The line pointing outside the map represents the connection with Region-X, representing an inflow from a source outside the pool of countries in the simulation and/or the presence of hotspots in the concerned country. Figure created with Wolfram Mathematica.
Figure 2
Figure 2
Croatian number of total infected cases (updated to the 5th of August) with respect to the theoretical curve (orange line) used to calibrate the case (e) simulation. The number of cases refer to the total population of Croatia. The vertical line shows where the second wave simulation begins.
Figure 3
Figure 3
Result of case (e) for France, Italy and the UK. We show the time evolution of the total number of infected cases in the top panel, the new infected in the central panel and the derived effective reproduction rate R in the bottom panel. The number of cases refer to the total population of the countries. The bands are generated by varying the infection rates γi within 10%.
Figure 4
Figure 4
Peak time, in calendar weeks, versus the infection rate γ for cases (a–c). These results are obtained by averaging the outcome of the 100 simulation, while the error bars indicate one standard deviation.
Figure 5
Figure 5
Time evolution for the total number of infected and new cases (not normalised per million) for the nordic European countries, from the simulation case (e), which starts at week 25. The bands are generated by varying the infection rates γi within 10%.
Figure 6
Figure 6
Epidemiological data (red), adjourned to the 30th of August, for six sample countries compared to an updated simulation. For all countries, except Croatia, the second wave from case (e) simulation is anticipated by 4 weeks, thus in agreement with the results of case (a). To match the slow growing phase in between the two waves, we added a linearly growing term, in line to what we did for the calibration of the case (e) simulations. The bands are generated by varying the infection rates γi within 10%.

Similar articles

Cited by

References

    1. Kermack WO, McKendrick A, Walker GT. A contribution to the mathematical theory of epidemics. Proc. R. Soc. A. 1927;115:700–721. doi: 10.1098/rspa.1927.0118. - DOI
    1. Perc M, et al. Statistical physics of human cooperation. Phys. Rep. 2017;687:1–51. doi: 10.1016/j.physrep.2017.05.004. - DOI
    1. Wang Z, Andrews MA, Wu Z-X, Wang L, Bauch CT. Coupled disease-behavior dynamics on complex networks: A review. Phys. Life Rev. 2015;15:1–29. doi: 10.1016/j.plrev.2015.07.006. - DOI - PMC - PubMed
    1. Wang Z, et al. Statistical physics of vaccination. Phys. Rep. 2016;664:1–113. doi: 10.1016/j.physrep.2016.10.006. - DOI
    1. Faranda, D. & Alberti, T. Modelling the second wave of COVID-19 infections in france and italy via a stochastic seir model (2020). arXiv:2006.05081. - PubMed

Publication types