. 2021 Mar;14(2):431-442.
doi: 10.1038/s41385-020-00344-9. Epub 2020 Sep 23.

Monocyte-derived dendritic cells link localized secretory IgA deficiency to adaptive immune activation in COPD

Affiliations

Monocyte-derived dendritic cells link localized secretory IgA deficiency to adaptive immune activation in COPD

Bradley W Richmond et al. Mucosal Immunol. 2021 Mar.

Abstract

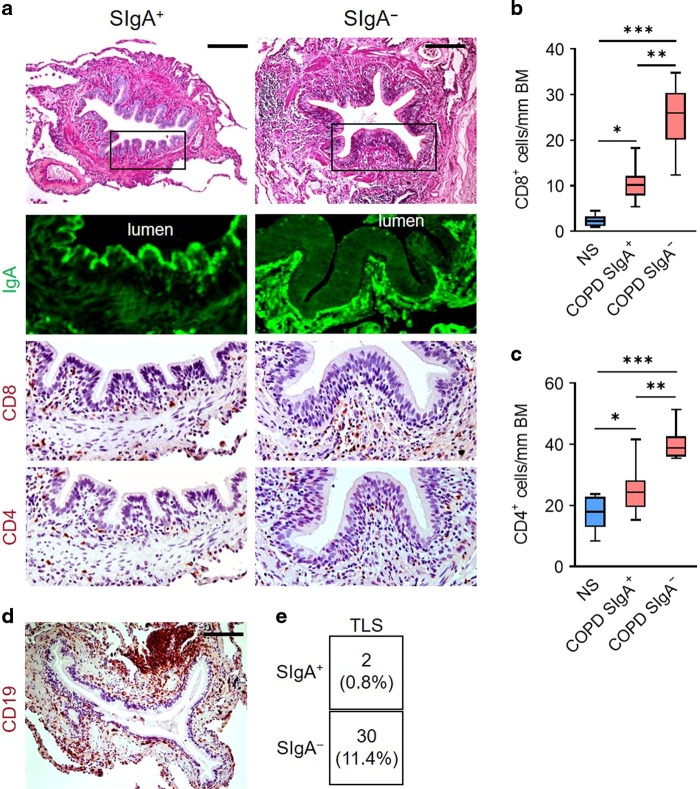
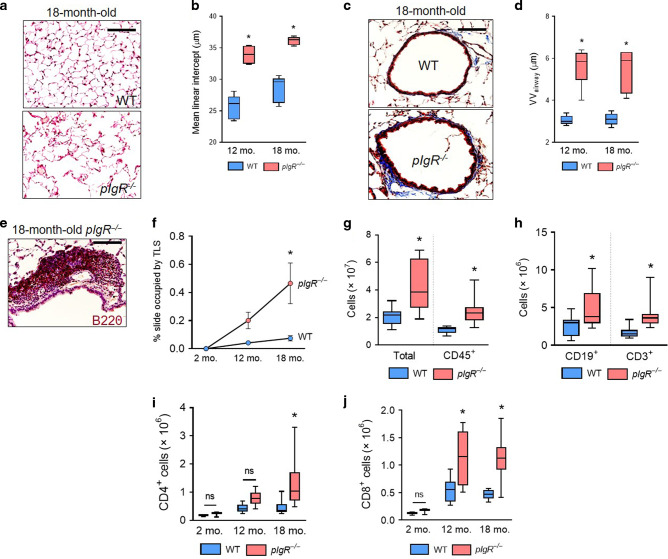
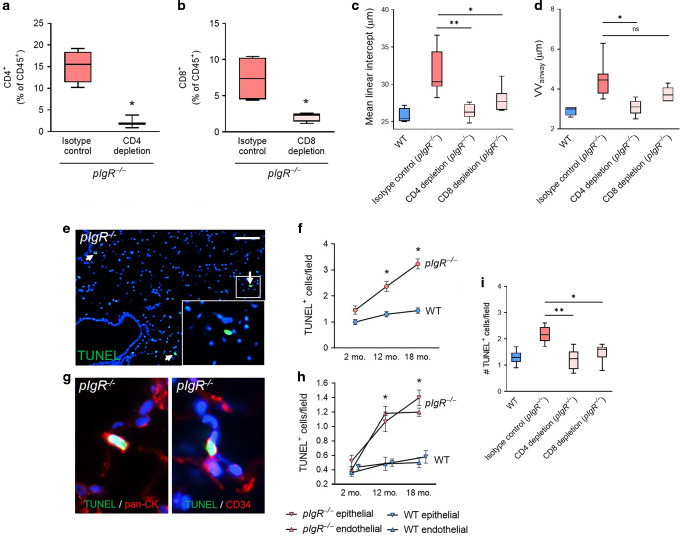
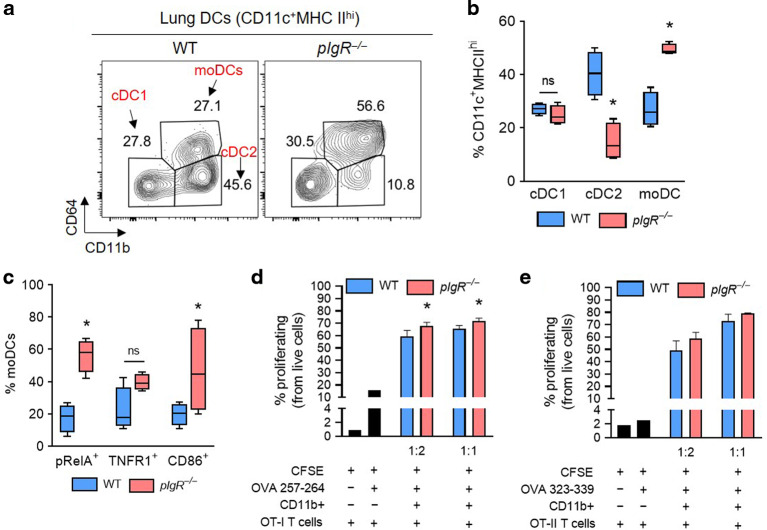
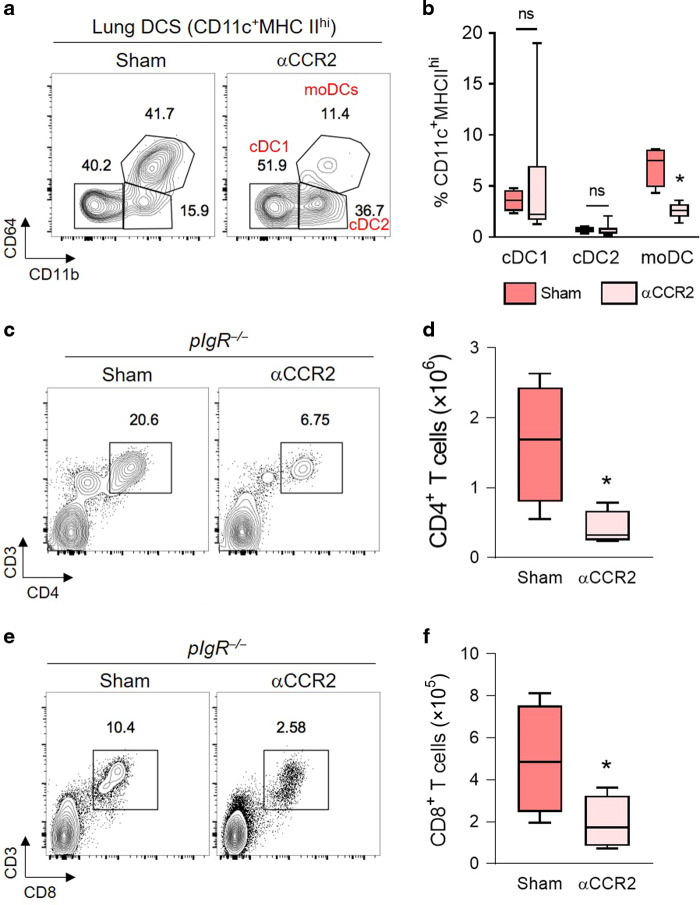
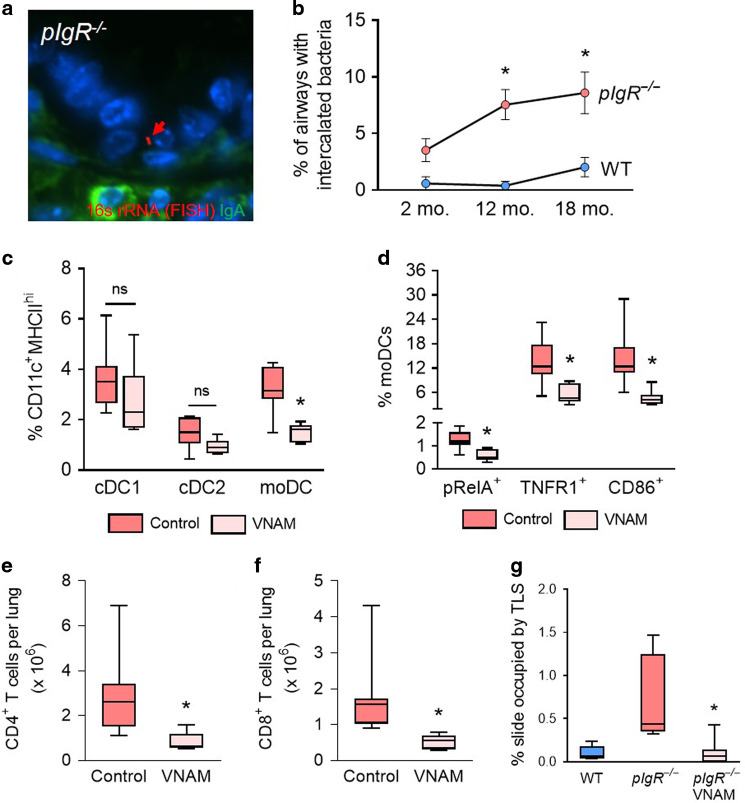
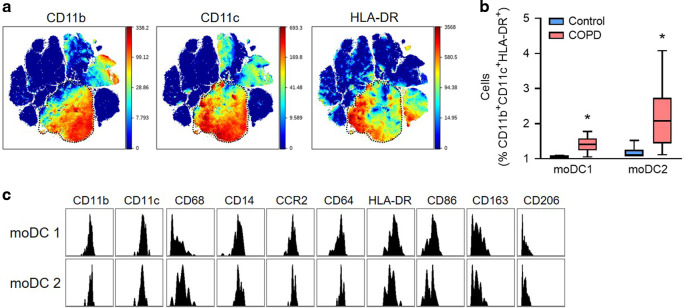
Although activation of adaptive immunity is a common pathological feature of chronic obstructive pulmonary disease (COPD), particularly during later stages of the disease, the underlying mechanisms are poorly understood. In small airways of COPD patients, we found that localized disruption of the secretory immunoglobulin A (SIgA)-containing mucosal immunobarrier correlated with lymphocyte accumulation in airway walls and development of tertiary lymphoid structures (TLS) around small airways. In SIgA-deficient mice, we observed bacterial invasion into the airway epithelial barrier with lymphocytic infiltration and TLS formation, which correlated with the progression of COPD-like pathology with advanced age. Depletion of either CD4+ or CD8+ T lymphocytes reduced the severity of emphysema in SIgA-deficient mice, indicating that adaptive immune activation contributes to progressive lung destruction. Further studies revealed that lymphocyte infiltration into the lungs of SIgA-deficient mice was dependent on monocyte-derived dendritic cells (moDCs), which were recruited through a CCR2-dependent mechanism in response to airway bacteria. Consistent with these results, we found that moDCs were increased in lungs of COPD patients, along with CD4+ and CD8+ effector memory T cells. Together, these data indicate that endogenous bacteria in SIgA-deficient airways orchestrate a persistent and pathologic T lymphocyte response through monocyte recruitment and moDC differentiation.


Conflict of interest statement

The authors declare no competing interests.

Figures

Fig. 1
Fig. 1. T and B lymphocytes preferentially accumulate around SIgA-deficient airways in patients with COPD.
a Immunostaining for SIgA (green) and CD4 or CD8 (brown) in 5 μm lung sections from a COPD patient. Scale bar = 100 μm. b, c Quantification of CD8+ (b) or CD4+ (c) T lymphocytes/mm basement membrane in 5 μm lung sections from COPD patients according to airway SIgA status and lifelong non-smokers (NS). Small airways from COPD patients were classified as SIgA+ or SIgA- based on the quantification of SIgA immunofluorescence. d Example of a tertiary lymphoid structure in a COPD patient as determined by immunostaining for CD19. Scale bar = 100 μm. e Table illustrating the number and percentage of TLS according to airway SIgA status. b *p < 0.01 compared to NS, **p < 0.0001 compared to COPD SIgA+, ***p < 0.0001 compared to NS, (ANOVA). c *p < 0.05 compared to NS, **p < 0.001 compared to COPD SIgA+ airways, ***p < 0.0001 compared to NS (ANOVA). Box-and-whisker plots represent median, interquartile range, and range.
Fig. 2
Fig. 2. pIgR−/− mice spontaneously develop COPD-like lung pathology and adaptive immune activation.
a Representative image of emphysema in an 18-month-old pIgR−/− and age-matched WT mouse (hematoxylin and eosin, scale bar = 50 μm). b Measurement of mean linear intercept (MLI), a morphometric measurement of emphysema, in WT and pIgR/− mice at the indicated ages. c Representative image of small airway wall thickening in an 18-month-old pIgR−/− and age-matched WT mouse (Masson’s trichrome, scale bar = 50 μm). d Measurement of VVairway, a morphometric measurement of small airway wall thickness, in WT and pIgR/ mice at the indicated ages. e Example of a tertiary lymphoid structure (TLS) in an 18-month-old pIgR/− mouse as indicated by immunostaining for B220. Scale bar = 50 μm. f Morphometric analysis of TLS area in lungs of WT or pIgR/− mice at the indicated ages. gj Quantification of total, CD45+, CD19+, CD3+, CD4+, and CD8+ cells in the lungs of 18-month-old WT and pIgR/− mice by flow cytometry. b, d *p < 0.0001 compared to age-matched WT mice (2-way ANOVA with Bonferroni post hoc test); n = 5–6 mice group. f *p < 0.001 compared to 18-month-old WT mice (2-way ANOVA with Bonferroni post hoc test); n = 3 mice/group. g *p < 0.05 compared to 18-month-old WT mice (t-test); n = 9–12 mice/group. h *p < 0.05 compared to 18-month-old WT mice (Mann–Whitney test); n = 9–12 mice/group. i, j *p < 0.01 compared to age-matched WT mice (2-way ANOVA with Bonferroni post hoc test); n = 3–12 mice/group. Box-and-whisker plots represent median, interquartile range, and range.
Fig. 3
Fig. 3. CD4+ and CD8+ T lymphocyte depletion blocks COPD-like pathology in pIgR−/− mice and is associated with reduced apoptosis of lung epithelial and endothelial cells.
a, b Percentage of CD4+ or CD8+ lymphocytes among CD45+ cells in spleens of mice treated with weekly intraperitoneal injection of anti-CD4 or anti-CD8 antibodies from 4 to 8 months of age. c Measurement of mean linear intercept (MLI), a morphometric measurement of emphysema, or d measurement of VVairway, a morphometric measurement of small airway wall thickness, in pIgR−/− mice treated with anti-CD4 or anti-CD8 antibodies or rat IgG2b isotype control antibodies from 4 to 8 months of age. e TUNEL+ cells in the lung parenchyma of a pIgR−/− mouse (white arrows denote TUNEL+ cells). Scale bar = 100 μm. f Quantification of TUNEL+ cells in pIgR−/− and WT mice at the indicated ages. g Representative image of colocalization between TUNEL+ cells and pan-cytokeratin (marking epithelial cells) or CD34 (marking endothelial cells) in an 18-month-old pIgR−/− mouse. h Quantification of TUNEL/pan-cytokeratin and TUNEL/CD34 dual-expressing cells in pIgR−/− and WT mice at the indicated ages. i Quantification of TUNEL+ cells/field in 8-month-old pIgR−/− mice treated with anti-CD8 or anti-CD4 antibodies or isotype control antibodies between 4 and 8 months of age. a, b *p < 0.05 compared to untreated mice (t-test); n = 3–4 mice/group. c, d *p < 0.05 compared to isotype-control treated mice, **p < 0.05 compared to isotype-control treated mice (1-way ANOVA with Bonferroni post hoc test); n = 4–8 mice/group. fh *p < 0.001 compared to age-matched WT mice (2-way ANOVA with Bonferroni post hoc test); n = 5–6 mice/group. i *p < 0.01 compared to isotype control, *p < 0.0001 compared to isotype control; (1-way ANOVA with Bonferroni post hoc test); n = 7–8 mice/group. Box-and-whisker plots represent median, interquartile range, and range.
Fig. 4
Fig. 4. Activated moDCs accumulate in the lungs of pIgR−/− mice.
a Representative flow cytometry plot showing the distribution of cDC1, cDC2, and moDCs in the lungs of an 18-month-old WT and pIgR−/− mouse (from CD11c+MHC IIhi cells). b Percentage of cDC1, cDC2, and moDCs among CD11c+MHCIIhi cells in 18-month-old WT and pIgR−/− mice shown in (a). c Percentage of moDCs expressing the activation markers pRelA, TNFR1, and CD86 in 18-month-old WT and pIgR−/− mice. d, e Percentage proliferating OT-I (d) or OT-II (e) splenic T lymphocytes co-cultured with lung CD11b+ cells from 18-month-old WT or pIgR−/− mice at the ratios indicted (CD11b+ cells to T cells) in the presence of OVA peptide. b, c *p < 0.01 compared to 18-month-old WT mice (t-test); n = 4 mice/group. d *p < 0.05 for trend (1-way ANOVA); n = 3 biological replicates (CD11b+ cell donors)/group and 3 technical replicates per biological replicate. OT-I or OT-II cells came from spleens of a single donor for each experiment. Box-and-whisker plots represent median, interquartile range, and range.
Fig. 5
Fig. 5. CCR2 blockade reduces moDC and T cell recruitment to the lungs of pIgR−/− mice.
a Flow cytometry plots demonstrating the effectiveness of the CCR2 antagonist RS-504393 in reducing lung moDCs in aged (20–22 months) pIgR−/− mice. b Quantification of DC subsets (as % of CD11c+MHCIIhi cells) in the lungs of aged pIgR−/− mice with and without CCR2 antagonist. c, e Representative flow cytometry plots showing CD4+ and CD8+ T lymphocytes in aged (20–22 months) pIgR−/− mice with and without CCR2 antagonist treatment. d, f Quantification of CD4+ and CD8+ T lymphocytes shown in (c, e). b, d *p < 0.01 compared to sham-treated pIgR−/− mice (t-test); n = 4–6 mice/group. f *p < 0.05 compared to sham-treated pIgR−/− mice (t-test); n = 4–6 mice/group. Box-and-whisker plots represent median, interquartile range, and range.
Fig. 6
Fig. 6. Antimicrobial therapy reduces activated moDC and T lymphocyte numbers in pIgR−/− mice.
a Representative in situ hybridization (FISH) of bacterium invading the epithelial barrier in a small airway from an 8-month-old pIgR−/− mouse. The bacterium (red arrow) is labeled by a FISH probe targeting prokaryotic 16s rRNA. IgA staining (green) shows absence of SIgA on the airway surface. b Percentage of airways with bacteria intercalated into the mucosa in WT and pIgR−/− mice at indicated ages. c Quantification of moDCs, cDC1, and cDC2 cells (as % CD11c+MHCIIhi cells) in aged pIgR−/− mice with and without antibiotics (vancomycin, neomycin, ampicillin, metronidazole, VNAM) treatment. d Percentage of moDCs (CD11c+MHCIIhiCD11b+CD64+) expressing the activation markers pRelA, TNFR1, and CD86 in the lungs of aged pIgR−/− mice with and without antibiotic treatment. e, f Quantification of CD4+ and CD8+ T lymphocytes in the lungs of aged pIgR−/− mice with and without antibiotic treatment. g Percentage of slide occupied by TLS in 18-month-old untreated WT and pIgR−/− mice and 18-month-old pIgR−/− mice treated with antibiotics. b *p < 0.01 compared to age-matched WT mice (2-way ANOVA with Bonferroni post hoc test); n = 5–11 mice/group. c *p < 0.01 compared to untreated pIgR−/− mice (2-way ANOVA with Bonferroni post hoc test); n = 6–8 mice/group. de *p < 0.05 compared to untreated pIgR−/− mice (t-test); n = 6–8 mice/group. Box-and-whisker plots represent median, interquartile range, and range. f *p < 0.001 compared to untreated pIgR−/− mice (Mann–Whitney test); n = 6–8 mice/group. g *p < 0.01 compared to untreated pIgR−/− mice (Mann–Whitney test); n = 6–8 mice/group.
Fig. 7
Fig. 7. Increased moDCs in the lungs of COPD patients.
Single-cell suspensions were prepared from the lungs of 12 COPD patients and 6 controls without chronic respiratory disease and analyzed by mass cytometry. a Expression of CD11b, CD11c, and HLA-DR in viSNE clusters generated from live, single, CD45+ cells from all patients (total of 400,000 cells). b Abundance (percentage among CD11b+CD11c+HLA-DR+ cells) of the 2 myeloid cell clusters enriched in COPD lungs relative to controls. c Histograms of myeloid cell markers in the 2 cell clusters (identified as moDCs) enriched in COPD lungs. *p < 0.01 compared to control lungs (Mann–Whitney test). Box-and-whisker plots represent median, interquartile range, and range.

References

    1. Diamond G, Legarda D, Ryan LK. The innate immune response of the respiratory epithelium. Immunol. Rev. 2000;173:27–38. - PubMed
    1. Ganesan S, Comstock AT, Sajjan US. Barrier function of airway tract epithelium. Tissue Barriers. 2013;1:e24997. - PMC - PubMed
    1. Corthesy B. Role of secretory IgA in infection and maintenance of homeostasis. Autoimmun. Rev. 2013;12:661–665. - PubMed
    1. Corthesy B. Multi-faceted functions of secretory IgA at mucosal surfaces. Front Immunol. 2013;4:185. - PMC - PubMed
    1. Brandtzaeg P. Secretory IgA: Designed for Anti-Microbial Defense. Front Immunol. 2013;4:222. - PMC - PubMed

Publication types

MeSH terms