. 2020 Oct;586(7828):281-286.
doi: 10.1038/s41586-020-2745-3. Epub 2020 Sep 23.

The maternal microbiome modulates fetal neurodevelopment in mice

Affiliations

The maternal microbiome modulates fetal neurodevelopment in mice

Helen E Vuong et al. Nature. 2020 Oct.

Abstract

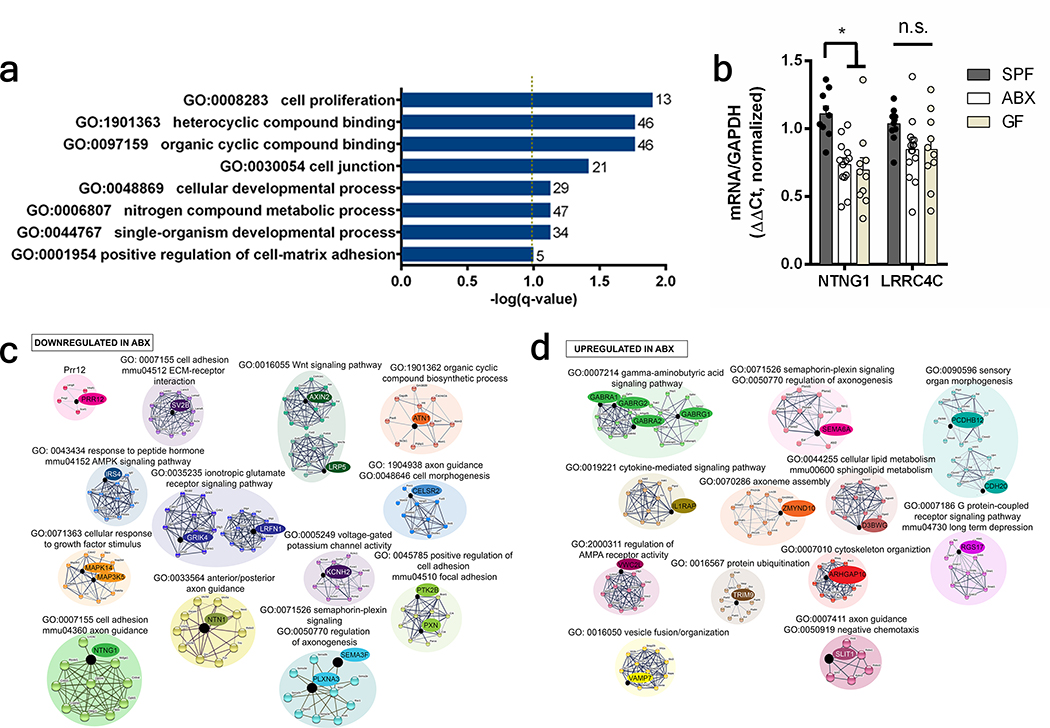
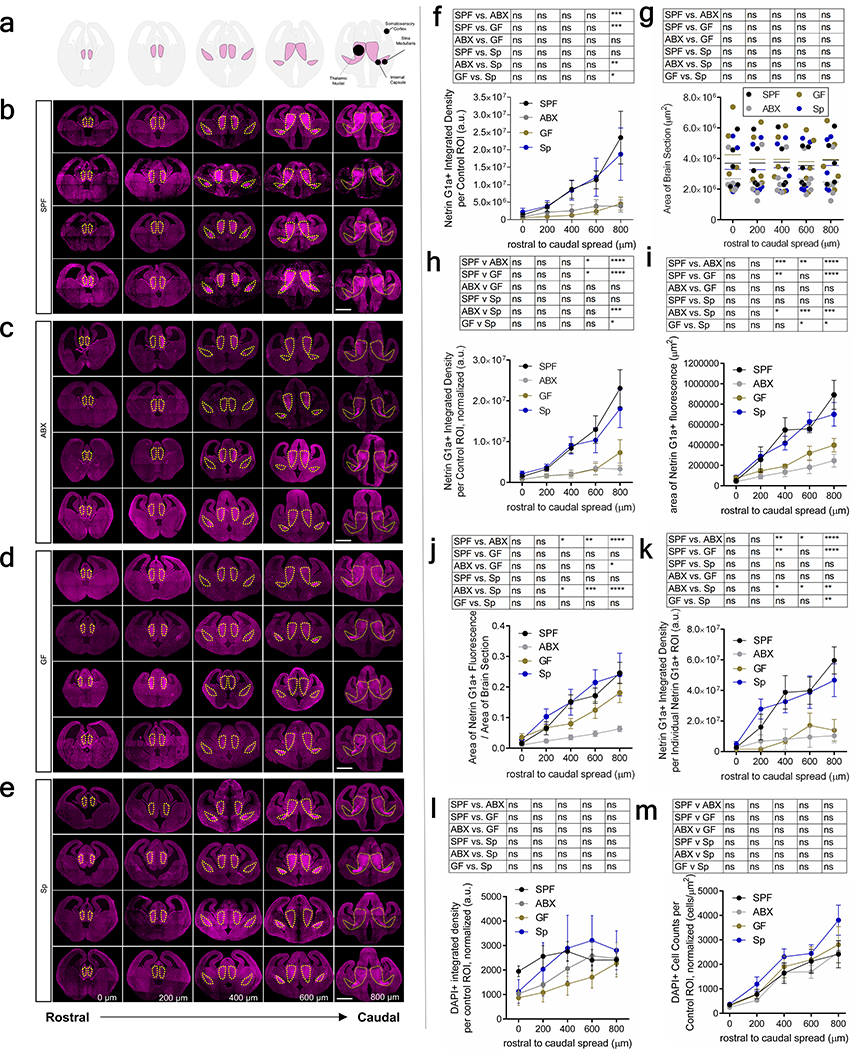
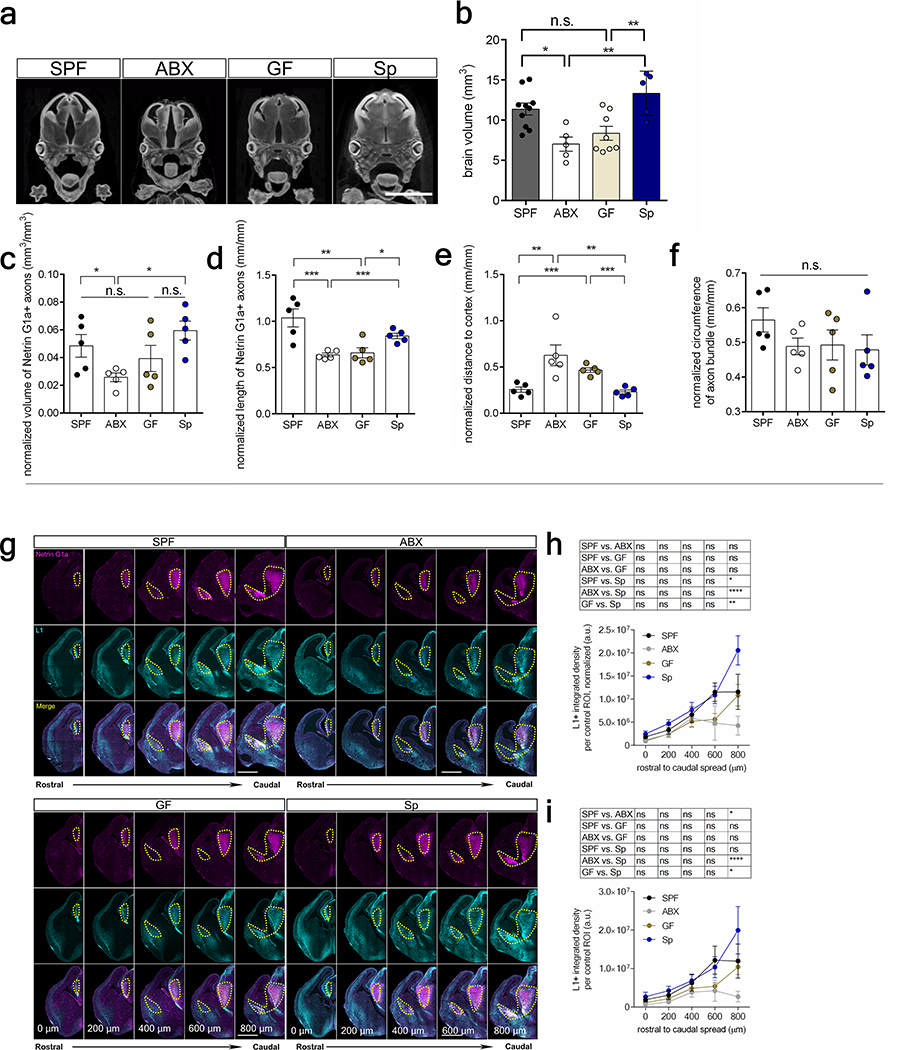
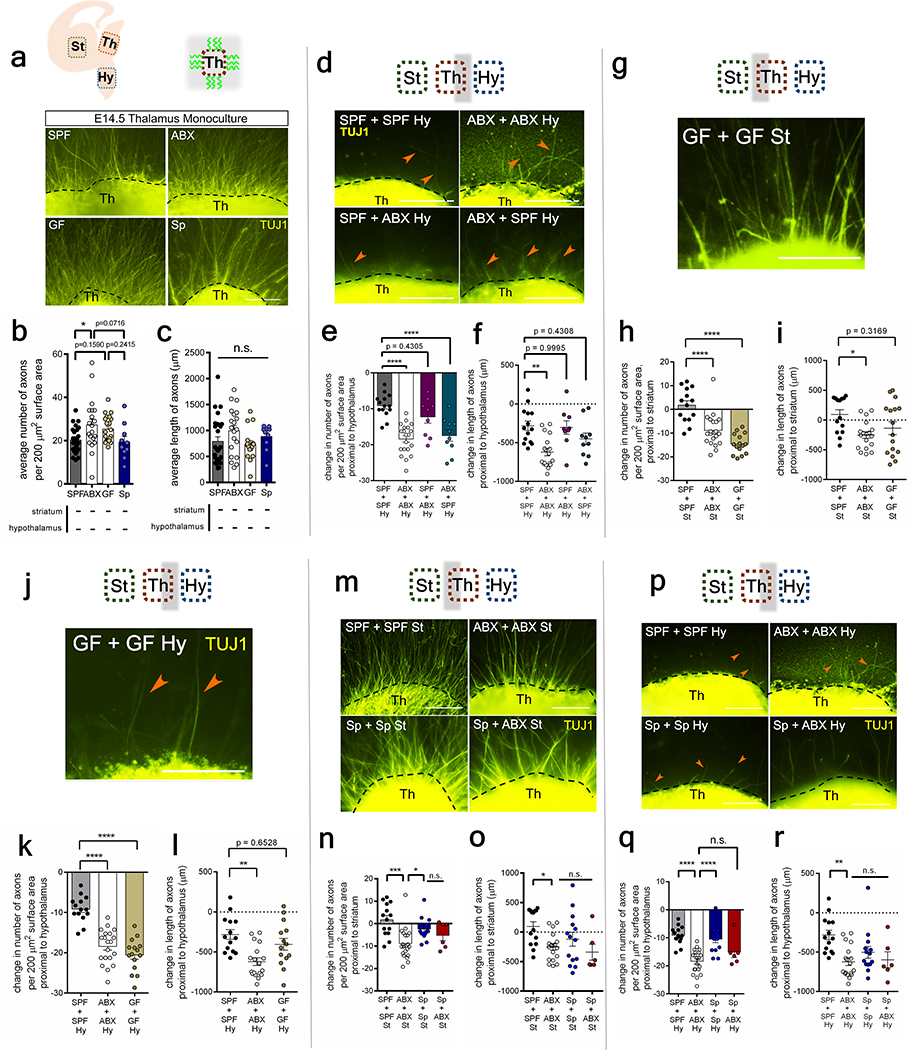
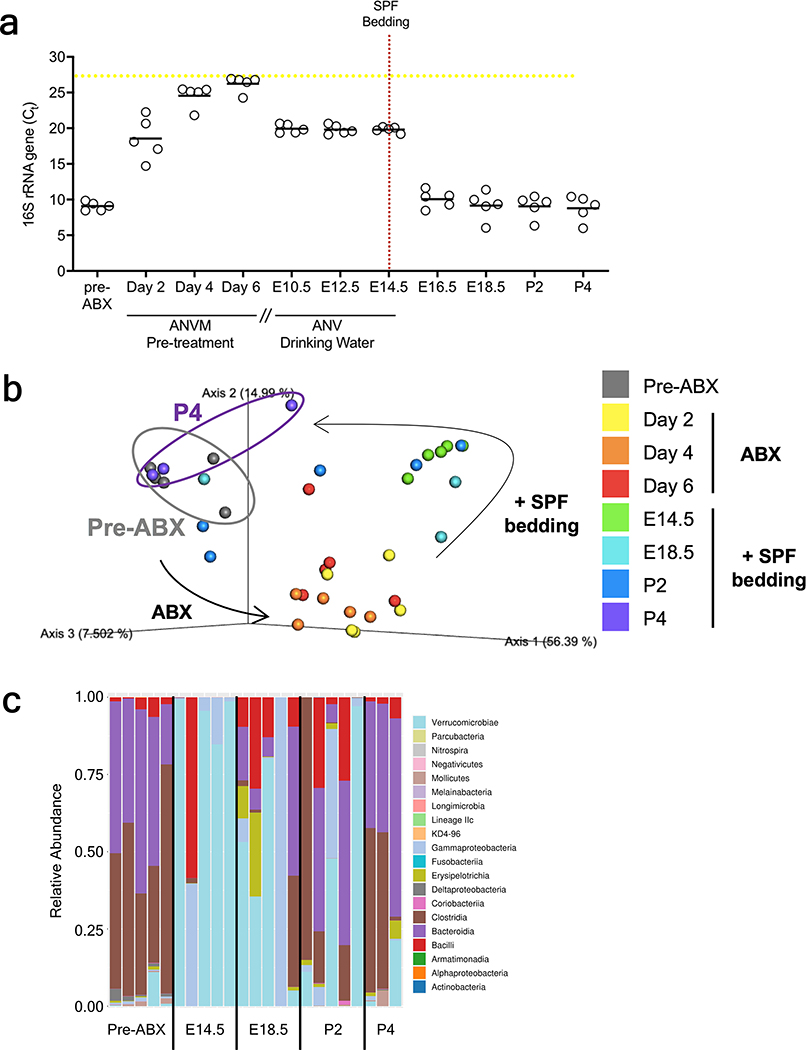
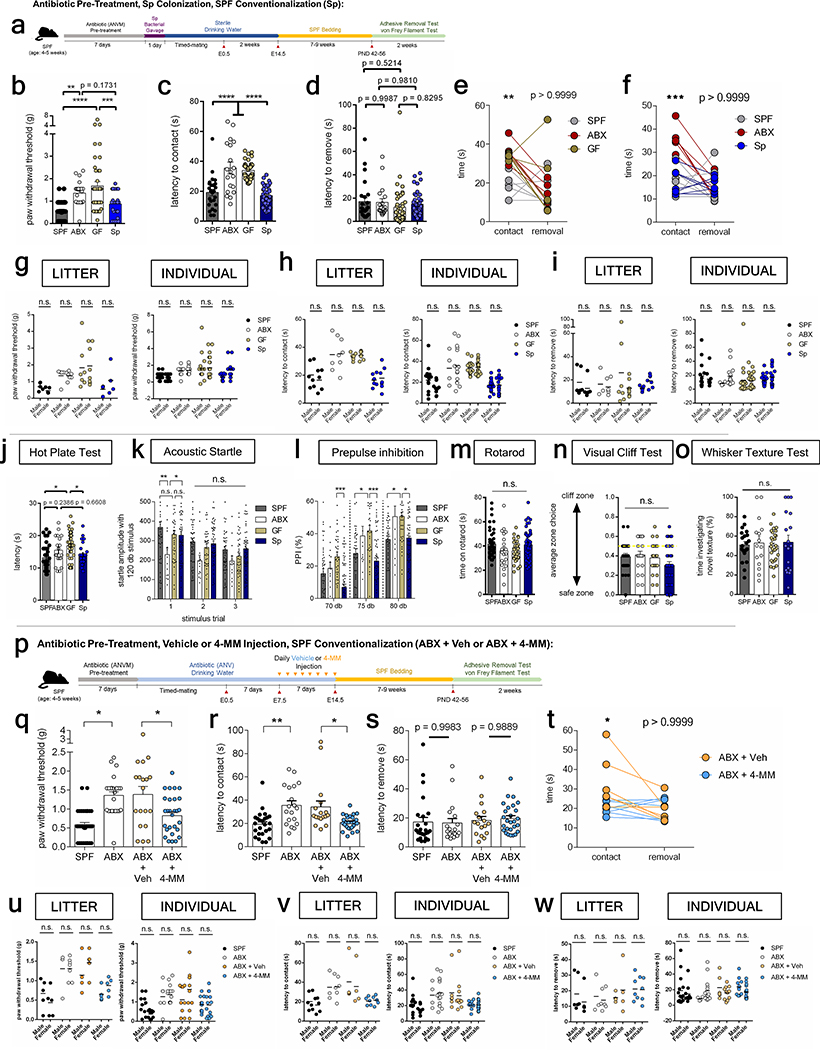
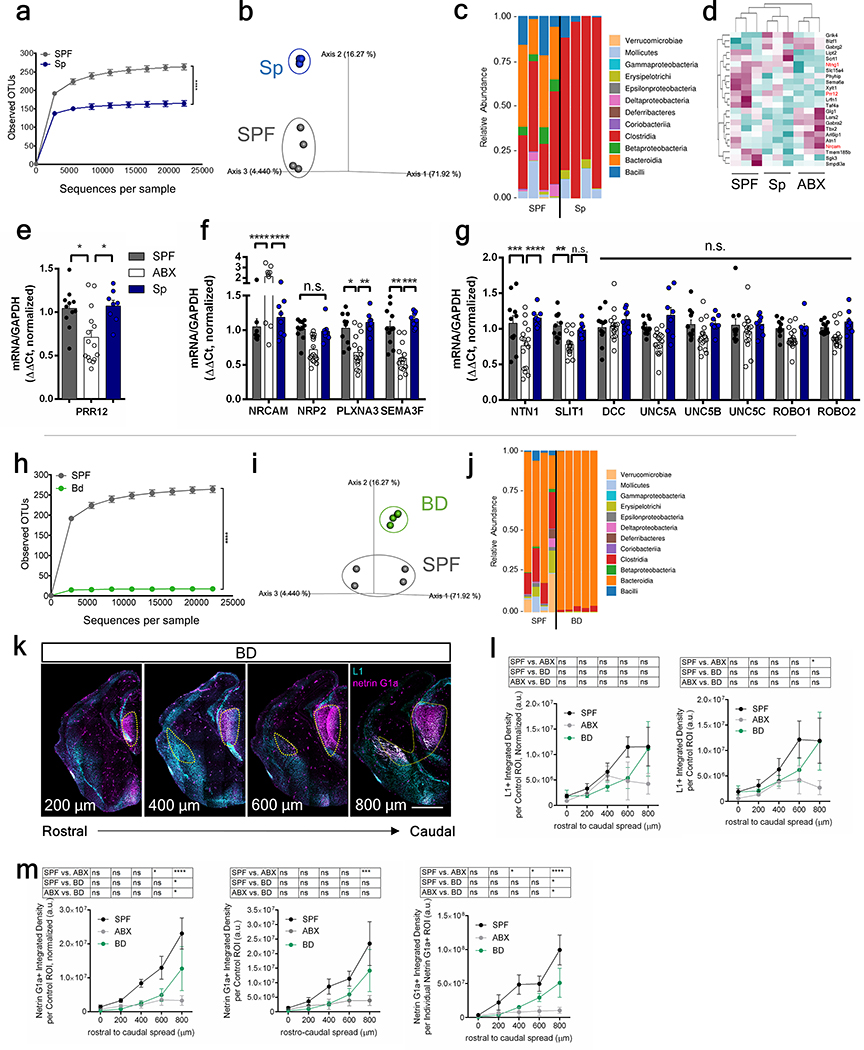
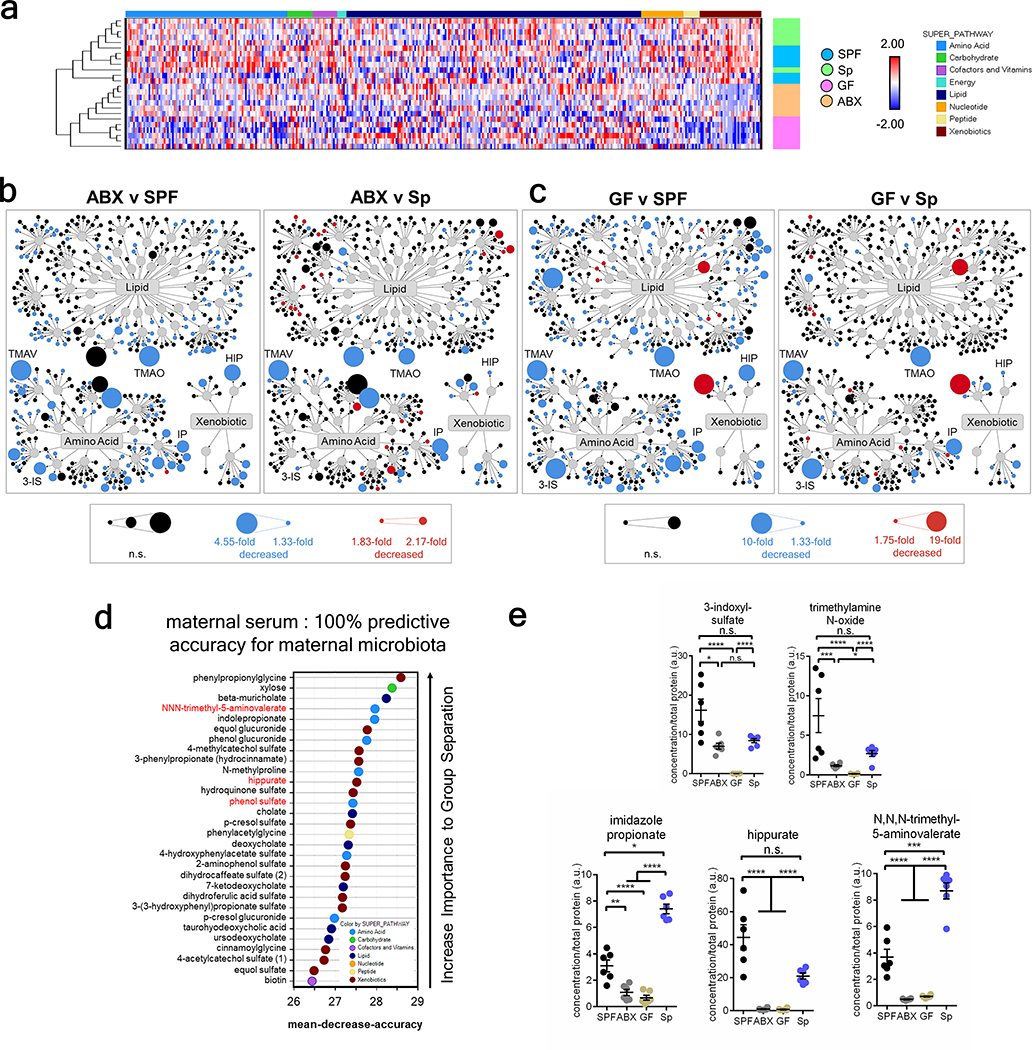
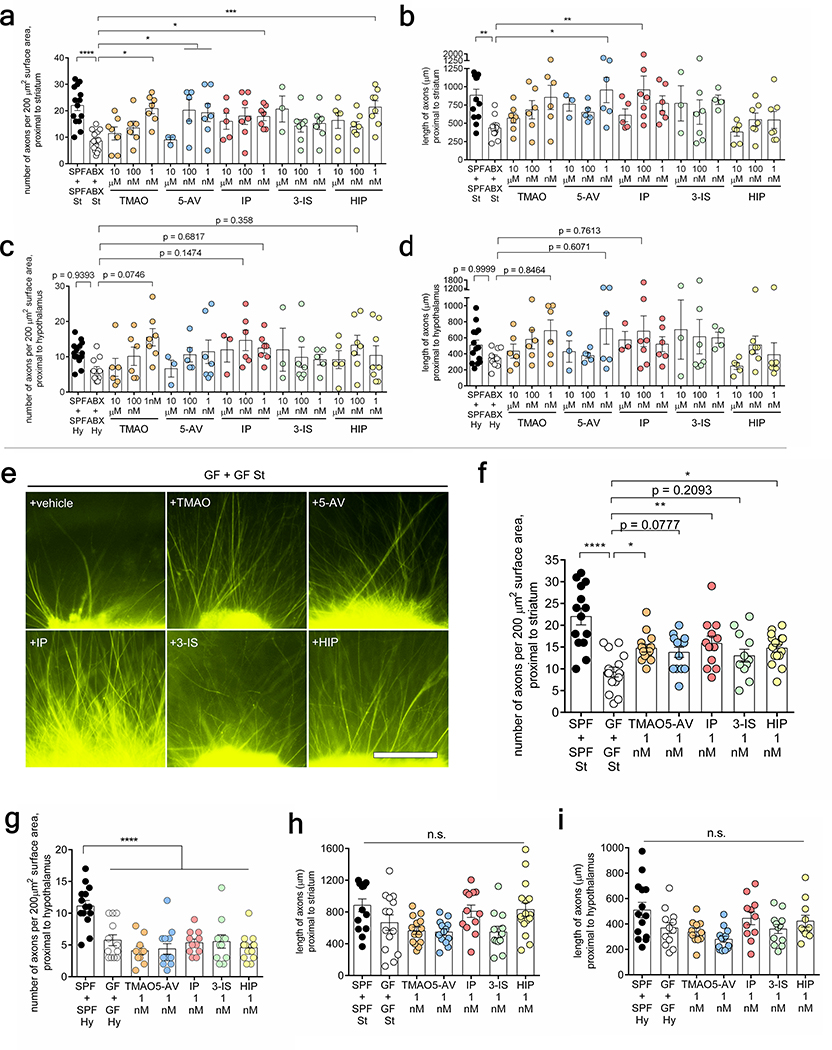
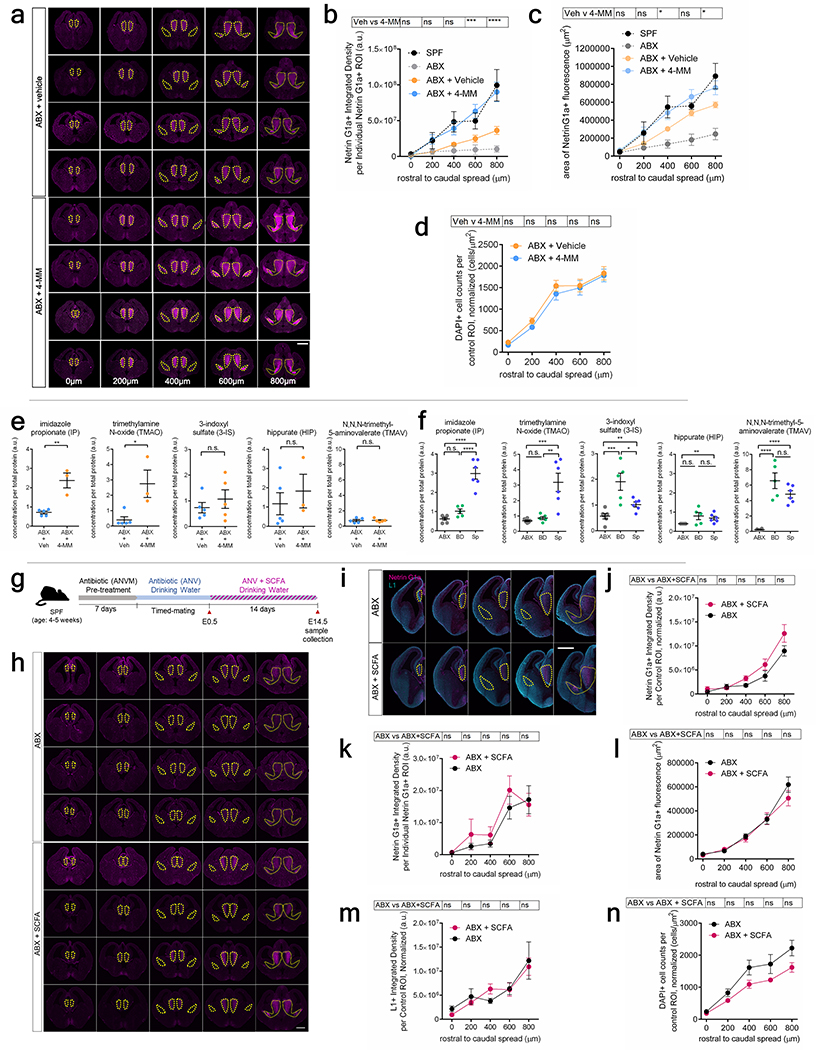
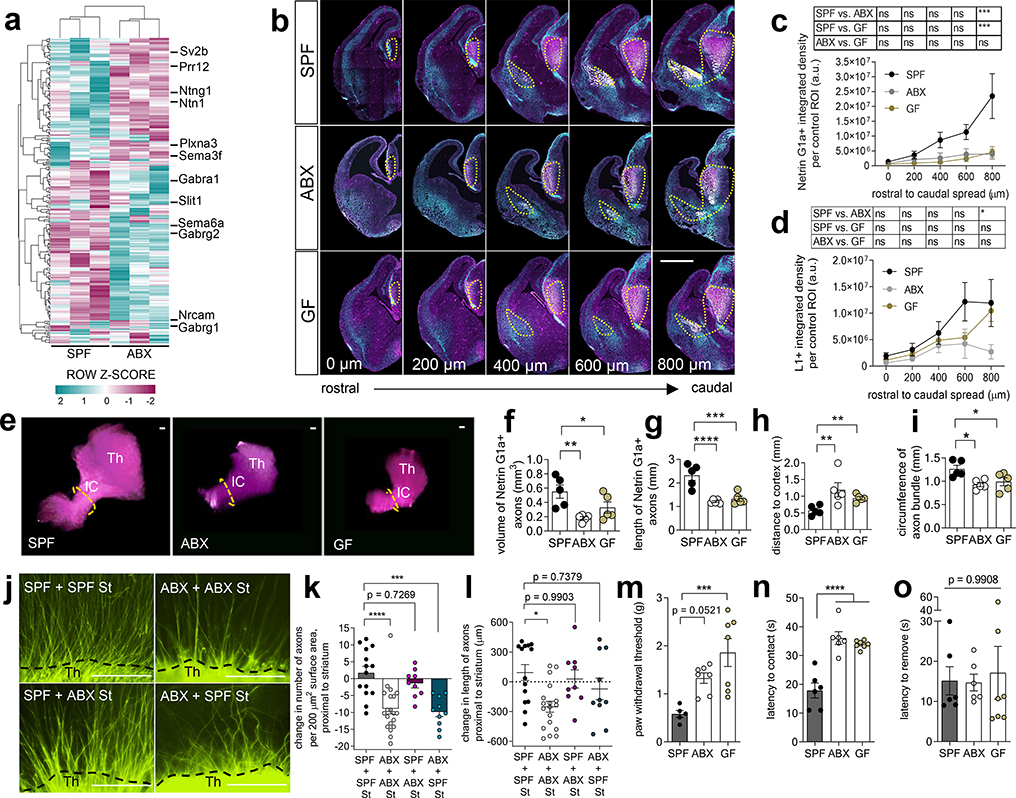
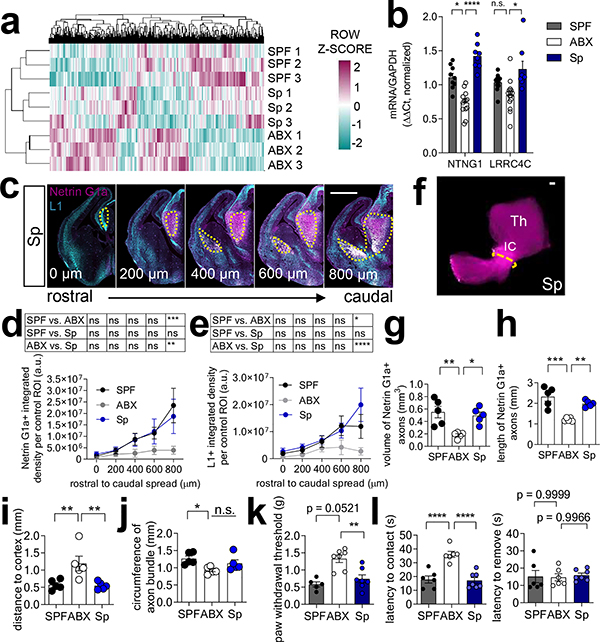
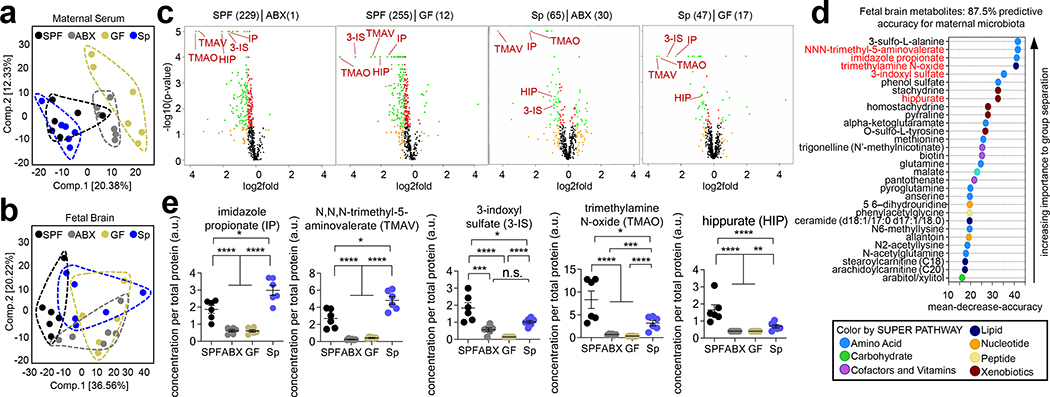
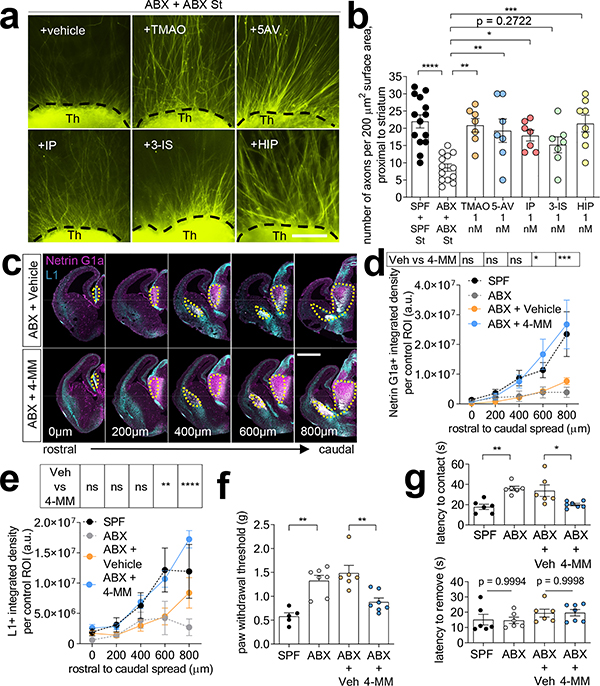
'Dysbiosis' of the maternal gut microbiome, in response to challenges such as infection1, altered diet2 and stress3 during pregnancy, has been increasingly associated with abnormalities in brain function and behaviour of the offspring4. However, it is unclear whether the maternal gut microbiome influences neurodevelopment during critical prenatal periods and in the absence of environmental challenges. Here we investigate how depletion and selective reconstitution of the maternal gut microbiome influences fetal neurodevelopment in mice. Embryos from antibiotic-treated and germ-free dams exhibited reduced brain expression of genes related to axonogenesis, deficient thalamocortical axons and impaired outgrowth of thalamic axons in response to cell-extrinsic factors. Gnotobiotic colonization of microbiome-depleted dams with a limited consortium of bacteria prevented abnormalities in fetal brain gene expression and thalamocortical axonogenesis. Metabolomic profiling revealed that the maternal microbiome regulates numerous small molecules in the maternal serum and the brains of fetal offspring. Select microbiota-dependent metabolites promoted axon outgrowth from fetal thalamic explants. Moreover, maternal supplementation with these metabolites abrogated deficiencies in fetal thalamocortical axons. Manipulation of the maternal microbiome and microbial metabolites during pregnancy yielded adult offspring with altered tactile sensitivity in two aversive somatosensory behavioural tasks, but no overt differences in many other sensorimotor behaviours. Together, our findings show that the maternal gut microbiome promotes fetal thalamocortical axonogenesis, probably through signalling by microbially modulated metabolites to neurons in the developing brain.


Conflict of interest statement

Competing Interests

Findings regarding the manipulation of the maternal microbiome to influence fetal development and sensory behavior reported in the manuscript are the subject of provisional patent application US 62/844,503, owned by UCLA. The authors declare no competing interests.

Figures

Extended Data Fig. 1|
Extended Data Fig. 1|. Network analysis and qPCR validation of fetal brain RNAseq data.
a, Gene ontology analysis of differentially expressed genes from E14.5 brains from ABX v.s. SPF dams (one-tailed Fisher exact, q= 0.012500, 0.017, 0.017, 0.03830902, 0.07449995, 0.07449995, 0.07449995, 0.1001733, n=3 dams). b, Quantitative RT-PCR for Ntng1 and LRRC4C expression in E14.5 brains from offspring of SPF, ABX or GF dams (Two-way ANOVA+Tukey’s, n=9, 15, 10 dams). c, Protein interaction network of genes downregulated in E14.5 brains from offspring of ABX vs. SPF dams (Benjamini-Hochberg, q<0.05, n=3 dams). d, Protein interaction networks of genes upregulated in E14.5 brains from offspring of ABX vs. SPF dams (Benjamini-Hochberg, q<0.05, n=3 dams). Mean±SEM. *p<0.05, n.s.=not statistically significant.
Extended Data Fig. 2|
Extended Data Fig. 2|. Netrin-G1a thalamocortical axons in E14.5 brains of offspring from gnotobiotic dams.
a, Reference diagrams of coronal rostral to caudal E14.5 brain sections. b-e, Netrin-G1a in four independent E14.5 brains from offspring of SPF (b), ABX (c), GF (d), and Sp (e) dams. Scale=500 μm. Yellow lines= matched control ROI. f, Netrin-G1a fluorescence per control ROI in E14.5 brain sections of offspring from SPF, ABX, GF and Sp dams. SPF, ABX, GF and Sp data are as presented in Figure 1c and 3d. (Two-way ANOVA+Tukey’s, n=5 dams). g, Total brain area E14.5 brain section of offspring from SPF, ABX, GF and Sp dams. (Two-way ANOVA+Tukey’s, n=5 dams). h, Netrin-G1a per matched control ROI, normalized by total brain area in E14.5 brain sections of offspring from SPF, ABX, GF and Sp dams. (Two-way ANOVA+Tukey’s, n=5 dams). i, Area of Netrin-G1a in E14.5 brain sections of SPF, ABX, GF and Sp dams. (Two-way ANOVA+Tukey’s, n=5 dams). j, Area of Netrin-G1a+ staining normalized by total brain area in E14.5 brain sections of offspring from SPF, ABX, GF and Sp dams. (Two-way ANOVA+ Tukey’s, n=5 dams). k, Netrin-G1a fluorescence in area of Netrin-G1a+ staining of E14.5 brains from SPF, ABX, GF, and Sp dams. (Two-way ANOVA+Tukey’s, n=5 dams). l, DAPI per matched control ROI, normalized by total brain area in E14.5 brain sections from SPF, ABX, GF and Sp dams. (Two-way ANOVA+Tukey’s, n=5, 7, 4, 5 dams). m, DAPI+ cell per matched control ROI, normalized by total brain area in E14.5 brain sections from SPF, ABX, GF and Sp dams. (Two-way ANOVA+ Tukey’s, n=5, 7, 4, 5 dams). Mean±SEM. *p<0.05, **p<0.01, ***p<0.001, ****p<0.0001, n.s.=not statistically significant.
Extended Data Fig. 3|
Extended Data Fig. 3|. Whole brain volume and L1+ thalamocortical axons in E14.5 brains of offspring from gnotobiotic dams.
a, Micro-computed tomography of E14.5 fetal brain. Scale bar=2 mm. b, Whole fetal brain volume of E14.5 offspring from SPF, ABX, GF and Sp dams. (One-way ANOVA+Tukey’s, n=10, 5, 8, 5 dams). c, Volume of Netrin-G1a axons, normalized to E14.5 SPF, ABX, GF, and Sp whole brain volume. (SPF v ABX: two-tailed Mann-Whitney, SPF v GF, GF v Sp, and ABX v Sp: One-way ANOVA+Tukey’s, n=5 offspring from different dams). d, Length of Netrin-G1a axons, normalized to the cubic root of E14.5 SPF, ABX, GF, and Sp whole brain volume. (SPF v ABX and SPF v GF: One-way ANOVA+Tukey’s, Sp v ABX and Sp v GF: two-tailed Mann-Whitney, n=5 offspring from different dams). e, Distance from rostral tip of Netrin-G1a axon to cortex, normalized to the cubic root of E14.5 SPF, ABX, GF, and Sp whole brain volume. (SPF v ABX and Sp v ABX: One-way ANOVA+Tukey’s, SPF v GF and Sp v GF: two-tailed Mann-Whitney, n=5 offspring from different dams). f, Circumference of Netrin-G1a axonal bundle at the internal capsule (IC), normalized to the cubic root of E14.5 SPF, ABX, GF, and Sp whole brain volume. (One-way ANOVA-Tukey’s, n=5 offspring from different dams). g, Netrin-G1a (magenta) and L1 (cyan) in E14.5 SPF, ABX, GF and Sp brain sections. Scale=500 μm. Yellow lines=matched control ROI. h, L1 per matched control ROI, normalized by total brain area in E14.5 SPF, ABX, GF and Sp brain sections. (Two-way ANOVA+Tukey’s, n=5 dams). i, L1 per matched control ROI in E14.5 brain sections of offspring from SPF, ABX, GF and Sp dams. SPF, ABX, GF, and Sp data are as in Figure 1d and 2e. (Two-way ANOVA+Tukey’s, n=5 dams). Mean±SEM, *p<0.05, **p<0.01, ****p<0.0001, n.s.=not statistically significant.
Extended Data Fig. 4|
Extended Data Fig. 4|. Thalamic explant monocultures and co-cultures with striatal and hypothalamic explants.
a, Axon outgrowth from monoculture of thalamic explants (Th) from E14.5 offspring of SPF, ABX, GF and Sp dams. Scale=250 μm. In Th monocultures: b, axon number, and c, axon length (One-way ANOVA+Tukey’s, n=26, 20, 21, 10 explants). d, Axon outgrowth from i) SPF Th+SPF hypothalamic explant (Hy), ii) ABX Th+ABX Hy, iii) SPF Th+ABX Hy, iv) ABX Th+SPF Hy. Scale=250 μm. Proximal to Hy: e, axon number /200 μm2 surface area, normalized to Th monoculture, and f, axon length, normalized to Th monoculture. (One-way ANOVA+Tukey’s, n=14, 20, 9, 10 explants). g, Axon outgrowth from GF Th+GF St. Scale bar=250 μm. Proximal to St: h, axon number/200 μm2 surface area, normalized to Th monoculture, and i, axon length, normalized to Th monoculture. (One-way ANOVA+Tukey’s, n=16 GF explants). j, Axon outgrowth from GF Th+GF Hy. Scale bar=250 μm. Proximal to Hy: k, axon number/200 μm2 surface area, normalized to Th monoculture, and l, axon length, normalized to Th monoculture. (One-way ANOVA+Tukey’s, n=14 GF explants). m, Axon outgrowth from i) SPF Th+SPF St, ii) ABX Th+ABX St, iii) Sp Th+Sp St, iv) Sp Th+ABX St. Scale=250 μm. Proximal to St: n, axon number/200 μm2 surface area, normalized to Th monoculture, and o, axon length, normalized to Th monoculture. (One-way ANOVA+Tukey’s, n=14, 20, 14, 6 explants). p, Axon outgrowth from i) SPF Th+SPF Hy, ii) ABX Th+ABX Hy, iii) Sp Th+Sp Hy, iv) Sp Th+ABX Hy. Arrows=sparse short axons. Scale=250 μm. Proximal to Hy: q, axon number/200 μm perimeter, normalized to Th monoculture, and r, axon length, normalized to Th monoculture. (One-way ANOVA+Tukey’s, n=14, 20, 14, 6 explants). SPF and ABX data in g-i and m-o are in Figure 1l, 1m. Mean±SEM. *p<0.05, **p<0.01, ***p<0.001, ****p<0.0001, n.s.=not statistically significant.
Extended Data Fig. 5|
Extended Data Fig. 5|. Effects of maternal antibiotic treatment and gestational conventionalization on the fecal microbiota.
a, Bacterial load of the maternal fecal microbiota in response to antibiotic (ANVM=ampicillin, neomycin, vancomycin, metronidazole) treatment and conventionalization with SPF microbiota. Yellow line=Ct of germ-free control. (n=5 cages). b, Principal coordinate analysis of 16S rRNA gene sequencing data (weighted Unifrac distances) for maternal fecal microbiota prior to antibiotic treatment (pre-ABX), on Day 2, 4, or 6 after ABX treatment, and on Day 0 (E14.5), 4 (E18.5), 6 (P2) and 8 (P4) after exposure to SPF bedding. (n=5, 5, 5, 5, 3 cages). c, Class-level taxonomic diversity of maternal fecal microbiota pre-ABX and on Day 0 (E14.5), 4 (E18.5), 6 (P2) and 8 (P4) after exposure to SPF bedding. (n=5, 5, 5, 5, 3 cages).
Extended Data Fig. 6|
Extended Data Fig. 6|. Effects of the maternal microbiome on behaviors.
a, Maternal Sp colonization and SPF conventionalization. b, Force filament to induce 50% paw withdrawal (One-way ANOVA+Tukey’s, n=38, 24, 45, 25 offspring). c, Latency to contact the adhesive, and d, latency to remove adhesive after first contact (One-way ANOVA+Tukey’s, n=35, 19, 45, 38 offspring). e-f, Pairwise data for latency to contact and remove adhesive. (Two-way ANOVA+Sidak’s, n=6, 6, 7, 7 dams). g, Force filament to induce 50% paw withdrawal by sex, per litter or individual (Two-way ANOVA+Tukey’s, n=5, 7, 7, 7 dams). h, Latency to contact and i, remove adhesive after first contact (Two-way ANOVA+Tukey’s, n=6, 6, 7, 11 dams). j, Latency to withdraw from hot plate (One-way ANOVA+Tukey’s; n=37, 19, 45, 25 offspring). k, Habituation to acoustic tone (Two-way ANOVA+Tukey’s; n=45, 25, 45, 52 offspring). l, Inhibitory effect of prepulse on startle (Two-way ANOVA+Tukey’s; n=45, 25, 45, 52 offspring). m, Time on rotarod (One-way ANOVA+Tukey’s; n=45, 20, 45, 50 offspring). n, Visual depth discrimination. y=0.05, equal instances of exiting safe vs. cliff zone. (One-way ANOVA+Tukey’s; n=38, 19, 45, 52 offspring). o, Percent time investigating novel texture (One-way ANOVA+Tukey’s; n=20, 15, 29, 18 offspring). p, 4-MM treatment and SPF conventionalization. q, Force filament to induce 50% paw withdrawal (One-way ANOVA+Tukey’s, n=10, 23, 15, 21 offspring). r, Latency to contact and s, remove adhesive after first contact (One-way ANOVA+Tukey’s, n=25, 19, 15, 22 offspring). t, Pairwise data for latency to contact and remove adhesive. (Two-way ANOVA+Sidak’s, n = 5, 5 dams). u, Force filament to induce 50% paw withdrawal by sex, per litter or individual (Two-way ANOVA+Tukey’s, n=5, 7, 5, 5 dams). v, Latency to contact and w, remove adhesive after first contact. (Two-way ANOVA+Tukey’s, n=6, 6, 5, 5 dams). Data for SPF and ABX in u-w are as in g-i. *p<0.05, **p<0.01, ***p<0.001, ****p<0.0001. n.s.=not statistically significant. Number of dams, sex of offspring per group and behavioral task are detailed in Supplementary Table 3.
Extended Data Fig. 7|
Extended Data Fig. 7|. Maternal gut microbiota and fetal thalamocortical axons in dams colonized with a consortium of spore-forming bacteria (Sp) or Bacteroides (BD).
Fecal microbiota of E14.5 SPF and Sp dams (n=4 dams): a, rarefaction curves of observed operational taxonomic units (OTUs). b, Principal coordinate analysis of weighted sequencing data, and c, order-level taxonomic diversity. d, Genes commonly differentially expressed in E14.5 brains from offspring of SPF and Sp vs. ABX dams (two-tailed Wald, n=3 dams). Data for SPF and ABX are as in Figure 1. Red indicates axonogenesis-related genes. e, PRR12 expression in E14.5 brains from offspring of SPF, ABX, and Sp dams (one-way ANOVA+Tukey’s; n = 11, 15, 8 offspring). f, g, Expression of axonogenesis-related genes in E14.5 brains from SPF, ABX, and Sp dams (Two-way ANOVA+Tukey’s; n=11, 16, 8 offspring). Fecal microbiota of E14.5 SPF and BD dams (n=4, 5 dams): h, rarefaction curves of the observed OTUs, i, principal coordinate analysis of weighted data, and j, order-level taxonomic diversity. k, Netrin-G1a (magenta) and L1 (cyan) in E14.5 brain sections of BD dams. Scale=500 μm. Yellow lines=matched control ROI. l, L1 per matched control ROI, un-normalized (right) and normalized (left) by total brain area of E14.5 brain sections of SPF, ABX, and BD dams. Data for SPF and ABX are as in Figures 1d and 2e, Extended Data Figure 3g–i. (Two-way ANOVA+Tukey’s, n=5 dams). m, Netrin-G1a per matched control ROI, un-normalized (middle) and normalized by total area of E14.5 brain sections (left). Netrin-G1a in area of Netrin-G1a+ staining in E14.5 brain sections (right). Data for SPF and ABX are as in Figures 1c and 2d, Extended Data Figure 2. (Two-way ANOVA+Tukey’s, n=5 dams). Mean±SEM. *p<0.05, **p<0.01, ***p<0.001, ****p<0.0001, n.s.=not statistically significant.
Extended Data Fig. 8|
Extended Data Fig. 8|. Maternal serum and fetal brain metabolomic profiles from gnotobiotic dams.
a, Unsupervised hierarchical clustering of 753 maternal serum metabolites (n = 6 dams). b, Amino acid, lipid and xenobiotic metabolites dysregulated in E14.5 fetal brains of offspring from ABX vs. SPF dams (left) and ABX vs. Sp dams (right) (q<0.05; One-way ANOVA, n=6 embryos from different dams). c, Amino acid, lipid and xenobiotic metabolites significantly dysregulated in E14.5 fetal brains of offspring from GF dams vs. SPF controls (left) and GF dams vs. Sp dams (right) (q<0.05; One-way ANOVA, n=offspring from 6 dams per group). d, Random Forest classification of top 30 metabolites in maternal serum that discriminate between SPF and Sp vs. ABX and GF dams. (n=6 dams). e, Relative concentrations of N,N,N-trimethyl-5-aminovalerate (TMAV), trimethylamine N-oxide (TMAO), imidazole propionate (IP), hippurate (HIP), and 3-indoxyl-sulfate (3-IS) in maternal sera of SPF, ABX, GF, and Sp dams (One-way ANOVA with FDR contrasts; n=6 dams). Mean±SEM. *q<0.05, **q<0.01, ***q<0.001, ****q<0.0001, n.s.=not statistically significant.
Extended Data Fig. 9|
Extended Data Fig. 9|. Effects of microbiome-dependent metabolites on thalamocortical axon outgrowth from GF explant co-cultures.
a, Axon number and b, axon length per 200 μm2 surface area proximal to striatal explant (St) and from i) SPF thalamic explant (Th)+SPF St ii) ABX Th+ABX St, and iii) ABX Th+ABX St, supplemented with 1 nM, 100 nM, 10 μM of metabolites: trimethylamine N-oxide (TMAO), 5-aminovalerate (5-AV), imidazole propionate (IP), 3-indoxyl-sulfate (3-IS) or hippurate (HIP). (One-way ANOVA+Tukey’s, n= 14, 13, TMAO: 7, 6, 7, 5-AV: 3, 5, 7, IP: 5, 7, 7, 3-IS: 3, 7, 7, HIP: 6, 7, 8 explants). c, Axon number, and d, axon length per 200 μm2 surface area proximal to hypothalamic explant (Hy) from i) SPF Th+SPF Hy), ii) ABX Th+ABX Hy, and iii) ABX Th+ABX Hy, supplemented with metabolites. (One-way ANOVA+Tukey’s, n=14, 10, TMAO: 6, 6, 7, 5-AV: 3, 5, 7, IP: 3, 6, 7, 3-IS: 3, 7, 5, HIP: 5, 7, 8 explants). e, E14.5 GF Th proximal to GF St treated with metabolites. Scale=250 μm. f, g, Axon number and h, i, axon length per 200 μm perimeter proximal to St (f, h) and Hy (g, i). (One-way ANOVA+Tukey’s, n=14, 15, 14, 13, 12, 12, 16 explants). Mean±SEM. *p<0.05, **p<0.01, ****p<0.0001
Extended Data Fig. 10|
Extended Data Fig. 10|. Microbiome-dependent metabolites in E14.5 brains after maternal supplementation with 4-MM or SCFA and effects on netrin-G1a thalamocortical axons.
a, Netrin-G1a in four independent E14.5 brains from offspring of ABX+vehicle and ABX+4-MM dams. Scale=500 μm, b, Netrin-G1a in area of Netrin-G1a+ staining in E14.5 brains from ABX+vehicle and ABX+4-MM dams. (Two-way ANOVA+Tukey’s, n=8 dams). c, Area of Netrin-G1a+ staining in E14.5 brain sections. (Two-way ANOVA+Tukey’s, n=8 dams). d, DAPI counts per matched ROI (yellow lines) normalized by total brain area. (Two-way ANOVA+Tukey’s, n=4 dams). e, Levels of the metabolites i) imidazole propionate (IP), ii) trimethylamine oxide (TMAO), iii) 3-indoxyl-sulfate (3-IS), iv) hippurate (HIP) and v) N, N, N-trimethyl-5-aminovalerate (TMAV) in E14.5 brain lysates from antibiotic-treated dams supplemented with 4-MM or vehicle (One-way ANOVA, n=5 (ABX+vehicle), 3, 3, 5, 3, 5 (ABX+4-MM) dams). f, Levels of IP, TMAO, 3-IS, HIP, and TMAV in E14.5 brain lysates from BD dams. (One-way ANOVA+Tukey’s, n = 6, 6, 5 dams). g, SCFA administration. h, Netrin-G1a in four independent E14.5 brain sections from offspring of ABX and ABX+SCFA dams. Scale=500 μm, i, Netrin-G1a and L1 in E14.5 brain sections from offspring of ABX and ABX+SCFA dams. j, Netrin-G1a per matched control ROI, normalized by total brain area. (Two-way ANOVA+Tukey’s, n=4, 7 dams). k, Netrin-G1a in area of Netrin-G1a+ staining. (Two-way ANOVA+Tukey’s, n=4, 7 dams). l, Area of Netrin-G1a+ staining. (Two-way ANOVA+Tukey’s, n=4, 7 dams). m, L1 per matched control ROI, normalized by total brain area. (Two-way ANOVA+Tukey’s, n=4, 7 dams). n, DAPI count per matched ROI, normalized by total brain area. (Two-way ANOVA+Tukey’s, n=4, 7 dams). Mean±SEM. *p<0.05, **p<0.01, ***p<0.001, n.s.=not statistically significant.
Fig. 1|
Fig. 1|. Depletion of the maternal microbiome impairs fetal thalamocortical axonogenesis.
a, Differentially-expressed genes in E14.5 brains from SPF and ABX dams (Two-tailed Wald, p<0.05, n=3 dams). Axonogenesis-related genes are highlighted. b, Netrin-G1a (magenta) and L1 (cyan) in E14.5 brains from SPF, ABX and GF dams. Scale=500 μm. Yellow lines=control ROIs. c, Netrin-G1a fluorescence per matched control ROI in E14.5 brain sections. (Two-way ANOVA+Tukey’s, n=5 offspring from different dams). d, L1 fluorescence per matched control ROI in E14.5 brain sections (Two-way ANOVA+Tukey’s, n=5 offspring from different dams). e, Netrin-G1a in whole E14.5 brains. Scale=100μm. Th=thalamus, IC=internal capsule. Dotted line=axon bundle circumference. In whole E14.5 brains, Netrin-G1a+ axonal: f, volume, g, length, h, distance from rostral tip to cortex, and i, circumference of the bundle at internal capsule. (SPF-ABX: One-way ANOVA+Tukey’s, SPF-GF: one-tailed Mann-Whitney, n=5 offspring from different dams). j, TUJ1+ axons from i) SPF Th+SPF St, ii) ABX Th+ABX St, iii) SPF Th+ABX St, iv) ABX Th+SPF St. Scale=250 μm. k, Axons/200 μm2 surface area proximal to St, normalized to Th monoculture. (Two-way ANOVA+Tukey’s, n=14, 20, 9, 10). l, Length of thalamic axons proximal to St, normalized to Th monoculture. (Two-way ANOVA+Tukey’s, n=14, 20, 9, 10). Behavior in adult offspring of SPF, ABX, and GF dams: m, force filament to induce 50% paw withdrawal (One-way ANOVA+Tukey’s, n = 5, 7, 7 dams), n, latency to contact the adhesive (One-way ANOVA+Tukey’s, n = 6, 6, 7 dams), and o, latency to remove the adhesive after first contact (One-way ANOVA+Tukey’s, n = 6, 6, 7 dams). Mean±SEM, *p<0.05, **p<0.01, ***p<0.001, ****p<0.0001, n.s.=not statistically significant.
Fig. 2|
Fig. 2|. Colonization of the maternal microbiota prevents neurodevelopmental abnormalities induced by microbiome depletion.
a, Differentially expressed genes in E14.5 brains of SPF, ABX, and Sp dams (Two-tailed Wald, n=3 dams). b, NTNG1 and LRRC4C expression in E14.5 brains (Two-way ANOVA+Tukey’s, n=9, 13, 8 offspring from different dams). c, Netrin-G1a (magenta) and L1 (cyan) in E14.5 Sp brain sections. Scale=500μm. d, Netrin-G1a fluorescence per matched ROI in E14.5 brain sections. (Two-way ANOVA+Tukey’s, n=5 offspring from different dams). e, L1 fluorescence per matched ROI in E14.5 brain sections (Two-way ANOVA+Tukey’s, n= 5 offspring from different dams). f, Netrin-G1a in whole E14.5 brains from Sp dams. Scale=100μm. g, Volume of Netrin-G1a axons in whole E14.5 brains. (One-way ANOVA+Tukey’s; n= 5 offspring from different dams). h, Length of Netrin-G1a axons in whole E14.5 brains. (One-way ANOVA+Tukey’s; n= 5 offspring from different dams). i, Distance from distal tip of Netrin-G1a axons to cortex in whole E14.5 brains. (One-way ANOVA+Tukey’s; n= 5 offspring from different dams). j, Circumference of Netrin-G1a axonal bundle at the internal capsule (IC) in whole E14.5 brains. (One-way ANOVA+Tukey’s; n= 5 offspring from different dams). k, Force filament to induce 50% paw withdrawal in adult offspring (One-way ANOVA+Tukey’s, n = 5, 7, 7 dams). l, Forepaw sensitivity, as latency to contact the adhesive tape, in adult offspring (left) (One-way ANOVA+Tukey’s, n = 6, 6, 7 dams). Forepaw motor dexterity, as latency to remove the adhesive tape after first contact, in adult offspring (right) (One-way ANOVA+Tukey’s, n = 6, 6, 7 dams). Mean±SEM. SPF and ABX data are as displayed in Figure 1, 2 and Extended Figure 2, 3, 4. *p<0.05, **p<0.01, ***p<0.001, ****p<0.0001, n.s.=not statistically significant
Fig. 3|
Fig. 3|. The maternal microbiota modulates maternal serum and fetal brain metabolites during pregnancy.
a, Principal component analysis of maternal serum metabolomes from SPF, ABX, GF, and Sp dams on E14.5 (n = 6 dams) b, Principal component analysis of 567 metabolites detected in fetal brain metabolomes from E14.5 offspring of SPF, ABX, GF, and Sp dams (n = 6 embryos from different dams). c, Significantly regulated E14.5 fetal brain metabolites. Orange=log2fold>0.5. Red=p<0.05. Green=log2fold>0.5 and p<0.05 (One-way ANOVA with FDR contrasts, n=6 embryos from different dams). d, Random Forest classification of top 30 metabolites in E14.5 fetal brain that discriminate between SPF and Sp dams vs. ABX and GF dams. Red= >2-fold decrease in ABX and GF vs. SPF and Sp (n=6 embryos from different dams). e, Select metabolites significantly decreased in E14.5 fetal brains from embryos of ABX and GF dams versus SPF and Sp dams. (One-way ANOVA with FDR contrasts, n=6 embryos from different dams). Mean±SEM. *q<0.05, **q<0.01, ***q<0.001, ****q<0.0001, n.s. = not statistically significant.
Fig. 4|
Fig. 4|. The maternal microbiota modulates metabolites that promote fetal thalamocortical axonogenesis.
a, Axon outgrowth from ABX thalamic explants proximal to ABX striatal explant, and supplemented with i) vehicle, ii) trimethylamine N-oxide (TMAO, 1 nM) iii) 5-aminovalerate (5-AV, 1 nM), iv) imidazole propionate (IP, 1 nM), v) 3-indoxyl-sulfate (3-IS, 1 nM) or vi) hippurate (HIP, 1 nM). Scale= 250μm. b, Number of axons per 200 μm2 surface area proximal to striatal explant (One-way ANOVA+Tukey’s, n=14, 13, 7, 7, 7, 7, 8). c, Netrin-G1a (magenta) and L1 (cyan) in E14.5 brain sections from ABX dams treated with vehicle or 4-microbial metabolites (4-MM: TMAO, 5-AV, IP, and HIP). Scale= 500 μm. d, Netrin-G1a per matched ROI (yellow lines) in E14.5 brain sections of vehicle- or 4-MM-treated ABX dams. (Two-way ANOVA+Tukey’s, n= 8 offspring from different dams). e, L1 per matched ROI in E14.5 brain sections from vehicle or 4-MM-treated ABX dams. (Two-way ANOVA+Tukey’s, n=8 offspring from different dams). f, Force filament to induce 50% paw withdrawal in adult offspring of SPF, ABX, ABX+Veh, and ABX+4-MM dams (One-way ANOVA+Tukey’s, n=5, 7, 6, 7 dams). g, Latency to contact the adhesive in adult offspring of SPF, ABX, ABX+Veh, ABX+4-MM dams (top) (One-way ANOVA+Tukey’s, n = 6, 6, 6, 7 dams). Latency to remove the adhesive after first contact in offspring of SPF, ABX, and ABX+Veh, ABX+4-MM dams (bottom) (One-way ANOVA+Tukey’s, n = 6, 6, 6, 7 dams). Behavioral data for SPF and ABX as reference controls are as in Figures 2 and 3. Mean±SEM. *p<0.05, **p<0.01, ***p<0.001, ****p<0.0001, n.s.=not statistically significant.

Comment in

  • Maternal microbes support fetal brain wiring.
    Meckel KR, Kiraly DD. Meckel KR, et al. Nature. 2020 Oct;586(7828):203-205. doi: 10.1038/d41586-020-02657-y. Nature. 2020. PMID: 32968244 No abstract available.
  • Mother's microbes.
    Lewis S. Lewis S. Nat Rev Neurosci. 2020 Dec;21(12):666-667. doi: 10.1038/s41583-020-00401-z. Nat Rev Neurosci. 2020. PMID: 33116298 No abstract available.

References

    1. Kim S et al. Maternal gut bacteria promote neurodevelopmental abnormalities in mouse offspring. Nature 549, 528–532, doi:10.1038/nature23910 (2017). - DOI - PMC - PubMed
    1. Buffington SA et al. Microbial Reconstitution Reverses Maternal Diet-Induced Social and Synaptic Deficits in Offspring. Cell 165, 1762–1775, doi:10.1016/j.cell.2016.06.001 (2016). - DOI - PMC - PubMed
    1. Jasarevic E et al. The maternal vaginal microbiome partially mediates the effects of prenatal stress on offspring gut and hypothalamus. Nat Neurosci 21, 1061–1071, doi:10.1038/s41593-018-0182-5 (2018). - DOI - PubMed
    1. Vuong HE, Yano JM, Fung TC & Hsiao EY The Microbiome and Host Behavior. Annu Rev Neurosci 40, 21–49, doi:10.1146/annurev-neuro-072116-031347 (2017). - DOI - PMC - PubMed
    1. Ferretti P et al. Mother-to-Infant Microbial Transmission from Different Body Sites Shapes the Developing Infant Gut Microbiome. Cell Host Microbe 24, 133–145 e135, doi:10.1016/j.chom.2018.06.005 (2018). - DOI - PMC - PubMed

Supplementary References:

    1. Reikvam DH et al. Depletion of murine intestinal microbiota: effects on gut mucosa and epithelial gene expression. PLoS One 6, e17996, doi:10.1371/journal.pone.0017996 (2011). - DOI - PMC - PubMed
    1. McVey Neufeld KA, Perez-Burgos A, Mao YK, Bienenstock J & Kunze WA The gut microbiome restores intrinsic and extrinsic nerve function in germ-free mice accompanied by changes in calbindin. Neurogastroenterology and motility : the official journal of the European Gastrointestinal Motility Society 27, 627–636, doi:10.1111/nmo.12534 (2015). - DOI - PubMed
    1. Yano JM et al. Indigenous bacteria from the gut microbiota regulate host serotonin biosynthesis. Cell 161, 264–276, doi:10.1016/j.cell.2015.02.047 (2015). - DOI - PMC - PubMed
    1. Kim D, Langmead B & Salzberg SL HISAT: a fast spliced aligner with low memory requirements. Nat Methods 12, 357–360, doi:10.1038/nmeth.3317 (2015). - DOI - PMC - PubMed
    1. Pertea M, Kim D, Pertea GM, Leek JT & Salzberg SL Transcript-level expression analysis of RNA-seq experiments with HISAT, StringTie and Ballgown. Nat Protoc 11, 1650–1667, doi:10.1038/nprot.2016.095 (2016). - DOI - PMC - PubMed

Publication types

MeSH terms

LinkOut - more resources