. 2020 Nov;587(7833):264-269.
doi: 10.1038/s41586-020-2758-y. Epub 2020 Sep 23.

Hippocampal CA2 sharp-wave ripples reactivate and promote social memory

Affiliations

Hippocampal CA2 sharp-wave ripples reactivate and promote social memory

Azahara Oliva et al. Nature. 2020 Nov.

Abstract

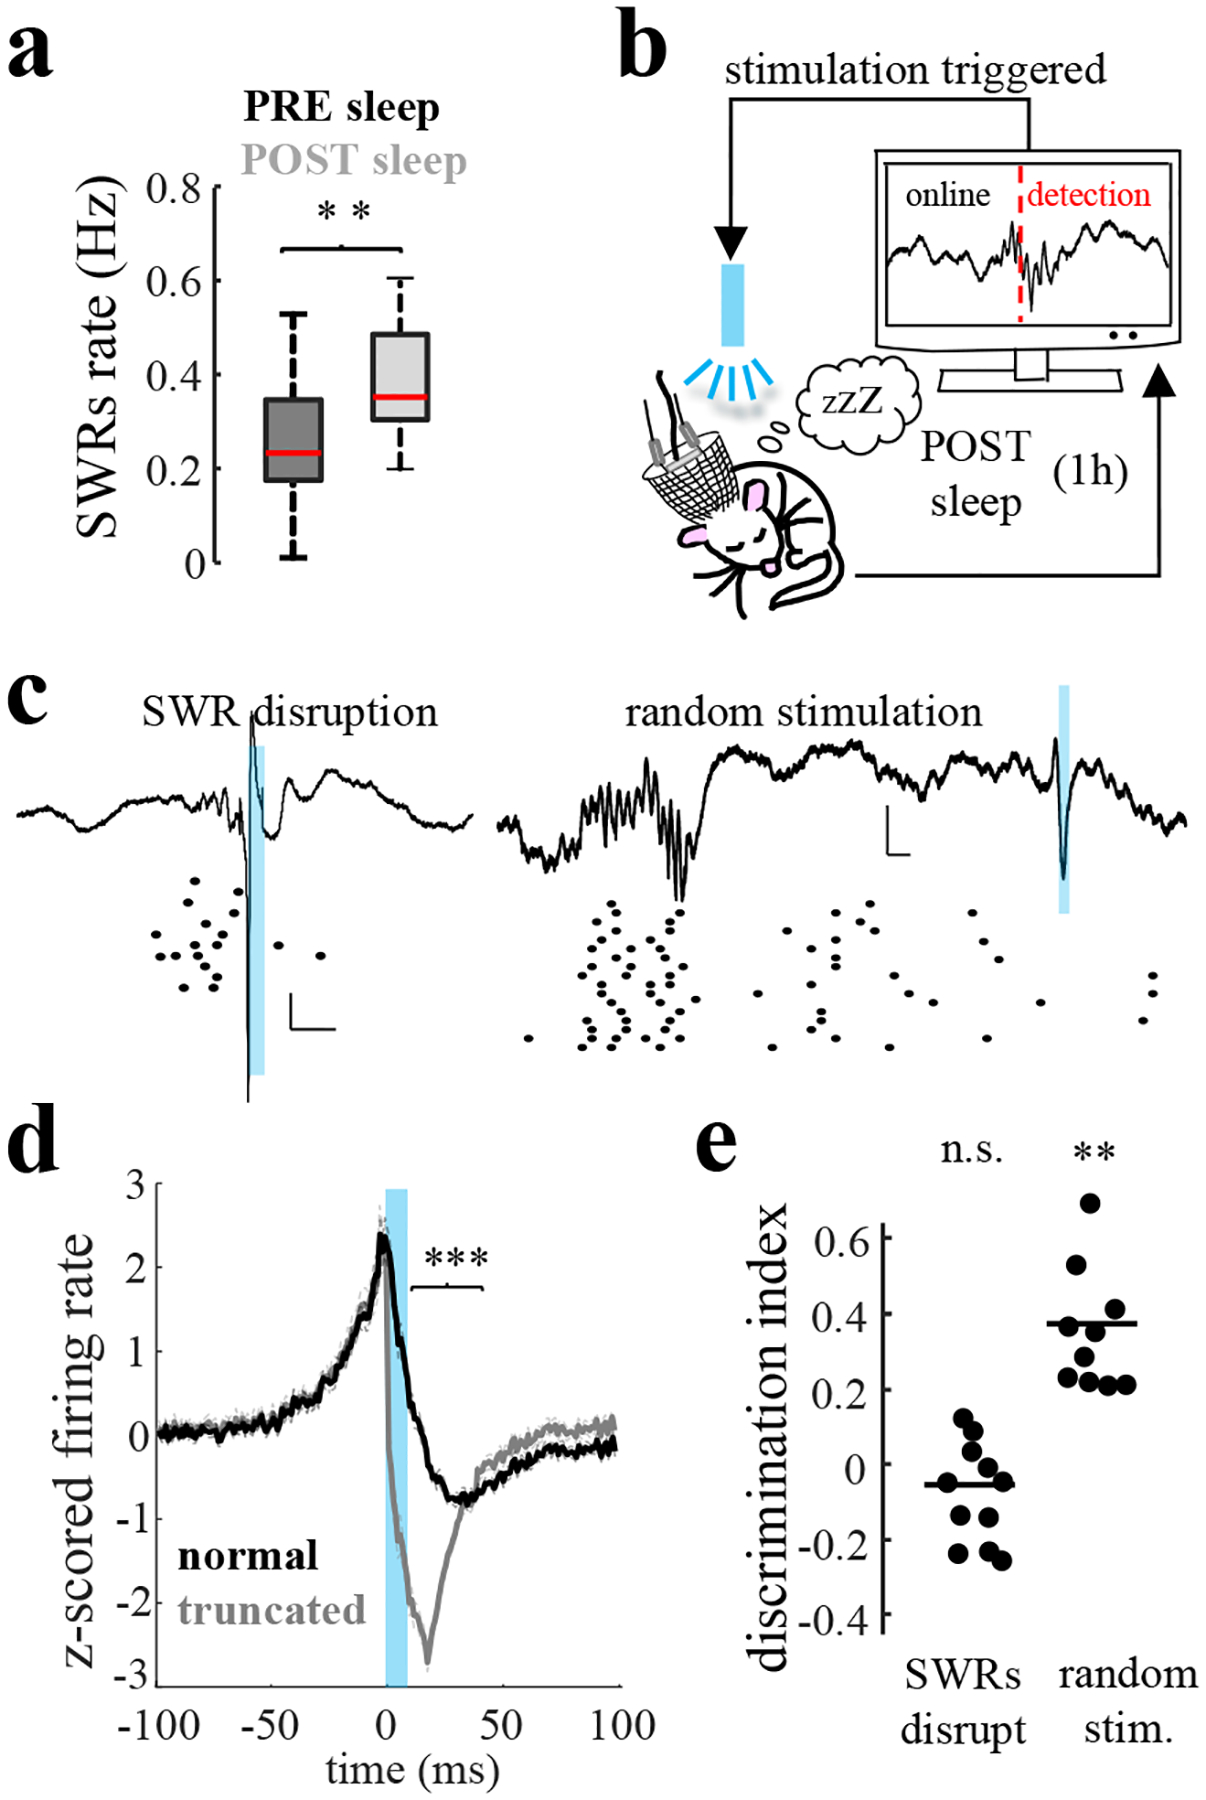
The consolidation of spatial memory depends on the reactivation ('replay') of hippocampal place cells that were active during recent behaviour. Such reactivation is observed during sharp-wave ripples (SWRs)-synchronous oscillatory electrical events that occur during non-rapid-eye-movement (non-REM) sleep1-8 and whose disruption impairs spatial memory3,5,6,8. Although the hippocampus also encodes a wide range of non-spatial forms of declarative memory, it is not yet known whether SWRs are necessary for such memories. Moreover, although SWRs can arise from either the CA3 or the CA2 region of the hippocampus7,9, the relative importance of SWRs from these regions for memory consolidation is unknown. Here we examine the role of SWRs during the consolidation of social memory-the ability of an animal to recognize and remember a member of the same species-focusing on CA2 because of its essential role in social memory10-12. We find that ensembles of CA2 pyramidal neurons that are active during social exploration of previously unknown conspecifics are reactivated during SWRs. Notably, disruption or enhancement of CA2 SWRs suppresses or prolongs social memory, respectively. Thus, SWR-mediated reactivation of hippocampal firing related to recent experience appears to be a general mechanism for binding spatial, temporal and sensory information into high-order memory representations, including social memory.


Conflict of interest statement

COMPETING INTERESTS DECLARATION: The authors declare that they have no competing interests. Data and materials availability: all data needed to evaluate the conclusions in the paper are present in the paper and/or the supplementary materials. Data and analytical tools used in the paper will be made available upon request.

Figures

Extended Data Figure 1:
Extended Data Figure 1:. Behavioral features during social memory task.
a) Representative animal trajectories during the task show higher time spent around the novel animal (red) in the test (recall) trial. b) Example video frame showing pose estimation calculated with DeepLabCut (color markers). Interaction zones were defined as 10 cm by 10 cm squares in the two corners where the cups were located. c) Average speed of the animals was not different among trials (one-way ANOVA: F(2) = 0.92, P > 0.05). d) Average speed inside interaction zones around S1 (left plot), S2 or novel mouse (middle plot) did not differ among trials (one-way ANOVA: F(2) = 3.14, P > 0.05). Average speed did not differ outside interaction zones (one-way ANOVA: F(2) = 1.58, P > 0.05). e) Total time spent inside the interaction zone around S1, S2 or novel mouse (left plot). Total time interacting with novel mouse during recall trial was greater than with either familiar mouse in any other trial (P < 0.01 for novel versus S1 interaction during third trial and P < 0.05 for novel versus S1 interaction during all of the other trials, two-way ANOVA mouse × trial followed by Tukey post hoc test for multiple comparisons). Total time spent outside interaction zones (right plot) was not different between trials (one-way ANOVA: F(2) = 0.58, P > 0.05).
Extended Data Figure 2:
Extended Data Figure 2:. Multi-region electrophysiological recordings.
a) Representative histology showing electrode tracks spanning CA1, CA2 and CA3 areas, with optic fiber over CA2 pyramidal layer. Blue: DAPI staining. b) ChR2-GFP expression in CA2. Blue: DAPI; green: GFP; red: PCP4. c) Silicon probe with 100 μm optic fiber glued to one electrode shank mounted in a movable microdrive to allow for precise localization of the target area. d) Representative sample recordings of local field potentials (one trace per electrode) and single units (colored lines show spikes) in several regions of the hippocampus. Each column represents one electrode shank. Approximate location of pyramidal and granular layers is depicted in superimposed outline of hippocampus. e) Average firing responses of single cells from different regions aligned to SWRs detected in CA1. Note that CA2 cells fired before CA1 and CA3 and that a subpopulation of CA2 units (‘CA2 ramping’) became silent upon SWR onset. f) Same as in E but firing responses were aligned to ripples detected in CA2. Note that CA2 cells are strongly activated during CA2 ripples. These results replicate a previous report in rats.
Extended Data Figure 3.
Extended Data Figure 3.. Classification of single cell responses during social memory task.
a) Examples of simultaneously recorded place cells from CA1 and CA2 regions in one mouse. Each row shows firing map of one cell; firing maps for trial 1, trial 2 and the memory test session are displayed in each column. Colored circles represent different stimulus mice. b) Another example of simultaneously recorded place cells from CA2 and CA3 regions in a second mouse.
Extended Data Figure 4.
Extended Data Figure 4.. Classification of single cell responses during social memory task.
a) Unrotated correlation was computed as averaged pixel-wise correlation of the firing maps from trial 1 and 2 (top). Rotated correlation was calculated after rotating the map for trial 2 180 degrees (bottom). b) K-means clustering of unrotated and rotated spatial correlation values for all cells resulted in 5 clusters (different colors). One cluster (blue) had high unrotated and negative rotated correlations, termed “social-invariant” cells. Another cluster (red) had high rotated and negative unrotated correlation, termed “social-remapping” cells. The other clusters had more similar values for the two correlations. Squares denote CA1, circles CA2, and triangles CA3 pyramidal cells. c) Proportion of CA1, CA2 and CA3 cells from each of the 5 clusters color-coded as in b. d) Distribution of unrotated (empty) and rotated (filled) correlation values between trial 1 and trial 2 for cells in all 5 clusters. *** P < 0.001, rank-sum test. e) Distribution of unrotated (empty) and rotated (filled) correlation values between learning trial and recall for cells in all 5 clusters. *** P < 0.001, rank-sum test. Correlation performed between the recall trial and that learning trial in which the position of the familiar mouse was in the opposite location. f) Distance from the center of mass of the place field to the nearest cup for cells in all clusters (F(4,677) = 27.34, P < 4.6e-21, one-way ANOVA). Social-remapping cells had place fields closer to the cups (P < 0.002, Tuckey post-hoc test). g) Place field sizes for cells in all clusters were similar (F(4,677) = 0.39, P > 0.05, one-way ANOVA). h) Number of place fields per cell was similar for all clusters (F(4,677) = 0.68, P > 0.05, one-way ANOVA). i) fraction of social-remapping cells with place fields next to stimulus mouse 1 (S1), stimulus mouse 2 (S2) and other locations.
Extended Data Figure 5.
Extended Data Figure 5.. Place cell properties of social-invariant and social-remapping cells across regions during the social discrimination task.
a-e) Place cell properties for CA1, CA2 and CA3 social-invariant and social-remapping cells. a) Peak firing rate; b) place field size; c) spatial information in bits per spike; d) spatial selectivity index; e) number of place field per cell; f) Whole-session average firing rate for social-remapping and social-invariant cells from the different subregions. g) Fraction of cells with n=1 place fields, n=2 place fields and n>2 place fields in the different regions. h) Theta firing phase distribution (firing probability per bin of phases) for social-remapping, social-invariant and other cells from different regions. Rayleigh test was used against the null hypothesis (Methods). i) Mean vector length of celĺs firing during theta oscillations for CA1, CA2 and CA3 pyramidal cells. j) Average firing rate for CA1, CA2 and CA3 cells during immobility and running (velocity > 5 cm/s) periods during the task. */** P < 0.05/0.01, rank-sum test. k) Representative examples of CA1, CA2 and CA3 cell firing rate (distance from origin) as function of head direction. l) Distribution of P values shows similar lack of head direction tuning for social-remapping, social-invariant and other cells in CA1, CA2 and CA3 regions. Dashed line: P = 0.05. m) Proportion of social, social-invariant and social-remapping cells significantly modulated by head direction (P < 0.05) per region.
Extended Data Figure 6.
Extended Data Figure 6.. Object recognition task: single cell responses, optogenetic manipulations and reactivation properties per region.
a) Schema of the task. The same behavioral paradigm used to assess social memory was used to assess object recognition memory. Two novel objects were presented for 5 minutes in the first trial; the position of the objects was then swapped in a second trial of another 5 minutes. After a home cage period of 1 hour, the memory recall test trial was performed with one of the previous objects and one novel object. b) Discrimination index performance of animals in the test trial of the object recognition task for WT mice (DI was significantly greater than 0; P < 0.001, t-test; n=10 sessions in 4 animals), mice with CA2 silenced in trials 1 and 2 during time of interaction with object presented in recall trial (DI significantly greater than 0; P < 0.05, t-test; n=10 sessions in n=10 animals), and mice with CA1 silenced in trials 1 and 2 during interaction with object presented in recall trial (DI not significantly different from 0; P > 0.05, t-test; n=10 sessions in n=10 animals). c) Examples of firing maps for two CA2 cells in the object memory task. The first cell had a stable place field in the two learning and test trials, while the second one remapped to follow the position of one object. d) K-means clustering of unrotated and rotated spatial correlation values for all cells. The red cluster corresponds to a subset of cells (“object-remapping cells”) with high rotated and negative unrotated correlation, analogous to social-remapping cells. Squares denote CA1, circles CA2 and triangles CA3 pyramidal cells. e) Distribution of unrotated (empty) and rotated (filled) correlation values for the two clusters of cells in d). *** P < 0.001, rank-sum test. f) Proportion of CA1, CA2 and CA3 cells from each of the 2 clusters in d). g) Proportion of object-remapping and social-remapping cells in CA1, CA2 and CA3. ** P < 0.01, Fisher’s exact test.
Extended Data Figure 7:
Extended Data Figure 7:. Effect of optogenetic disruption of SWRs on firing rates and field potentials. Reactivation of hippocampal cells during SWRs.
a) Schematic of closed-loop SWR truncation system: two signals (for real positive events and noise) are extracted from the recording board and filtered in the ripple band (100–300 Hz); a waveform rectifier and a low pass filter are applied (CED 1401); upon a positive event detection (real positive event = 1 and noise = 0), two current sources are triggered and light is delivered bilaterally through the optic fibers connected to the animal. b) Estimation of detection performance. Left graph, a subsample of events detected by our on-line system in 3 sessions (n = 1000) were validated by ground truth (offline detected events); plot shows percentage of true positives versus false positives. Right graph, a subsample of true events (detected offline) in 3 sessions (n = 1000) were cross-validated with our online detector to quantify percent events detected (SWRs disrupted) and missed. c) CA1, CA2 and CA3 LFP patterns during CA2 SWR disruption. d) CA1, CA2 and CA3 average firing responses to normal and truncated SWRs show strong suppression of firing after light stimulation (blue bar) (n = 53, 148, 87 CA1, CA2, CA3 cells; p < 10−6, = 9.7×10⁻⁷, = 1.14×10⁻⁸, respectively sign-rank test). e) Firing of CA2 pyramidal cells was suppressed by brief yellow-light pulses (yellow rectangle) in Amigo2-Cre animals expressing AAV2/5 EF1a.DIO.eArch3.0-eYFP in CA2. Curves show mean and SEM (n = 58, p < 0.03, sign-rank test). f) Example session in which 30-s pulses of yellow light (yellow bars) were delivered once every two minutes to CA2 of Amigo2-Cre mice expressing Arch3.0. Blue trace is ripple-band (100–300 Hz) power in CA1 pyramidal layer and magenta traces shows detected SWRs. Note suppression of CA1 SWRs during illumination. g) Example session showing decreased CA2 SWR rate due to photoactivation of Arch3.0 (p < 0.0246, Wilcoxon rank sum test). Dashed line shows light stimulation and black and blue traces show SWR rate before and during period of photostimulation, respectively. h) Social memory recall was suppressed following CA2 silencing by yellow light pulses (30s, once every 2 min) during the post-sleep period in Amigo2-Cre mice injected with AAV-DIO-Arch3.0 (n=9; discrimination index not significantly different from 0; P > 0.05, t-test), whereas social memory was present in Cre- littermate controls injected with the same virus and receiving same light pulses (n=8; discrimination index differed significantly from 0; P < 0.01).
Extended Data Figure 8:
Extended Data Figure 8:. Reactivation of hippocampal cells during SWRs following social learning.
a) Example cell pair firing rate correlation matrices for pre-sleep, learning trials and post-sleep sessions. Bar, Color-coded r values. Note increase in post-sleep coactivation in some cell pairs that were coactive during the task (red arrow). b) (EV – REV) measure of post-sleep reactivation of correlated firing during learning trials in control sessions (no manipulation), sessions with optogenetic SWR disruption, and sessions with random optogenetic stimulation. Significant reactivation was observed in CA1 and CA2 control sessions (P = 0.03 and 0.0028, respectively, Wilcoxon rank sum test) or following random stimulation (P = 0.008 and 0.04 for CA1 and CA2, respectively, Wilcoxon rank sum test). There was no significant reactivation in CA1 or CA2 with SWR disruption. CA3 failed to show significant reactivation in any session (P > 0.05). c) Significant reactivation (EV– REV) was observed in CA1 and CA2 during entire slow-wave sleep period but not during REM sleep period (d). e) Explained variance and reversed explained variance for a subsample of approximately the same number of cells for different regions (CA1, n = 73; CA2, n =69; CA3, n = 67). f) Cells from CA1 and CA2 that contributed the most to the total explained variance (1st quartile) had a significantly higher rotated spatial correlation (e.g. social-remapping) than the rest of the cells (P = 0.0354 and P = 0.0223 for CA1 and CA2 respectively; p>0.05 for CA3, Wilcoxon signed rank test). g) Average peri-SWR firing rate responses for social-remapping and social-invariant cells from each region in pre- and post-sleep. Note that social-remapping cells show higher SWR firing rates in post-sleep but not pre-sleep sessions (CA1: n = 151, P = 0.0055; CA2: n = 306, P = 0.016; CA3: n = 79, P > 0.05).
Extended Data Figure 9:
Extended Data Figure 9:. Assembly activity strength during the social memory discrimination task.
a) Distribution of assembly social gain values from different regions. Assembly social gain defined as mean assembly strength during exploration within interaction zone divided by mean assembly strength during exploration outside interaction zone. Social gain was significantly greater than 1 for CA1 (P < 10−6, sign-rank test) and CA2 (P < 10−19) but not CA3 (P > 0.05). b) Left pair of bars: socially-related assembly strength = ([assembly strength inside social interaction zone minus strength outside social interaction zone]/[sum of strengths]) for social discriminant and non-discriminant assemblies (P < 10−3, rank-sum test). Right pair of bars: normalized social discrimination assembly strength (difference between assembly strength during interaction with preferred mouse minus the strength during the interaction with the other mouse divided by the sum of these two strengths) was greater for discriminant compared to non-discriminant assemblies (P < 10−8). c) Discriminant assemblies were reactivated during recall trial significantly more strongly than non-discriminant ones (P = 0.0421). Average peri-SWR activation of discriminant and non-discriminant assemblies in different hippocampal regions are shown in d) CA1: n = 116, P = 0.0252, e) CA2: n = 213, P =0.0144 and f) CA3: n = 59, P > 0.05.
Extended Data Figure 10:
Extended Data Figure 10:. Generation of CA2 ripple oscillations enhances social memory recall.
a) LFPs showing ripple activity in CA1 (red), CA2 (green) and CA3 (blue) in response to optogenetic triggering of ripple in CA2. b) Rate of ripples in sessions with optogenetic triggering of SWRs was significantly higher than in control sessions (P < 0.05, rank-sum test). c) Firing rates of all pyramidal cells during spontaneous versus optogenetically triggered CA2 ripples were highly correlated: CA1 (n = 67; r= 0.63, P < 10−13, Pearson’s correlation), CA2 (n = 147; r = 0.75, P < 3×10⁻²²) and CA3 (n = 40; r = 0.48, P = 0.01). d) Firing rate gain (increase firing rate during ripples divided by average firing rate) of pyramidal cells during spontaneous versus triggered ripples for CA1 (n = 67; r= 0.57, P < 10−6), CA2 (n = 147; r = 0.74, P < 3×10⁻³⁵) and CA3 (n = 40; r = 0.25, P > 0.05) e) Social discrimination index for Amigo2-Cre- littermate controls injected with Cre-dependent ChR2 AAV with (n = 6, P > 0.05) and without light stimulation did not differ (P > 0.05, n = 10). f) Effect of social gain on a neuron’s ripple participation gain (post-sleep participation minus pre-sleep participation divided by their sum). CA1 and CA2 cells showed greater ripple participation gain for cells with positive versus negative social gain for both spontaneous SWRs (CA1 and CA2: n = 67 and n = 147; P < 0.05 and P < 3.4×10⁻³, respectively) and triggered SWRs (CA1 and CA2: P < 0.05 and P < 2.8×10⁻³, respectively). CA3 ripple participation gain showed no effect of social gain for either type of SWR (n = 40; P > 0.05). g) Histology of CA3-implanted Grik-4 animals, previously injected with Cre-dependent AAV expressing ChR2-eYFP (green). h) Close-up view of the CA3 area. i) Example of spontaneous and optogenetically triggered ripples in CA3. White lines are LFP from CA2, color maps show wavelet spectrogram, dashed lines indicate period of illumination. j) LFPs showing ripple activity in CA1 (red) and CA3 (blue) but not CA2 (green) after optogenetic triggering of ripples in CA3. k) Rate of events in sessions with CA3 triggered ripples was significantly higher than in non-stimulated sessions (P < 0.003), with no significant difference compared to rate of ripples in response to CA2 triggered ripples (P > 0.05). l) Participation probability (fraction of ripples in which a neuron fires at least one spike) of all pyramidal cells during spontaneous versus triggered CA2 ripples were highly correlated: CA1 (n = 96; r = 0.66, P < 7×10⁻¹⁰, Pearson’s correlation), CA2 (n = 67; r = 0.34, P < 3×10⁻²²) and CA3 (n = 112; r = 0.67, P = 3×10⁻¹⁵). m) A similar result was obtained comparing firing rates (r= 0.59, 0.49, 0.66; P < 2×10⁻⁷; 1.7 × 10⁻⁵; 8×10⁻¹⁰; for CA1, CA2 and CA3, respectively) or firing rate gain. n) (r = 0.63, 0.47, 0.71; P < 1.6×10⁻¹², 2.1×10⁻³, 1.7×10⁻¹⁸).
Figure 1:
Figure 1:. Encoding of conspecifics by CA2 pyramidal cell activity.
a) Schema of the task. b) Social memory in wild-type mice during recall trial quantified by discrimination index (DI, see Methods; n = 13). ***P < 0.0001, Wilcoxon sign-rank test. c) Histological verification of probe location in CA1, CA2 and CA3 regions. Blue, DAPI staining; green, GFP; red, PCP4 immunolabeling of CA2 pyramidal cells. d) Example firing maps of social-invariant and social-remapping CA2 place cells. e) Pearson’s correlation values for unrotated (std.) and rotated (rot.) place fields in trials 1 and 2 for social-invariant (blue; n = 203 from 13 mice; P < 10−54, sign-rank test) and social-remapping (red; n=120 from 13 mice; P < 10−16) cells. f) Social-remapping cells had place fields closer to the location of the stimulus mice than social-invariant cells (P < 10−10, rank-sum test). g) Proportion of social-invariant and social-remapping cells per region. Social-remapping cells were more abundant in CA2 than CA1 (P < 0.05, Fisher’s test) or CA3 (P < 0.05). CA1: 55 social-invariant and 14 social-remapping cells; CA2: 131 spatial and 101 social-remapping cells; CA3: 17 social-invariant and 5 social-remapping cells. h) eArch3.0-GFP expression (green) in CA2 pyramidal cells of an Amigo2-Cre mouse (top) and in CA1 cells of an Lypd1-Cre mouse (bottom). Blue, DAPI. i) Yellow light activated eArch3.0 during exploration of either S1 or S2 during trials 1 and 2. j) Social memory recall was present in control mice (Cre+ and Cre- animals with virus and no light stimulation; DI significantly >0; P < 0.001, t-test). Silencing of CA2 around a given stimulus mouse during learning trials (CA2 silenced stim. group) abolished memory of that mouse in recall trial (DI not significantly>0; n =10 mice; P > 0.05, t-test) but did not alter social memory for the stimulus mouse around which light was not applied (CA2 unsilenced stim group; DI significantly > 0; n =11 mice, P < 0.001, t-test); CA1 silencing had no effect (DI significantly >0; n = 10; P < 0.001, t-test). Multiple comparison test and Tukey post hoc tests between the groups revealed that the CA2-silenced stim. group was significantly different than the wild-type group (P < 0.001), CA1-silenced group (P < 0.001) and CA2-unsilenced stim group (P < 0.01).
Figure 2:
Figure 2:. Effect of sharp-wave ripple disruption on social memory consolidation.
a) SWR rate in CA2 increased during post-sleep session following social learning trials compared to pre-sleep sessions (n = 17 mice; P = 0.007, rank-sum test). b) Schematic of SWR disruption during sleep consolidation periods. c) SWR disruption using strong activation of ChR2 with 10-ms high-intensity blue light pulses upon real-time detection of ripples in CA2. Examples of closed-loop ripple truncation and random delay stimulation. Traces show LFPs from CA2 pyramidal layer (top) and raster plot firing of CA2 units (bottom). Vertical scale, 0.2 mV; horizontal scale, 20 ms. d) Average firing rate of pyramidal cells decreased during truncated compared to normal SWRs (P < 10−4, rank-sum test; n = 7). e) Social memory recall was impaired following CA2 ripple disruption (P > 0.05, n = 7 mice) but preserved following random stimulation (P = 0.002, n = 7).
Figure 3:
Figure 3:. Reactivation during sleep of cell ensembles active during prior social learning.
a) Pearson’s correlation coefficients for all pairs of neurons measured during pre-sleep (left) or post-sleep (right) versus correlations measured during social learning trials. Lines show least-square linear fits for pre-sleep (R = 0.165, 0.189 and 0.213 and P = 0.031, 0.029 and 0.035 for CA1, CA2 and CA3, respectively) and post-sleep (R = 0.231, 0.223 and 0.211 and P = 0.034, 0.035 and 0.035 for CA1, CA2 and CA3, respectively). Note increase in correlation in post-sleep (P < 0.0001 for CA1, CA2 and CA3 groups, Wilcoxon sign-rank test). b) EV (see Methods) was significantly higher than REV (chance) for CA2 (P = 0.0028, n = 13 mice) and CA1 (P = 0.03, n = 13 mice) cells but not CA3 (P > 0.05, n = 7 mice). c) EV for social-remapping versus social-invariant cells in each area (P < 0.05 for CA2, sign-rank test). d) Example of assembly detection. Each line of raster plot shows firing of one unit; units in example assembly are colored. Bottom trace, activation strength for example assembly. e) Social-related assembly strength (see Methods; [assembly strength inside minus strength outside social interaction zones]/[sum of strengths]) was significantly greater than 0 in CA1 (P < 10−6, sign-rank test) and CA2 (P < 10−19) but not CA3 (P > 0.05). + Outliers. f) Activation of social discriminant assemblies: those that are stronger around one mouse versus the other. Examples of one CA2 assembly (yellow line) more active around mouse S1 than S2 (grey and green bars, respectively) and a second (blue line) more active around mouse S2. g) Fraction of social discriminant assemblies in each region (P < 0.0034 and 10−4 for CA2 versus CA1 and CA3, respectively, Fisher’s test). h) Assembly reactivation strength during post-sleep sessions (see Methods) was higher for discriminant compared to non-discriminant assemblies in CA1 (P = 0.043, rank-sum test) and CA2 (P = 0.0032) but not CA3 (P = 0.6837).
Figure 4:
Figure 4:. Effect of optogenetic generation of ripples on social memory recall.
a) Social memory recall was normally absent 24 h after social learning (n = 7 mice; P > 0.05, sign-rank test). b) Weak ChR2 activation in CA2 neurons of Amigo2-Cre mice with low intensity blue light pulses was used to trigger ripples in CA2 during the first 2 h of post-sleep session. c) Example of spontaneous and triggered CA2 ripples and spiking from same animal. White lines show CA2 LFPs, color maps show wavelet spectrogram, blue shape indicates light stimulus. The firing of each unit is color-coded in the raster plots. d) Correlation of probability of participation (see Methods) in spontaneous versus triggered CA2 ripples for CA1 (n = 67; r= 0.56, P < 10−3), CA2 (n= 147; r = 0.66, P < 10−25) and CA3 (n = 40; r = 0.26, P > 0.05) pyramidal cells. e) Social memory after 24 h in mice receiving blue light pulses for controls (Cre- littermates; P > 0.05, sign-rank test, n = 6 mice), Amigo2-Cre mice expressing ChR2 in CA2 (P < 0.00023, n = 6 mice), and Grik4-Cre mice expressing ChR2 in CA3 (P > 0.05, n = 6 mice). f) Ripple reactivation gain (see Methods) for both spontaneous and triggered SWRs was greater for cells with positive versus negative social gain in CA1 (P < 0.05, n=67) and CA2 (P < 0.003, n=147) but not CA3 (P > 0.05, n=40).

References

    1. Wilson MA & McNaughton BL Reactivation of hippocampal ensemble memories during sleep. Science 265:676–679 (1994). - PubMed
    1. Karlsson MP & Frank LM Awake replay of remote experience in the hippocampus. Nat. Neurosci 12, 913–8 (2009). - PMC - PubMed
    1. Girardeau G, Benchenane K, Wiener SI, Buzsaki G & Zugaro MB Selective suppression of hippocampal ripples impairs spatial memory. Nat. Neurosci 12:1222–1223 (2009). - PubMed
    1. Dupret D, O’Neill J, Pleydell-Bouverie B & Csicsvari J The reorganization and reactivation of hippocampal maps predict spatial memory performance. Nat. Neurosci 13, 995–1002 (2010). - PMC - PubMed
    1. Ego-Stengel V & Wilson MA. Disruption of ripple-associated hippocampal activity during rest impairs spatial learning in the rat. Hippocampus 20(1),1–10 (2010). - PMC - PubMed

Publication types