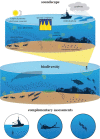
Listening forward: approaching marine biodiversity assessments using acoustic methods
- PMID: 32968541
- PMCID: PMC7481698
- DOI: 10.1098/rsos.201287
Listening forward: approaching marine biodiversity assessments using acoustic methods
Abstract
Ecosystems and the communities they support are changing at alarmingly rapid rates. Tracking species diversity is vital to managing these stressed habitats. Yet, quantifying and monitoring biodiversity is often challenging, especially in ocean habitats. Given that many animals make sounds, these cues travel efficiently under water, and emerging technologies are increasingly cost-effective, passive acoustics (a long-standing ocean observation method) is now a potential means of quantifying and monitoring marine biodiversity. Properly applying acoustics for biodiversity assessments is vital. Our goal here is to provide a timely consideration of emerging methods using passive acoustics to measure marine biodiversity. We provide a summary of the brief history of using passive acoustics to assess marine biodiversity and community structure, a critical assessment of the challenges faced, and outline recommended practices and considerations for acoustic biodiversity measurements. We focused on temperate and tropical seas, where much of the acoustic biodiversity work has been conducted. Overall, we suggest a cautious approach to applying current acoustic indices to assess marine biodiversity. Key needs are preliminary data and sampling sufficiently to capture the patterns and variability of a habitat. Yet with new analytical tools including source separation and supervised machine learning, there is substantial promise in marine acoustic diversity assessment methods.
Keywords: bioacoustics; ecosystem health; richness; soundscape.
© 2020 The Authors.
Conflict of interest statement
We declare we have no competing interests.
Figures


Similar articles
-
Efficacy of extracting indices from large-scale acoustic recordings to monitor biodiversity.Conserv Biol. 2018 Oct;32(5):1174-1184. doi: 10.1111/cobi.13119. Epub 2018 Aug 1. Conserv Biol. 2018. PMID: 29676813 Review.
-
Acoustic fish community in the Madeira Archipelago (North Atlantic Ocean): Characterization of sound diversity and daily patterns.Mar Environ Res. 2024 Jul;199:106600. doi: 10.1016/j.marenvres.2024.106600. Epub 2024 Jun 8. Mar Environ Res. 2024. PMID: 38875901
-
Acoustic indices as proxies for biodiversity: a meta-analysis.Biol Rev Camb Philos Soc. 2022 Dec;97(6):2209-2236. doi: 10.1111/brv.12890. Epub 2022 Aug 17. Biol Rev Camb Philos Soc. 2022. PMID: 35978471 Free PMC article. Review.
-
Toward a decade of ocean science for sustainable development through acoustic animal tracking.Glob Chang Biol. 2022 Oct;28(19):5630-5653. doi: 10.1111/gcb.16343. Epub 2022 Aug 5. Glob Chang Biol. 2022. PMID: 35929978 Free PMC article. Review.
-
Soundscape analysis using eco-acoustic indices for the birds biodiversity assessment in urban parks (case study: Isfahan City, Iran).Environ Monit Assess. 2023 May 2;195(6):629. doi: 10.1007/s10661-023-11237-2. Environ Monit Assess. 2023. PMID: 37127732
Cited by
-
Sensing ecosystem dynamics via audio source separation: A case study of marine soundscapes off northeastern Taiwan.PLoS Comput Biol. 2021 Feb 18;17(2):e1008698. doi: 10.1371/journal.pcbi.1008698. eCollection 2021 Feb. PLoS Comput Biol. 2021. PMID: 33600436 Free PMC article.
-
Invertebrate sounds from photic to mesophotic coral reefs reveal vertical stratification and diel diversity.Oecologia. 2024 Jun;205(2):307-322. doi: 10.1007/s00442-024-05572-5. Epub 2024 Jun 3. Oecologia. 2024. PMID: 38829404
-
Unlocking the soundscape of coral reefs with artificial intelligence: pretrained networks and unsupervised learning win out.PLoS Comput Biol. 2025 Apr 28;21(4):e1013029. doi: 10.1371/journal.pcbi.1013029. eCollection 2025 Apr. PLoS Comput Biol. 2025. PMID: 40294093 Free PMC article.
-
Distribution and Seasonality of the Omura's Whale (Balaenoptera omurai) in Australia Based on Passive Acoustic Recordings.Animals (Basel). 2024 Oct 12;14(20):2944. doi: 10.3390/ani14202944. Animals (Basel). 2024. PMID: 39457874 Free PMC article.
-
Toward a New Era of Coral Reef Monitoring.Environ Sci Technol. 2023 Apr 4;57(13):5117-5124. doi: 10.1021/acs.est.2c05369. Epub 2023 Mar 17. Environ Sci Technol. 2023. PMID: 36930700 Free PMC article. Review.
References
-
- Ponder WF, Carter G, Flemons P, Chapman R. 2001. Evaluation of museum collection data for use in biodiversity assessment. Conserv. Biol. 15, 648–657. (10.1046/j.1523-1739.2001.015003648.x) - DOI
Publication types
Associated data
LinkOut - more resources
Full Text Sources

