

Carotid plaque imaging and the risk of atherosclerotic cardiovascular disease
- PMID: 32968660
- PMCID: PMC7487384
- DOI: 10.21037/cdt.2020.03.10
Carotid plaque imaging and the risk of atherosclerotic cardiovascular disease
Abstract
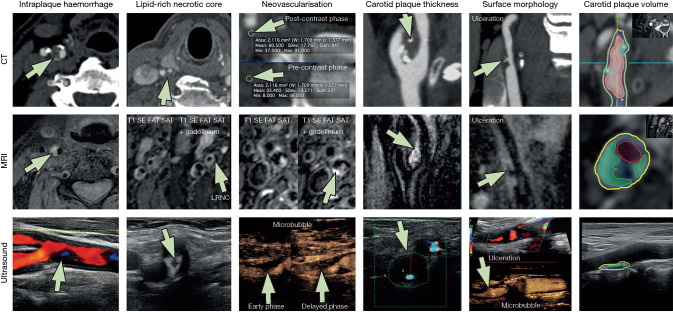
Carotid artery plaque is a measure of atherosclerosis and is associated with future risk of atherosclerotic cardiovascular disease (ASCVD), which encompasses coronary, cerebrovascular, and peripheral arterial diseases. With advanced imaging techniques, computerized tomography (CT) and magnetic resonance imaging (MRI) have shown their potential superiority to routine ultrasound to detect features of carotid plaque vulnerability, such as intraplaque hemorrhage (IPH), lipid-rich necrotic core (LRNC), fibrous cap (FC), and calcification. The correlation between imaging features and histological changes of carotid plaques has been investigated. Imaging of carotid features has been used to predict the risk of cardiovascular events. Other techniques such as nuclear imaging and intra-vascular ultrasound (IVUS) have also been proposed to better understand the vulnerable carotid plaque features. In this article, we review the studies of imaging specific carotid plaque components and their correlation with risk scores.
Keywords: Radiology; atherosclerotic cardiovascular disease (ASCVD); carotid plaque; risk score.
2020 Cardiovascular Diagnosis and Therapy. All rights reserved.
Conflict of interest statement
Conflicts of Interest: All authors have completed the ICMJE uniform disclosure form (available at http://dx.doi.org/10.21037/cdt.2020.03.10). The series “Advanced Imaging in The Diagnosis of Cardiovascular Diseases” was commissioned by the editorial office without any funding or sponsorship. LS served as the unpaid Guest Editor of the series and serves as an unpaid editorial board member of Cardiovascular Diagnosis and Therapy from July 2019 to June 2021. DF reports grants from Siemens, other from IschemaView Inc., other from Segmed Inc., grants from American Heart Association, grants from NIH, outside the submitted work. MW reports personal fees from Magnetic Insight, Subtle Medical, NOUS, Icometrix, outside the submitted work. The authors have no other conflicts of interest to declare.
Figures
Similar articles
-
Contemporary carotid imaging: from degree of stenosis to plaque vulnerability.J Neurosurg. 2016 Jan;124(1):27-42. doi: 10.3171/2015.1.JNS142452. Epub 2015 Jul 31. J Neurosurg. 2016. PMID: 26230478 Review.
-
MR imaging of vulnerable carotid plaque.Cardiovasc Diagn Ther. 2020 Aug;10(4):1019-1031. doi: 10.21037/cdt.2020.03.12. Cardiovasc Diagn Ther. 2020. PMID: 32968658 Free PMC article. Review.
-
Correlation Between Calcification Characteristics of Carotid Atherosclerotic Plaque and Plaque Vulnerability.Ther Clin Risk Manag. 2021 Jul 1;17:679-690. doi: 10.2147/TCRM.S303485. eCollection 2021. Ther Clin Risk Manag. 2021. PMID: 34234444 Free PMC article.
-
Imaging Approaches to the Diagnosis of Vascular Diseases.Curr Atheroscler Rep. 2022 Feb;24(2):85-96. doi: 10.1007/s11883-022-00988-x. Epub 2022 Jan 26. Curr Atheroscler Rep. 2022. PMID: 35080717 Free PMC article. Review.
-
Plaque vulnerability in patients with high- and moderate-grade carotid stenosis - comparison of plaque features on MRI with histopathological findings.Swiss Med Wkly. 2020 Feb 17;150:w20174. doi: 10.4414/smw.2020.20174. eCollection 2020 Feb 10. Swiss Med Wkly. 2020. PMID: 32065837
Cited by
-
Imaging High-Risk Atherothrombosis Using a Novel Fibrin-Binding Positron Emission Tomography Probe.Stroke. 2022 Feb;53(2):595-604. doi: 10.1161/STROKEAHA.121.035638. Epub 2021 Dec 30. Stroke. 2022. PMID: 34965737 Free PMC article.
-
Carotid Intraplaque Neovascularization and Future Vascular Events in Patients With Asymptomatic Carotid Stenosis.Front Pharmacol. 2022 Feb 22;13:804810. doi: 10.3389/fphar.2022.804810. eCollection 2022. Front Pharmacol. 2022. PMID: 35273496 Free PMC article.
-
Extracranial carotid artery atherosclerotic plaque and APOE polymorphisms: a systematic review and meta-analysis.Front Cardiovasc Med. 2023 Nov 13;10:1155916. doi: 10.3389/fcvm.2023.1155916. eCollection 2023. Front Cardiovasc Med. 2023. PMID: 38034385 Free PMC article.
-
Identification of Biomarkers of Autophagy-Related Genes Between Early and Advanced Carotid Atherosclerosis.Int J Gen Med. 2022 May 31;15:5321-5334. doi: 10.2147/IJGM.S350232. eCollection 2022. Int J Gen Med. 2022. PMID: 35669594 Free PMC article.
-
Targeting Peptide, Fluorescent Reagent Modified Magnetic Liposomes Coated with Rapamycin Target Early Atherosclerotic Plaque and Therapy.Pharmaceutics. 2022 May 18;14(5):1083. doi: 10.3390/pharmaceutics14051083. Pharmaceutics. 2022. PMID: 35631669 Free PMC article.
References
Publication types
Grants and funding
LinkOut - more resources
Full Text Sources
Miscellaneous