

Carbonic anhydrases enhance activity of endogenous Na-H exchangers and not the electrogenic Na/HCO3 cotransporter NBCe1-A, expressed in Xenopus oocytes
- PMID: 32969493
- PMCID: PMC7747792
- DOI: 10.1113/JP280143
Carbonic anhydrases enhance activity of endogenous Na-H exchangers and not the electrogenic Na/HCO3 cotransporter NBCe1-A, expressed in Xenopus oocytes
Abstract
Key points: According to the metabolon hypothesis, direct association of cytosolic carbonic anhydrases (CAs) with the electrogenic Na/HCO3 cotransporter NBCe1-A speeds transport by regenerating/consuming . The present work addresses published discrepancies as to whether cytosolic CAs stimulate NBCe1-A, heterologously expressed in Xenopus oocytes. We confirm the essential elements of the previous experimental observations, taken as support for the metabolon hypothesis. However, using our own experimental protocols or those of others, we find that NBCe1-A function is unaffected by cytosolic CAs. Previous conclusions that cytosolic CAs do stimulate NBCe1-A can be explained by an unanticipated stimulatory effect of the CAs on an endogenous Na-H exchanger. Theoretical analyses show that, although CAs could stimulate non- transporters (e.g. Na-H exchangers) by accelerating CO2 / -mediated buffering of acid-base equivalents, they could not appreciably affect transport rates of NBCe1 or other transporters carrying , , or ion pairs.
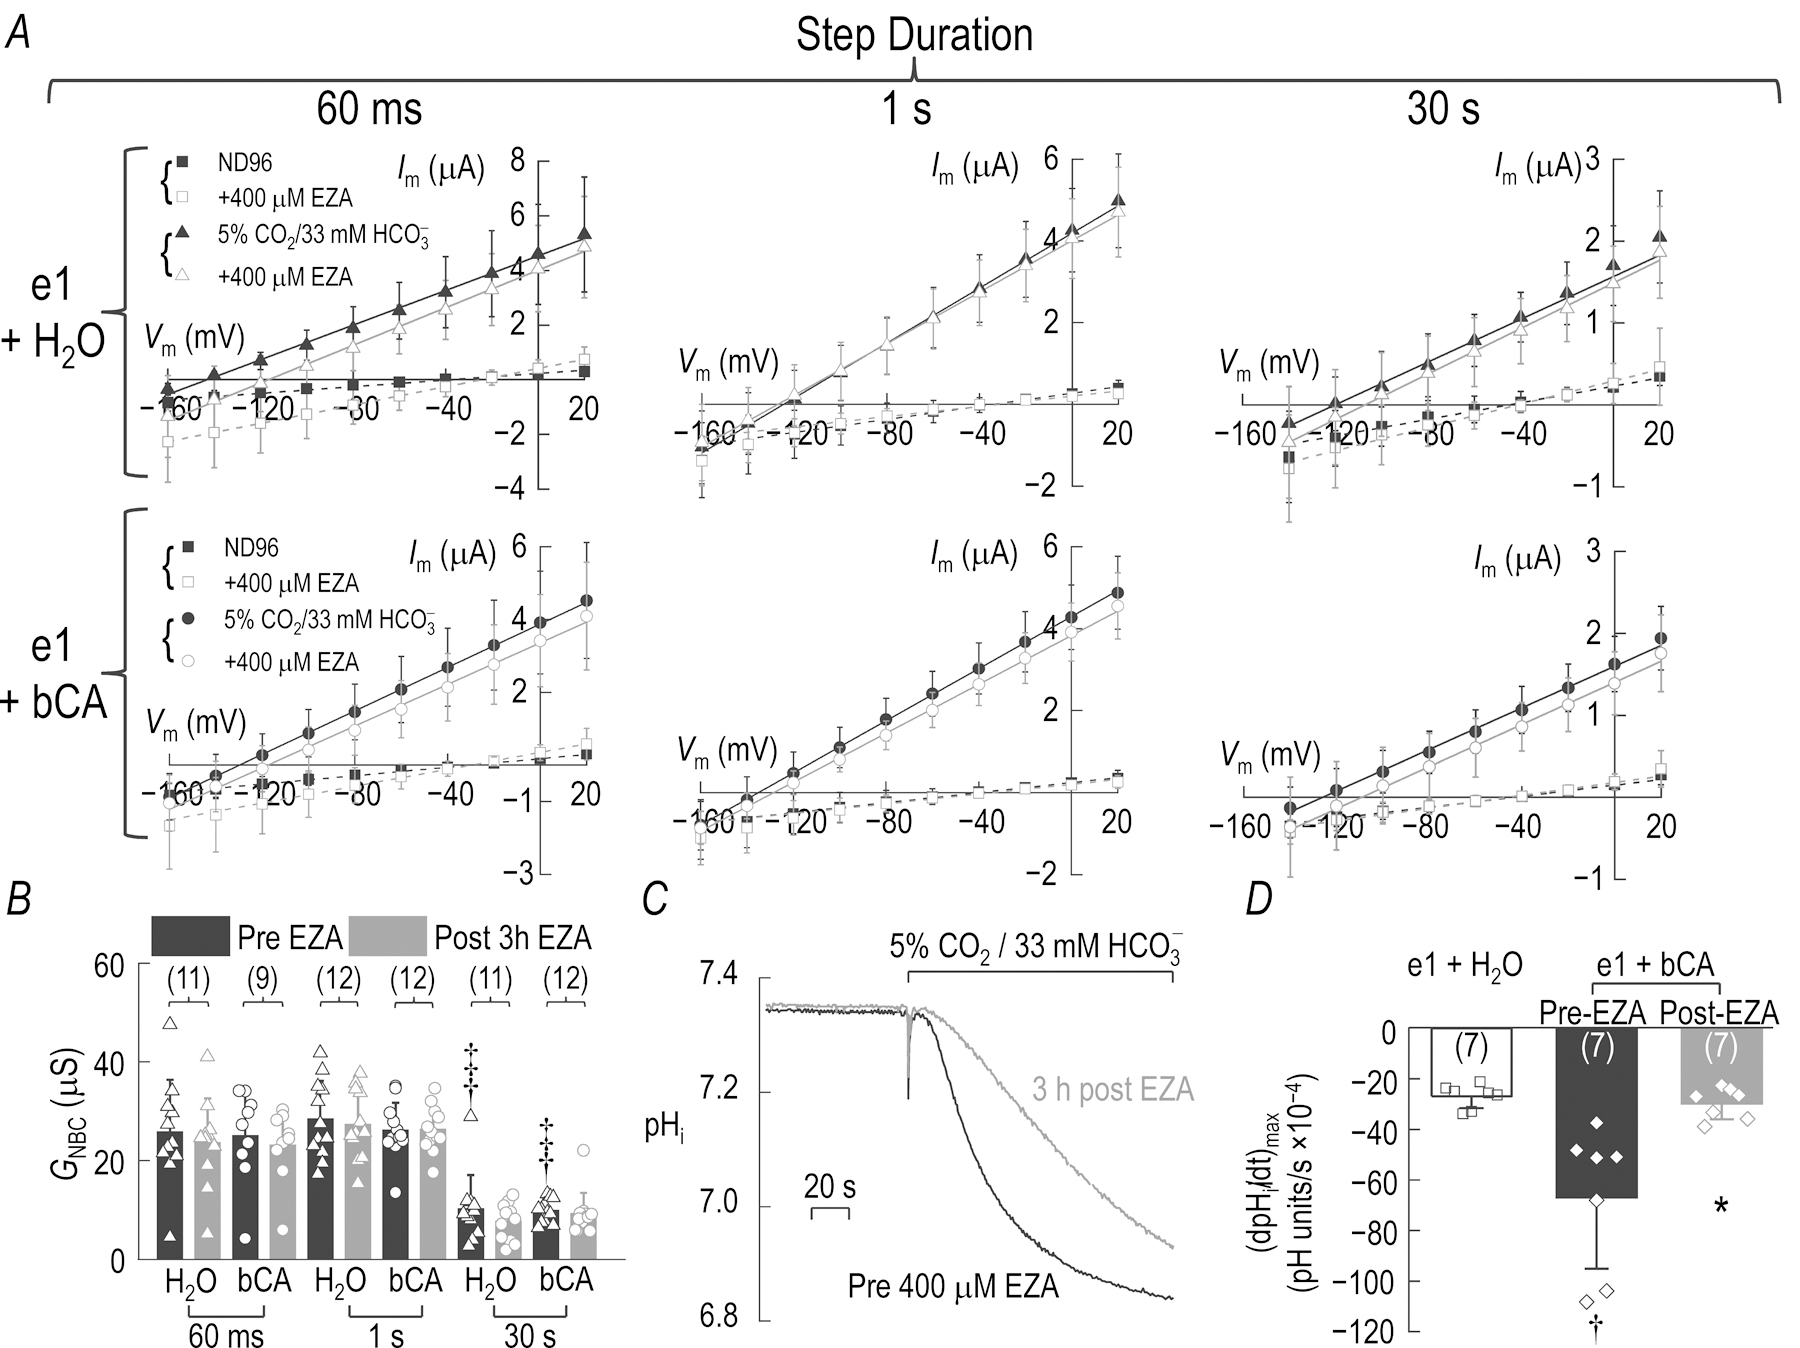
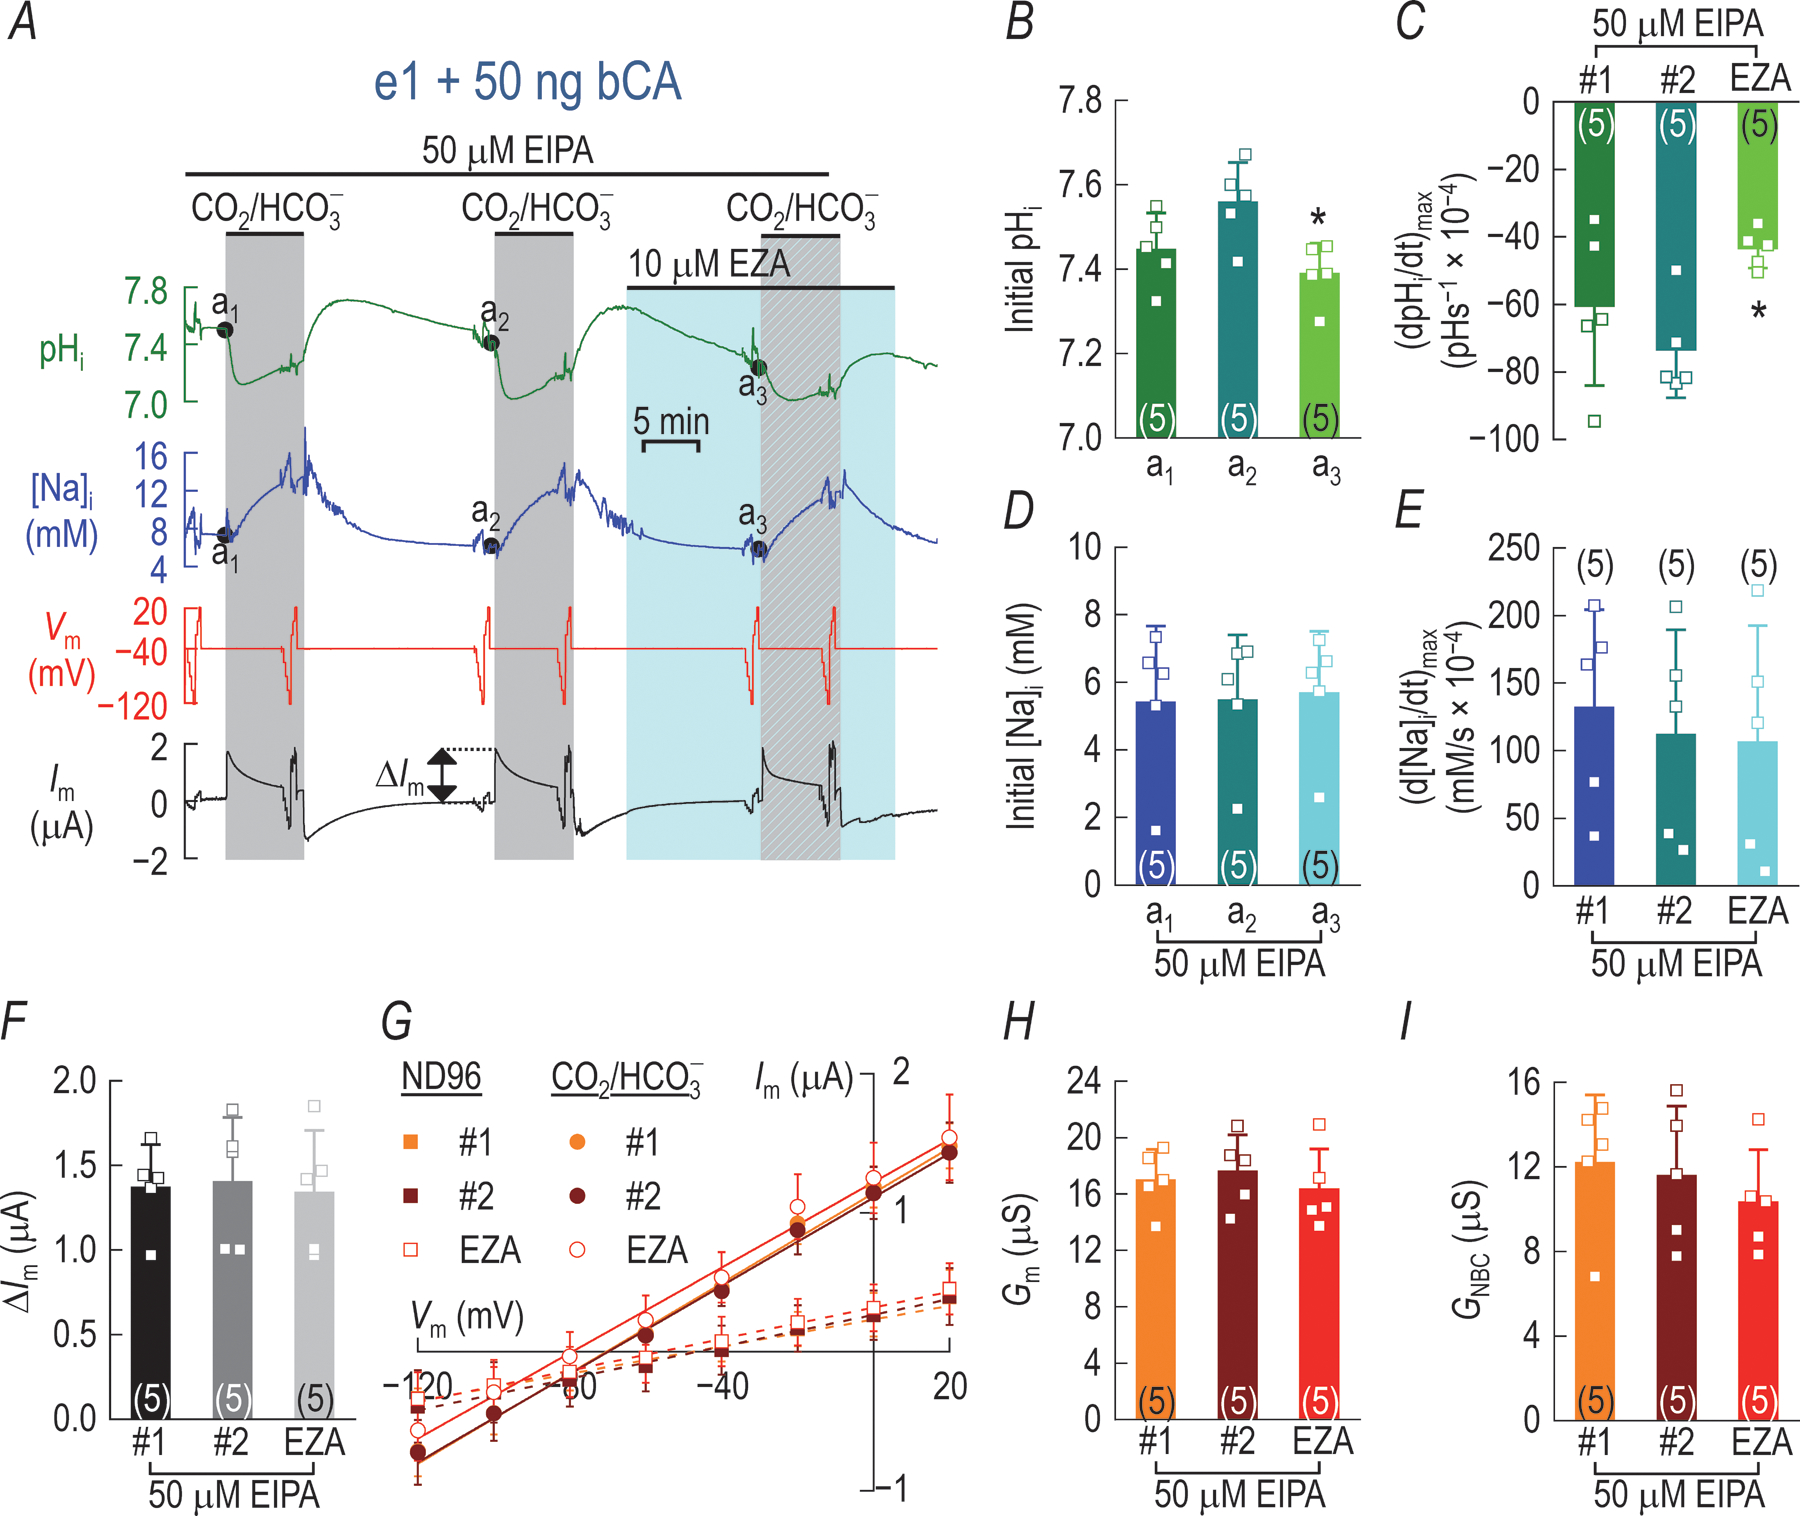
Abstract: The metabolon hypothesis predicts that cytosolic carbonic anhydrase (CA) binds to NBCe1-A, promotes replenishment/consumption, and enhances transport. Using a short step-duration current-voltage (I-V) protocol with Xenopus oocytes expressing eGFP-tagged NBCe1-A, our group reported that neither injecting human CA II (hCA II) nor fusing hCA II to the NBCe1-A carboxy terminus affects background-subtracted NBCe1 slope conductance (GNBC ), which is a direct measure of NBCe1-A activity. Others - using bovine CA (bCA), untagged NBCe1-A, and protocols keeping holding potential (Vh ) far from NBCe1-A's reversal potential (Erev ) for prolonged periods - found that bCA increases total membrane current (ΔIm ), which apparently supports the metabolon hypothesis. We systematically investigated differences in the two protocols. In oocytes expressing untagged NBCe1-A, injected with bCA and clamped to -40 mV, CO2 / exposures markedly decrease Erev , producing large transient outward currents persisting for >10 min and rapid increases in [Na+ ]i . Although the CA inhibitor ethoxzolamide (EZA) reduces both ΔIm and d[Na+ ]i /dt, it does not reduce GNBC . In oocytes not expressing NBCe1-A, CO2 / triggers rapid increases in [Na+ ]i that both hCA II and bCA enhance in concentration-dependent manners. These d[Na+ ]i /dt increases are inhibited by EZA and blocked by EIPA, a Na-H exchanger (NHE) inhibitor. In oocytes expressing untagged NBCe1-A and injected with bCA, EIPA abolishes the EZA-dependent decreases in ΔIm and d[Na+ ]i /dt. Thus, CAs/EZA produce their ΔIm and d[Na+ ]i /dt effects not through NBCe1-A, but endogenous NHEs. Theoretical considerations argue against a CA stimulation of transport, supporting the conclusion that an NBCe1-A- metabolon does not exist in oocytes.
Keywords: NBCe1-A; NHE; SLC4A4; bicarbonate; carbonic anhydrase; metabolon.
© 2020 The Authors. The Journal of Physiology © 2020 The Physiological Society.
Conflict of interest statement
Competing interests
All authors declare no conflict of interests.
Figures


Comment in
-
The devil is in the C-tail: a NBCe1-carbonic anhydrase bicarbonate transport metabolon?J Physiol. 2020 Dec;598(24):5595-5596. doi: 10.1113/JP280778. Epub 2020 Oct 20. J Physiol. 2020. PMID: 33043431 No abstract available.
Similar articles
-
Effect of human carbonic anhydrase II on the activity of the human electrogenic Na/HCO3 cotransporter NBCe1-A in Xenopus oocytes.J Biol Chem. 2006 Jul 14;281(28):19241-50. doi: 10.1074/jbc.M602181200. Epub 2006 May 10. J Biol Chem. 2006. PMID: 16687407
-
Reversed electrogenic sodium bicarbonate cotransporter 1 is the major acid loader during recovery from cytosolic alkalosis in mouse cortical astrocytes.J Physiol. 2015 Aug 15;593(16):3533-47. doi: 10.1113/JP270086. Epub 2015 Jun 25. J Physiol. 2015. PMID: 25990710 Free PMC article.
-
Carbonic anhydrase II increases the activity of the human electrogenic Na+/HCO3- cotransporter.J Biol Chem. 2007 May 4;282(18):13508-21. doi: 10.1074/jbc.M700066200. Epub 2007 Mar 12. J Biol Chem. 2007. PMID: 17353189
-
The electrogenic Na/HCO3 cotransporter.Wien Klin Wochenschr. 1997 Jun 27;109(12-13):445-56. Wien Klin Wochenschr. 1997. PMID: 9261985 Review.
-
The renal electrogenic Na+:HCO-3 cotransporter.J Exp Biol. 1997 Jan;200(Pt 2):263-8. doi: 10.1242/jeb.200.2.263. J Exp Biol. 1997. PMID: 9050234 Review.
Cited by
-
The role of Na+-coupled bicarbonate transporters (NCBT) in health and disease.Pflugers Arch. 2024 Apr;476(4):479-503. doi: 10.1007/s00424-024-02937-w. Epub 2024 Mar 27. Pflugers Arch. 2024. PMID: 38536494 Free PMC article. Review.
-
Carbon dioxide transport across membranes.Interface Focus. 2021 Apr 6;11(2):20200090. doi: 10.1098/rsfs.2020.0090. Epub 2021 Feb 12. Interface Focus. 2021. PMID: 33633837 Free PMC article. Review.
-
Loss of luminal carbonic anhydrase XIV results in decreased biliary bicarbonate output, liver fibrosis, and cholangiocyte proliferation in mice.Pflugers Arch. 2022 May;474(5):529-539. doi: 10.1007/s00424-021-02659-3. Epub 2022 Feb 4. Pflugers Arch. 2022. PMID: 35119514 Free PMC article.
-
Proton Transport in Cancer Cells: The Role of Carbonic Anhydrases.Int J Mol Sci. 2021 Mar 20;22(6):3171. doi: 10.3390/ijms22063171. Int J Mol Sci. 2021. PMID: 33804674 Free PMC article. Review.
-
Who's on first … Na+ , HCO3- or CO32- ?J Physiol. 2022 Jul;600(13):3005-3006. doi: 10.1113/JP282945. Epub 2022 May 31. J Physiol. 2022. PMID: 35593728 Free PMC article. No abstract available.
References
-
- Adelroth P & Brzezinski P (2004). Surface-mediated proton-transfer reactions in membrane-bound proteins. Biochim Biophys Acta 1655, 102–115. - PubMed
-
- Becker HM & Deitmer JW (2007). Carbonic anhydrase II increases the activity of the human electrogenic Na+/HCO3− cotransporter. J Biol Chem 282, 13508–13521. - PubMed
-
- Becker HM, Hirnet D, Fecher-Trost C, Sültemeyer D & Deitmer JW (2005). Transport activity of MCT1 expressed in Xenopus oocytes is increased by interaction with carbonic anhydrase. J Biol Chem 280, 39882–39889. - PubMed
Publication types
MeSH terms
Substances
Grants and funding
LinkOut - more resources
Full Text Sources