. 2020 Oct;77(10):379-398.
doi: 10.1002/cm.21633. Epub 2020 Oct 8.

FLN-1/filamin is required to anchor the actomyosin cytoskeleton and for global organization of sub-cellular organelles in a contractile tissue

Affiliations

FLN-1/filamin is required to anchor the actomyosin cytoskeleton and for global organization of sub-cellular organelles in a contractile tissue

Charlotte A Kelley et al. Cytoskeleton (Hoboken). 2020 Oct.

Abstract

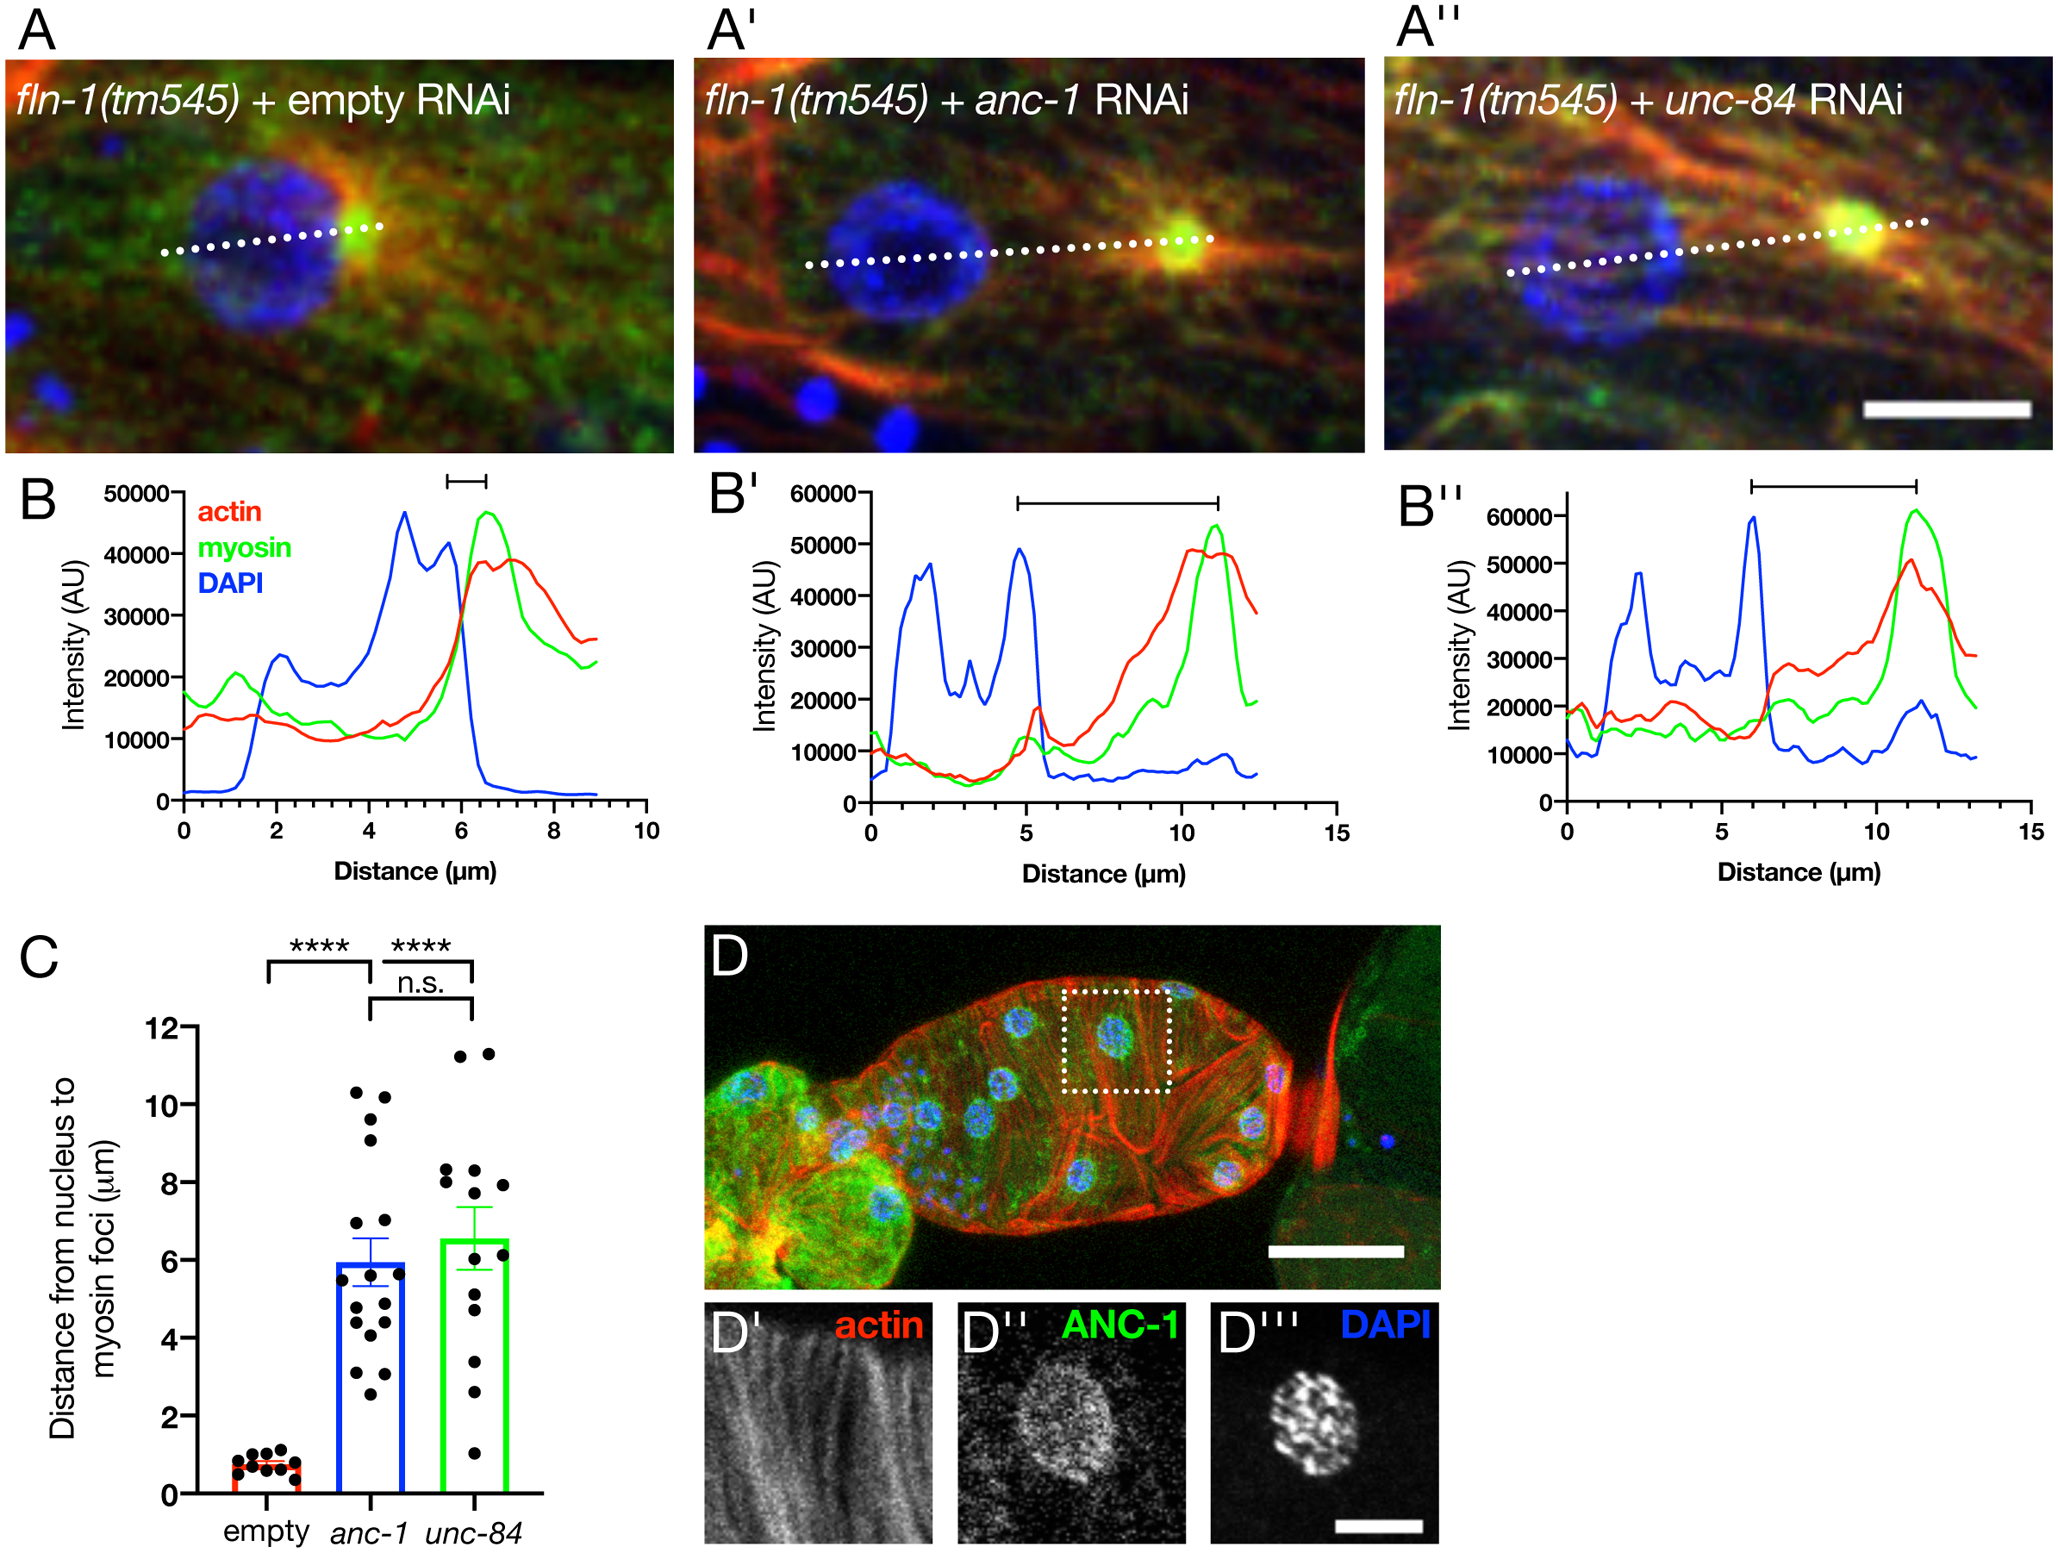
Actomyosin networks are organized in space, direction, size, and connectivity to produce coordinated contractions across cells. We use the C. elegans spermatheca, a tube composed of contractile myoepithelial cells, to study how actomyosin structures are organized. FLN-1/filamin is required for the formation and stabilization of a regular array of parallel, contractile, actomyosin fibers in this tissue. Loss of fln-1 results in the detachment of actin fibers from the basal surface, which then accumulate along the cell junctions and are stabilized by spectrin. In addition, actin and myosin are captured at the nucleus by the linker of nucleoskeleton and cytoskeleton complex (LINC) complex, where they form large foci. Nuclear positioning and morphology, distribution of the endoplasmic reticulum and the mitochondrial network are also disrupted. These results demonstrate that filamin is required to prevent large actin bundle formation and detachment, to prevent excess nuclear localization of actin and myosin, and to ensure correct positioning of organelles.

Keywords: C. elegans; LINC complex; actin; cytoskeleton; filamin; myosin.


Figures

Figure 1:
Figure 1:. FLN-1 is required for the development of an organized actin network in the spermatheca
(A) Maximum intensity projections of phalloidin staining. which labels the adult wild type spermathecal actin network. The actin is organized into long parallel bundles spanning the length of the cell and oriented along each cell’s long axis. (B) Phalloidin staining of fln-1 animals reveals disorganized actin networks with thin mesh-like actin fibers within cells and thicker bundles near the cell periphery. (C) Just after oocyte entry of the first ovulation, the actin network in wild type animals, labeled with GFP::ACT-1, is initially disorganized. (C’) As the sp-ut valve opens, and the spermathecal bag contracts, fibers become aligned and organized as the spermatheca pushes the embryo into the uterus (C”). (C”’) The embryo is completely expelled from the spermatheca in wild type animals. (D) In animals lacking fln-1, the actin network is also initially disorganized, and remains disorganized through the time when wild type animals have already begun to organize their networks (D’). (D”) The spermatheca fails to contract and after several minutes, actin briefly forms puncta (arrowheads), before returning to a disorganized, thin meshy network with thicker peripheral bundles (D”’). Scale bars are 20 μm.
Figure 2:
Figure 2:. FLN-1 is necessary for colocalization and distribution of actin and myosin
(A-A”’) Maximum intensity projection of animals expressing moeABD::mCherry and GFP::NMY-1 to label F-actin (red) and myosin (green), respectively. Frames show the actomyosin network prior to oocyte entry (A), just after oocyte entry (A’), and the start of embryo exit (A”), and after ovulation (A”’). (B-B’) Maximum intensity projection of actin (red) and myosin (green) in fln-1(tm545) animals. Frames show the actomyosin network prior to oocyte entry (B), just after oocyte entry (B’), the point at which myosin forms puncta (B”), and the network after puncta formation (B”’). Scale bar is 20 μm, both movies were imaged at 12-second intervals. (C) Pearson coefficient of wild type ovulation shown in (A). Correlation is measured from the time point that the egg begins to enter the spermatheca until the end of imaging. The point where the egg is fully entered the spermatheca (A’), and where the egg begins to exit the spermatheca (A”), is indicated with the dashed lines labeled “a” and “b” respectively. (D) The Pearson correlation coefficient was measured for each frame of the fln-1(tm545) ovulation shown in (B), from when the oocyte has begun to enter the spermatheca, until the end of the imaging session. The dashed line labeled “a” indicates when the egg has fully entered the spermatheca (B’).
Figure 3:
Figure 3:. Depletion of fln-1 results in the formation of perinuclear myosin foci.
(A) Maximum intensity projection of excised, fixed, and DAPI (blue) stained spermathecae labeled with moeABD::mCherry (red) and GFP::NMY-1 (green). The inset labeled in A shows that actin (A’) and myosin (A”) are evenly distributed throughout the cell and not clumped near nuclei (A”’). The merge of all three channels is shown in A””. (B-B””) In fln-1(tm545) animals, myosin foci (B”) are located adjacent to the nucleus (B”’). Actin (B’) is both associated with the nucleus and is localized to the cell periphery. In A and B, the scale bar is 20 μm. In A’-A”” and B’-B”” the scale bar is 5 μm. (C) Line scan of the nuclear associated actomyosin annotated as “line 1” in B”” shows that myosin and actin intensity is increased and in close association with the DAPI nuclear signal. (C’) “Line 2”, drawn in B””, shows that peripheral actin does not seem to have myosin associated with it. (C”) The intensity profile across “line 3” shows that along certain cell junctions a small amount of myosin associates with peripheral actin. (D) The myosin regulatory light chain (green) labeled with GFP (MLC-4::GFP) is distributed along phalloidin-stained actin fibers (red) evenly in wild type animals. In fln-1 animals MLC-4 is still seen along actin fibers. Scale bar is 5 μm. (D’) Quantification of MLC-4::GFP along a fiber (arrowheads in D) show that MLC-4 intensity decreases as you measure further from the nucleus, while actin remains relatively unchanged. (D”) Average MLC-4::GFP and F-actin intensity in the 10 μm closest to the nucleus across 39 fibers from 13 fln-1(tm545) spermathecae show that while MLC-4 intensity is high close to nucleus, it becomes less bound to actin as distance from the nucleus increases, whereas actin intensity remains relatively unchanged.
Figure 4:
Figure 4:. The LINC complex is required for localization of the myosin foci seen in fln-1 animals.
Maximum intensity projections of fln-1(tm545) animals treated with either empty (A), anc-1 (A’) or unc-84 (A”) RNAi. Scale bar is 5 μm. Actomyosin puncta are adjacent to the nucleus in empty animals, as visualized by a line scan (B). Quantification (C) shows that distance increases between the nucleus and myosin foci with either anc-1 (B’) or unc-84 (B”) RNAi. Each point represents the average of 2–5 cells per spermatheca. Scale bars are SEM. Ordinary one-way ANOVA with Tukey’s multiple comparisons test: ****p<0.0001. (D) Maximum intensity projection of wild type excised spermatheca with endogenous ANC-1 labeled with a N-terminal GFP tag (green), phalloidin labeled F-actin (red), and DAPI stained nuclei (blue). Inset (dotted box) shows that actin (D’) forms organized, parallel bundles. ANC-1 (D”) is expressed in the spermatheca and localizes to the nucleus, stained with DAPI (D”’).
Figure 5:
Figure 5:. Filamin is involved with actin anchorage to the basal surface
(A) XZ projection through an animal expressing moeABD::mCherry labeled actin. Fibers are localized more apically in fln-1 animals compared to the basal fibers seen in wild type. Scale bars 5 μm. (B) Quantification shows that there is a decrease in relative basal actin fluorescence intensity compared to apical intensity. Each point represents a measurement of a single cell. Maximum intensity projection of excised wild type (C) and fln-1(C’) spermathecae where vinculin (green) is labeled with an internal 3xGFP, F-actin (red) is labeled with moeABD::mCherry, and the nucleus (blue) is stained with DAPI. For A-A’, the scale bar is 20 μm. DEB-1::3XGFP is over-expressed, which may lead to some aggregation. For C-C’ the scale bar is 20 μm.(D) Peripheral vinculin intensity in fln-1 animals increases compared to cell surface intensity. Cells (outlined with dotted boxes in C-C’) of wild type (E) and fln-1(E’) animals show that there is a redistribution of vinculin upon loss of fln-1. Wild type animals have puncta of equal sizes distributed throughout the surface of the cell, with some peripheral signal. fln-1(tm545) animals have increased DEB-1::3XGFP along the periphery of cells and near the nucleus (arrow). For B-B’ the scale bar is 10 μm. (F-F’) Line scans (dotted lines annotated in E-E’) show that wild type animals have evenly spaced DEB-1::3XGFP and actin intensities of relatively equal proportion, and loss of fln-1 results in a large accumulation of perinuclear DEB-1::3XGFP.
Figure 6:
Figure 6:. TLN-1/talin and PAT-3/β integrin localize to basal actin structures and to the cell periphery
TLN-1 (green) with F-actin (red) and nuclei stained with Phalloidin and DAPI, respectively with (A-A” maximum intensity projection, B-B” cross section of box indicated in A”) or without (C-C”) fln-1. PAT-3 (green) with F-actin (red) and nuclei stained with Phalloidin and DAPI, respectively with (D-D” maximum intensity projection, E-E” cross section) or without (F-F”) fln-1. Scale bar for A, C, E, and F is 20 μm, scale bar for B and E is 10 μm.
Figure 7:
Figure 7:. Larger peripheral actin bundles are more stable than smaller bundles
The actin bundles in fln-1 animals labeled with ACT-1::GFP were photobleached and fluorescence recovery was monitored over 100 seconds at 1 frame per second. Fiber size was quantified and fibers were grouped into small (≤1 μm) and large (>1 μm) fibers. (A) Representative image of ACT-1 intensity before being bleached (0-seconds), after bleaching (7-seconds), and during recovery (14-, 55-, and 99-seconds). Inset images have been rotated 90° from A. Scale bar is 20 μm and 2 μm for the large and inset images, respectively. (B) Normalized fluorescence intensity of the bleach and recovery curves for large and small fibers in fln-1 animals. Error bars are SEM. (Fibers >1 μm: N = 16; fibers ≤1 μm: N = 23. (C,D) The mobile fraction was significantly smaller in large fibers (>1 μm) than in small fibers (≤1 μm), but half recovery time remained unchanged. Each point represents a single bleach and recovery curve. Unpaired t test: ** p ≤ 0.01.
Figure 8:
Figure 8:. Several genes regulate the stability of large fln-1 actin bundles
(A-L) Normalized fluorescence intensity of the bleach and recovery curves of fln-1 animals treated with RNAi for large (>1 μm, solid lines) or small (≤1 μm, dotted lines) fibers. Animals treated with control RNAi are black in all traces. Error bars are SEM. (A’-L’) Quantification of the mobile fraction for fln-1 animals treated with empty (black dots in all graphs) or experimental RNAi for large (>1 μm, solid circles) or small (≤1 μm, open circles) fibers. Each point represents a single bleached fiber recovery. For each condition, only matched sizes were compared using an unpaired t test: * p ≤ 0.05, ** p ≤ 0.01. Error bars are SEM.
Figure 9:
Figure 9:. Spectrin stabilizes peripheral actin bundles in fln-1 animals
(A) Normalized fluorescence intensity of bleach and recovery curves of actin in fln-1 animals treated with empty, spc-1, or unc-70 RNAi for large (>1 μm, solid lines) or small (≤1 μm, dotted lines) fibers. (B) Mobile fraction of actin recovery after bleach in fln-1 animals treated with empty, spc-1, or unc-70 RNAi for large (>1 μm, solid circles) or small (≤1 μm, open circles) fibers. Each point represents a measurement from single bleach and recovery curve. Error bars are SEM. Ordinary one-way ANOVA with Tukey’s multiple comparison: *** p ≤ 0.001, * p ≤ 0.05. (C-C’) SPC-1::mKate2 localization (Fire LUT, first panel; red in merge) with respect to ACT-1::GFP with and without fln-1. Arrows indicated perinuclear SPC-1 dots. Arrowheads indicated thick peripheral actin bundles associated with junctional spectrin. Scale bar is 20 μm. (E) UNC-70 tagged with mTFP (red), F-actin labeled with moeABD::mCherry (green), and nuclei labeled with DAPI (blue) with (D) and without (E) fln-1. Scale bar is 20 μm. (E-E””) Dotted box indicates a cell with UNC-70 (E’, fire LUT, red in merge), actin (E”, green in merge), and nuclei (E”’, blue in merge) where actin is localized along UNC-70 rich cell junctions (E”” merge). Scale bar is 10 μm.
Figure 10:
Figure 10:. Filamin is required for correct positioning, size, and distribution of organelles
(A) Spermathecae of excised gonads expressing MmPLCδ::GFP to label membrane (green), were stained with phalloidin to label F-actin (red), and DAPI to label nuclei (blue). Knockdown of fln-1 using RNAi results in redistribution of nuclei with respect to cell peripheries (A’) Scale bar is 20 μm. (B) There is no difference in the percent of nuclei that are either touching, or not touching a cell edge. N represents the number of nuclei analyzed. Fisher’s exact test: ns. (C) Of the nuclei that are not touching the cell periphery, the distance between the nuclear edge, and the cell membrane is increased without fln-1. Each point represents a nucleus measured. Control (empty vector) RNAi = 14 cells (4 animals); fln-1 RNAi = 61 cells (14 animals). Mann Whitney test: **** p < 0.0001. (D-D’) Mitochondria labeled with an fragment of TOMM-20 fused to GFP (yellow) and nuclei labeled with DAPI (blue) show that animals treated with fln-1 RNAi have clumps of mitochondria near nuclei, whereas empty vector results in an evenly distributed mitochondrial network. Scale bar is 20 μm. Line scans, indicated with a dotted line in D-D’, are plotted for control and fln-1 RNAi treated spermathecal cells in E-E’. Mitochondria are less evenly distributed, and tightly associated with nuclei in fln-1 animals. (F-F’) The endoplasmic reticulum is labeled with an endogenous eGFP::Sec-61B tag (yellow) and have been excised and stained with DAPI (blue) Scale bar is 20 μm. Animals fed fln-1 RNAi have less evenly distributed endoplasmic reticulum than empty vector fed animals, quantified in G-G’ with a line scan (dotted line in F-F’).

References

    1. Agarwal P, & Zaidel-Bar R (2019). Principles of Actomyosin Regulation In Vivo. Trends in Cell Biology, 29(2), 150–163. 10.1016/j.tcb.2018.09.006 - DOI - PubMed
    1. Aono S, Legouis R, Hoose WA, & Kemphues KJ (2004). PAR-3 is required for epithelial cell polarity in the distal spermatheca of C. elegans. Development, 131(12), 2865–2874. 10.1242/dev.01146 - DOI - PubMed
    1. Bae J, Sung BH, Cho IH, & Song WK (2012). F-Actin-Dependent Regulation of NESH Dynamics in Rat Hippocampal Neurons. PLoS ONE, 7(4), e34514. 10.1371/journal.pone.0034514 - DOI - PMC - PubMed
    1. Bär J, Kobler O, van Bommel B, & Mikhaylova M (2016). Periodic F-actin structures shape the neck of dendritic spines. Scientific Reports, 6(1), 37136. 10.1038/srep37136 - DOI - PMC - PubMed
    1. Barstead RJ, Kleiman L, & Waterston RH (1991). Cloning, sequencing, and mapping of an alpha-actinin gene from the nematodeCaenorhabditis elegans. Cell Motility and the Cytoskeleton, 20(1), 69–78. 10.1002/cm.970200108 - DOI - PubMed

Publication types

MeSH terms

LinkOut - more resources