

Bi-allelic pathogenic variants in NDUFC2 cause early-onset Leigh syndrome and stalled biogenesis of complex I
- PMID: 32969598
- PMCID: PMC7645371
- DOI: 10.15252/emmm.202012619
Bi-allelic pathogenic variants in NDUFC2 cause early-onset Leigh syndrome and stalled biogenesis of complex I
Abstract
Leigh syndrome is a progressive neurodegenerative disorder, most commonly observed in paediatric mitochondrial disease, and is often associated with pathogenic variants in complex I structural subunits or assembly factors resulting in isolated respiratory chain complex I deficiency. Clinical heterogeneity has been reported, but key diagnostic findings are developmental regression, elevated lactate and characteristic neuroimaging abnormalities. Here, we describe three affected children from two unrelated families who presented with Leigh syndrome due to homozygous variants (c.346_*7del and c.173A>T p.His58Leu) in NDUFC2, encoding a complex I subunit. Biochemical and functional investigation of subjects' fibroblasts confirmed a severe defect in complex I activity, subunit expression and assembly. Lentiviral transduction of subjects' fibroblasts with wild-type NDUFC2 cDNA increased complex I assembly supporting the association of the identified NDUFC2 variants with mitochondrial pathology. Complexome profiling confirmed a loss of NDUFC2 and defective complex I assembly, revealing aberrant assembly intermediates suggestive of stalled biogenesis of the complex I holoenzyme and indicating a crucial role for NDUFC2 in the assembly of the membrane arm of complex I, particularly the ND2 module.
Keywords: Leigh syndrome; NDUFC2; OXPHOS; complex I; mitochondrial disease.
© 2020 The Authors. Published under the terms of the CC BY 4.0 license.
Conflict of interest statement
The authors declare that they have no conflict of interest.
Figures
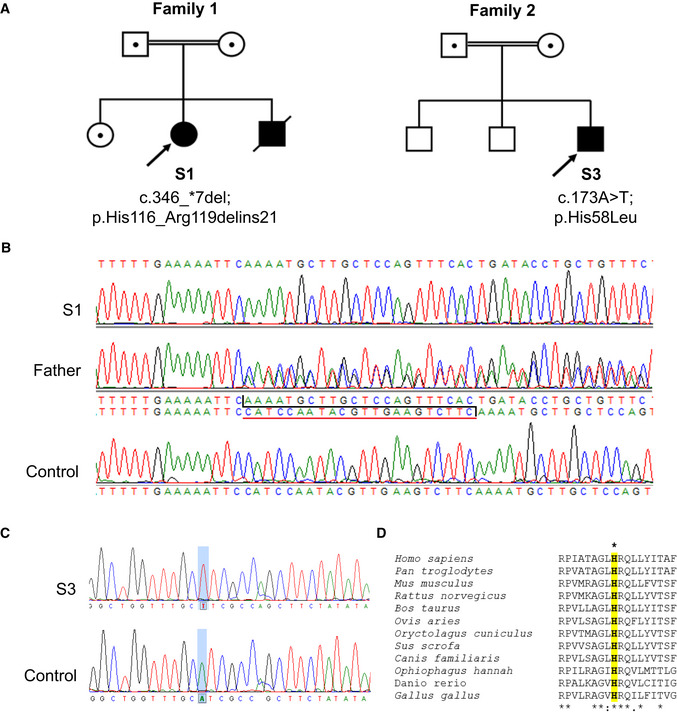
- A
Family pedigrees of Subjects 1, 2 and 3 show segregation of identified homozygous NDUFC2 variants within each family.
- B
Sequencing chromatograms depicting the identified 22 nucleotide deletion (c.346_*7del) identified in Subject 1 (S1), the heterozygous state of the deletion in the father and the wild‐type NDUFC2 sequence in control DNA.
- C
Sequencing chromatograms depicting the identified missense variant (c.173A>T; p.(His58Leu)) in Subject 3 (S3) and the wild‐type NDUFC2 sequence in control DNA.
- D
Clustal Omega sequence alignment shows evolutionary conservation of the p.His58 residue (highlighted) along with its neighbouring residues (human NDUFC2: NP_004540.1).
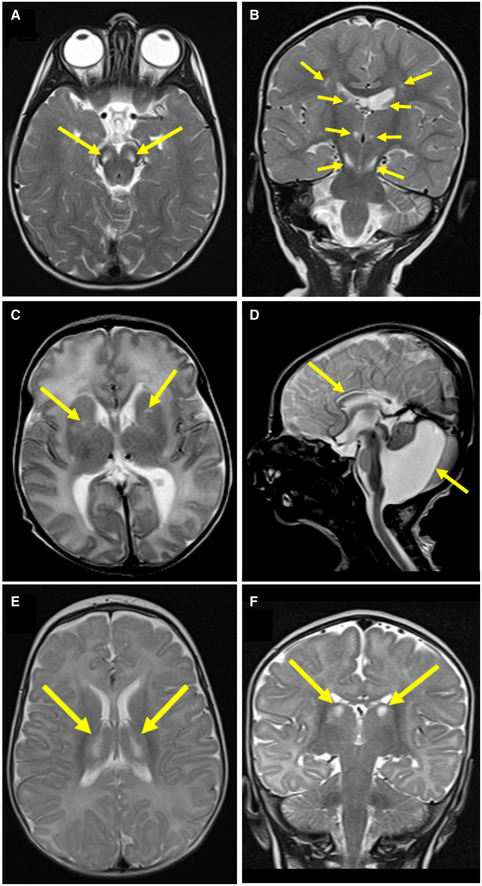
- A
Axial T2‐weighted imaging of Subject 1 at 21 months showed bilateral hyperintense signals in the pons (arrows).
- B
Coronal T2‐weighted imaging of Subject 1 at 21 months showed bilateral hyperintense signals in the thalami and substantia nigra (arrows).
- C
Axial T2‐weighted imaging of Subject 2 at 10 days of age showed bilateral hyperintense signals in the basal ganglia (arrows).
- D
Sagittal T2 imaging of Subject 2 at 10 days of age showed Dandy‐Walker malformation and thinning of the corpus callosum (arrows).
- E, F
Axial and coronal (respectively) T2‐weighted imaging of Subject 3 at 5 months of age showed bilateral hyperintense signals in the thalami (arrows).
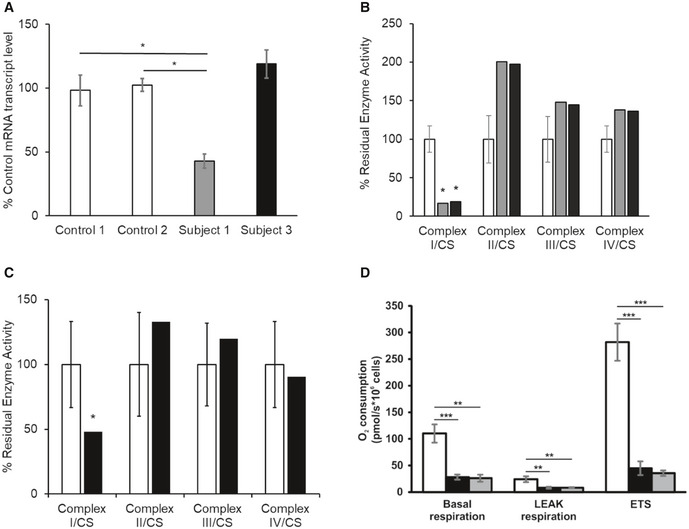
- A
NDUFC2 mRNA transcript levels in fibroblast cell lines of controls (white), Subject 1 (grey) and Subject 3 (black). Quantification of NDUFC2 mRNA transcript levels (normalised to ACTB) showed diminished transcript levels in Subject 1, whilst transcript levels were unaffected in Subject 3. Bars correspond to standard deviations of two independent experiments, performed in duplicate and analysed by Student's t‐test; *P < 0.05.
- B
Assessment of respiratory chain enzyme activities normalised to citrate synthase (CS), in fibroblast cell lines from controls (white), Subject 1 (grey) and Subject 3 (black). Mean residual enzyme activities of control fibroblasts (n = 8) are set at 100%, and error bars represent 1 standard deviation of control activities. Asterisks (*) denote enzyme activity below control range.
- C
Assessment of respiratory chain enzyme activities normalised to citrate synthase (CS), in skeletal muscle from controls (white) and Subject 3 (black). Mean residual enzyme activities of control skeletal muscle (n > 100 samples) are set at 100%, and bars are 1 standard deviation of control activities. Asterisks (*) denote enzyme activity below control range.
- D
Respiration of Subject 3 and Subject 1 derived fibroblasts (black and grey, respectively) compared to control fibroblasts (white) using high‐resolution respirometry. ROX‐corrected analysis of basal respiration, oligomycin‐inhibited LEAK respiration and maximum uncoupled respiration (ETS). Both subject fibroblasts exhibited a severe mitochondrial respiration defect as measured by oxygen consumption. Data are mean ± SD from at least 3 experiments and analysed by Student's t‐test. **P < 0.01, ***P < 0.001.
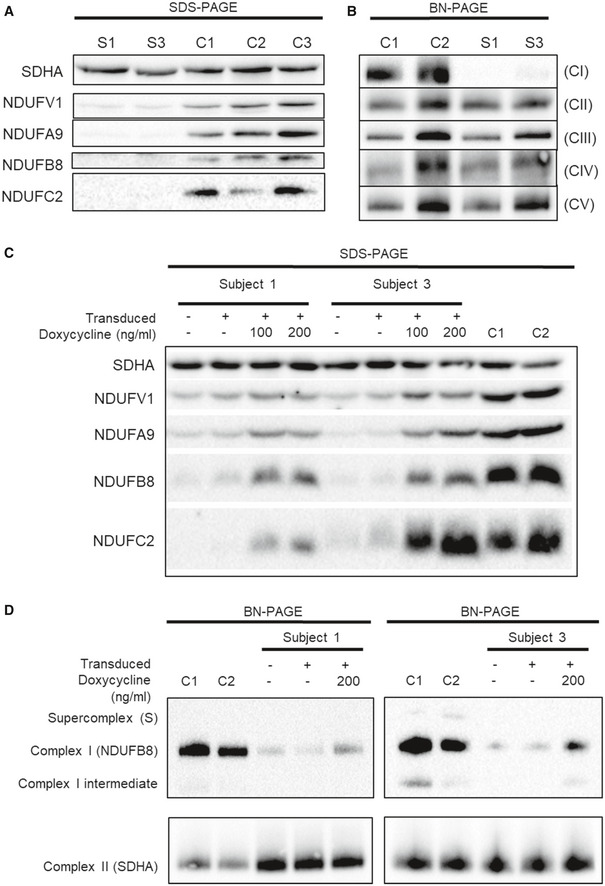
- A
Western blot analysis of various structural subunits of complex I in fibroblasts from Subjects 1 and 3 (S1 and S3, respectively) with three age‐matched controls (C1, C2 and C3).
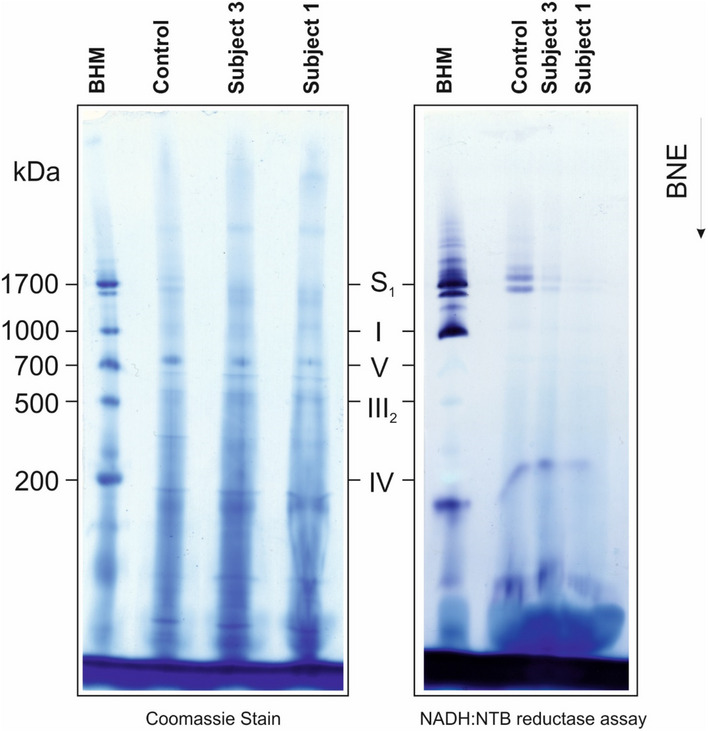
- B
BN‐PAGE analysis of OXPHOS complex assembly in enriched mitochondria from subject and control fibroblasts solubilised using DDM. Immunoblotting was performed using antibodies to structural subunits from each OXPHOS complex [CI (NDUFB8), CII (SDHA), CIII (UQCRC2), CIV (MT‐CO1) and CV (ATP5A)].
- C
Western blot analysis of whole cell lysates from controls (C1 and C2) and subject cell lines (S1 and S3) that were either untransduced (−) or transduced with the lentiviral vector (pLVX) containing wild‐type NDUFC2 (+). Transduced cell lines were either uninduced or induced with 100 or 200 ng/ml doxycycline (for 48 and 96 h, respectively) where indicated.
- D
BN‐PAGE analysis of OXPHOS complex assembly in enriched mitochondria isolated from controls (C1 and C2) and subject cell lines that were either untransduced (−) or transduced with the lentiviral vector (pLVX) containing wild‐type NDUFC2 (+). Transduced cell lines were either uninduced or induced with 200 ng/ml doxycycline for 72 h.
- A
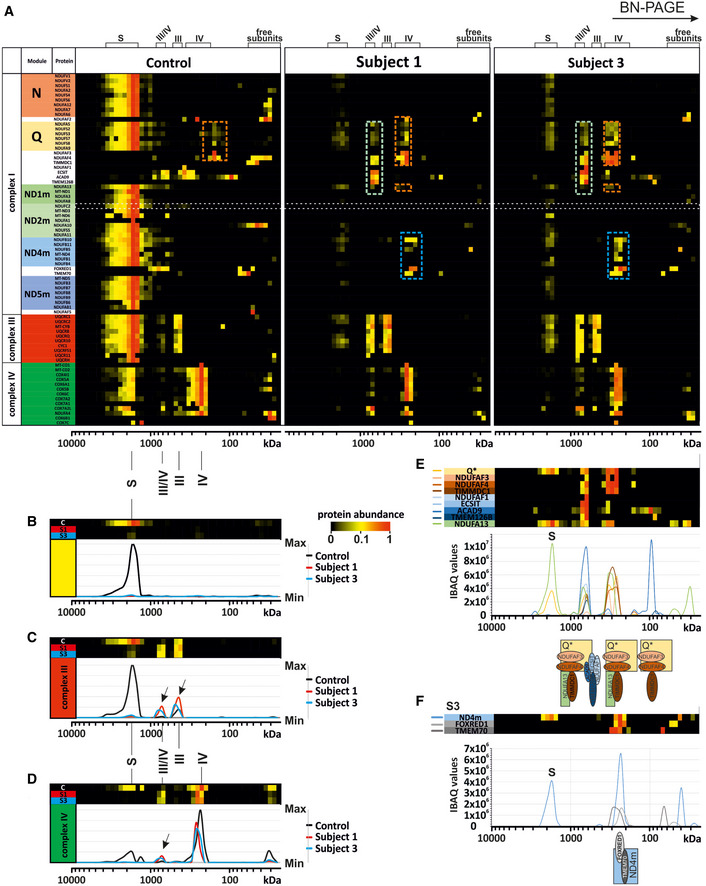
Complexome profiling identified assembly intermediates in subject cells with NDUFC2 variants. Complexes from mitochondrial membranes of control, Subject 1 and Subject 3 fibroblasts were separated by BN‐PAGE (Fig EV2) and analysed by complexome profiling. Sample preparation, mass spectrometry, data processing and raw data have been deposited to the ProteomeXchange Consortium via the PRIDE partner repository (Vizcaíno et al, 2013) with the dataset identifier <PXD014936>. Assignment of complexes: III, complex III; IV, complex IV; III/IV, supercomplex containing dimer of complex III and 1–2 copies of complex IV; S, supercomplex containing complex I, dimer of complex III and 1–4 copies of complex IV. Assembly intermediates are highlighted in dashed boxes indicating stalled complex I assembly. In subject complexomes, various stalled complex I intermediates are assembled: ND4 module (blue dashed box); Q‐TIMMDC1‐NDUFA13 complex I intermediate (orange dashed box); and Q‐TIMMDC1‐NDUFA13‐MCIA (green dashed box). In control complexome, the Q module (orange dashed box) is assembled without TIMMDC1 or NDUFA13. Complex I modules are denoted according to Stroud et al (2016).
- B
Abundance data for all the subunits of complex I were averaged to plot an abundance profile of complex I. Heatmap (upper panel) and profile plot (lower panel) compare complex I between control (black), Subject 1 (red) and Subject 3 (blue).
- C
Profile plot of complex III (average of all subunits). Black arrows indicate shifted complex III to the position of the individual complex and small supercomplex (III/IV) in Subjects 1 and 3.
- D
Profile plot of complex IV (average of all subunits) indicate less complex IV at the position of the supercomplexes for Subject 1 and Subject 3, but higher amounts of individual complex IV and small supercomplex (III/IV, black arrow).
- E
Details of Q module‐containing assembly intermediates of Subject 3. Intensity‐based absolute quantification (iBAQ) values of assembly factors, single subunit and averaged Q module subunits were plotted to show abundance profiles. The cartoon (lower panel) indicates assembled intermediate complexes relative to the plot.
- F
Details about ND4 module assembly intermediate of Subject 3. Abundance profile of averaged iBAQ values of ND4 subunits and assembly factors show accumulation of a complex containing the ND4 module, FOXRED1 and TMEM70.
- A
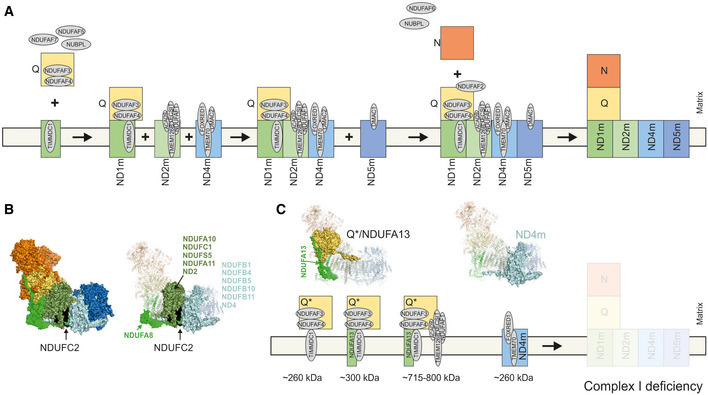
Assembly sequence of complex I modules according to current state of knowledge in human cells (Guerrero‐Castillo et al, 2017; Signes & Fernandez‐Vizarra, 2018). The ND1 module (ND1 m), ND2 module (ND2m), ND4 module (ND4m) and ND5 module (ND5m) are identified by these abbreviations.
- B
Left, structural modules of complex I highlighted in colours based on mouse cryo‐EM structure (PDB: 6g2j) (Agip et al, 2018). NDUFC2 is shown in black. Right, surface view indicates subunits interacting in a neighbourhood of less than 10 Å to NDUFC2. All other subunits not interacting on any part of the protein are in transparent cartoon view.
- C
Assembly intermediates/dead end assembly products in mitochondria from Subject 3 according to data from complexome profiling. Assembled subunits are highlighted in surface view within cryo‐EM structure (PDB: 6g2j) (Agip et al, 2018).
References
-
- Abicht A, Scharf F, Kleinle S, Schön U, Holinski‐Feder E, Horvath R, Benet‐Pagès A, Diebold I (2018) Mitochondrial and nuclear disease panel (Mito‐aND‐Panel): combined sequencing of mitochondrial and nuclear DNA by a cost‐effective and sensitive NGS‐based method. Mol Genet Genom Med 6: 1188–1198 - PMC - PubMed
Publication types
MeSH terms
Substances
Grants and funding
LinkOut - more resources
Full Text Sources
Medical
Molecular Biology Databases
