A new genre of fluorescence recovery assay to evaluate polo-like kinase 1 ATP-competitive inhibitors
- PMID: 32970049
- PMCID: PMC7523589
- DOI: 10.1039/d0ay01223h
A new genre of fluorescence recovery assay to evaluate polo-like kinase 1 ATP-competitive inhibitors
Abstract
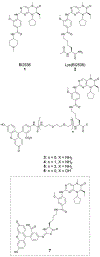
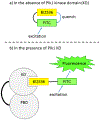
Using a probe consisting of a fluorescein-labeled variant of the potent polo-like kinase 1 (Plk1) inhibitor BI2536 [FITC-PEG-Lys(BI2536) 4], we were able to determine half maximal inhibitory concentration (IC50) of ATP-competitive Type 1 inhibitors of Plk1 by means of a fluorescence recovery assay. This methodology represents a cost-effective and simple alternative to traditional kinase assays for initial screening of potential Plk1 inhibitors.
Conflict of interest statement
Conflicts of interest
There are no conflicts to declare.
Figures


Similar articles
-
Application of a Fluorescence Recovery-Based Polo-Like Kinase 1 Binding Assay to Polo-Like Kinase 2 and Polo-Like Kinase 3.Biol Pharm Bull. 2024;47(7):1282-1287. doi: 10.1248/bpb.b24-00189. Biol Pharm Bull. 2024. PMID: 38987177 Free PMC article.
-
Discovery of Non-ATP-Competitive Inhibitors of Polo-like Kinase 1.ChemMedChem. 2016 Apr 5;11(7):713-7. doi: 10.1002/cmdc.201600051. Epub 2016 Mar 8. ChemMedChem. 2016. PMID: 27061239
-
Inhibition of Polo-Like Kinase 1 by BI2536 Reverses the Multidrug Resistance of Human Hepatoma Cells In Vitro and In Vivo.Anticancer Agents Med Chem. 2019;19(6):740-749. doi: 10.2174/1871520619666190301145637. Anticancer Agents Med Chem. 2019. PMID: 30836927
-
Polo-like kinases inhibitors.Curr Med Chem. 2012;19(23):3937-48. doi: 10.2174/092986712802002455. Curr Med Chem. 2012. PMID: 22709006 Review.
-
Progress with polo-like kinase (PLK) inhibitors: a patent review (2018-present).Expert Opin Ther Pat. 2024 Sep;34(9):789-806. doi: 10.1080/13543776.2024.2379924. Epub 2024 Jul 15. Expert Opin Ther Pat. 2024. PMID: 38994687 Review.
Cited by
-
Affinity enhancement of polo-like kinase 1 polo box domain-binding ligands by a bivalent approach using a covalent kinase-binding component.RSC Chem Biol. 2024 Jun 4;5(8):721-728. doi: 10.1039/d4cb00031e. eCollection 2024 Jul 31. RSC Chem Biol. 2024. PMID: 39092437 Free PMC article.
-
Development of ultra-high affinity bivalent ligands targeting the polo-like kinase 1.RSC Chem Biol. 2022 Jul 15;3(9):1111-1120. doi: 10.1039/d2cb00153e. eCollection 2022 Aug 31. RSC Chem Biol. 2022. PMID: 36128509 Free PMC article.
-
Application of a Fluorescence Recovery-Based Polo-Like Kinase 1 Binding Assay to Polo-Like Kinase 2 and Polo-Like Kinase 3.Biol Pharm Bull. 2024;47(7):1282-1287. doi: 10.1248/bpb.b24-00189. Biol Pharm Bull. 2024. PMID: 38987177 Free PMC article.
References
Publication types
MeSH terms
Substances
Grants and funding
LinkOut - more resources
Full Text Sources
Miscellaneous

