. 2020 Dec;225(9):2643-2668.
doi: 10.1007/s00429-020-02146-y. Epub 2020 Sep 24.

GABA-glutamate supramammillary neurons control theta and gamma oscillations in the dentate gyrus during paradoxical (REM) sleep

Affiliations

GABA-glutamate supramammillary neurons control theta and gamma oscillations in the dentate gyrus during paradoxical (REM) sleep

Francesca Billwiller et al. Brain Struct Funct. 2020 Dec.

Abstract

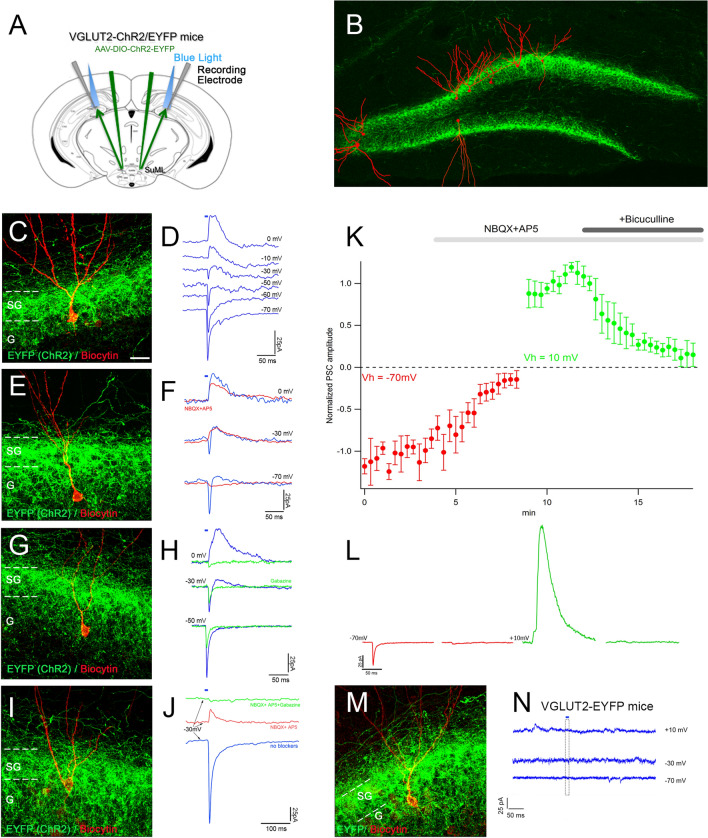
Several studies suggest that neurons from the lateral region of the SuM (SuML) innervating the dorsal dentate gyrus (DG) display a dual GABAergic and glutamatergic transmission and are specifically activated during paradoxical (REM) sleep (PS). The objective of the present study is to characterize the anatomical, neurochemical and electrophysiological properties of the SuML-DG projection neurons and to determine how they control DG oscillations and neuronal activation during PS and other vigilance states. For this purpose, we combine structural connectivity techniques using neurotropic viral vectors (rabies virus, AAV), neurochemical anatomy (immunohistochemistry, in situ hybridization) and imaging (light, electron and confocal microscopy) with in vitro (patch clamp) and in vivo (LFP, EEG) optogenetic and electrophysiological recordings performed in transgenic VGLUT2-cre male mice. At the cellular level, we show that the SuML-DG neurons co-release GABA and glutamate on dentate granule cells and increase the activity of a subset of DG granule cells. At the network level, we show that activation of the SuML-DG pathway increases theta power and frequency during PS as well as gamma power during PS and waking in the DG. At the behavioral level, we show that the activation of this pathway does not change animal behavior during PS, induces awakening during slow wave sleep and increases motor activity during waking. These results suggest that the SuML-DG pathway is capable of supporting the increase of theta and gamma power in the DG observed during PS and plays an important modulatory role of DG network activity during this state.

Keywords: GAD; Hippocampus; Hypothalamus; SuM; VGAT; VGLUT2.


Conflict of interest statement

The authors declare that they have no conflict of interest.

Figures

Fig. 1
Fig. 1
Neurochemical features of SuML neurons innervating the dorsal dentate gyrus (DG) characterized by simultaneous labeling for the rabies virus (RV) retrograde tracer (green), VGAT mRNA (red) and VGLUT2 mRNA (blue) in a coronal section. ac Coronal sections of a VGLUT2-cre mouse processed for immunodetection of the RV, 38 h after its injection in supragranular and granule cell layers (G) of the dorsal DG. a Photomicrograph showing the track of the micropipette and site of injection (arrows). Sections at two rostro (b)–caudal (c) levels of the SuM showing retrograde-labeled neurons located within the lateral part of the SuM (SuML). Insert in b, c at higher magnification, Golgi-like labeling of the retrograde-labeled neurons. dl All confocal images were obtained from sequential acquisition of separate wavelength channels, corresponding to the different fluorophores used for the triple labeling, from a single optical slice. This optical slice was acquired in the supramammillary region of the hypothalamus from a coronal section of a VGLUT2-cre mouse that received an injection of RV in supragranular layer of the dorsal DG (a). d Image obtained from the merge of the two confocal images corresponding, respectively, to the labeling of VGLUT2 (blue) and VGAT (red) mRNAs. Many neurons expressing both VGLUT2 and VGAT mRNAs (arrow) were observed in the lateral region of the supramammillary nucleus (SuML). They were located almost exclusively above and around the mammillary tract (mt). Neurons expressing VGLUT2 mRNA only (blue) were observed mainly in the most medial part of the SuM (SuMM) and were numerous in the mammillary nucleus (M). Few neurons containing VGAT mRNA only (red, arrowheads) were distributed in the SuML and SUMM. e Confocal image corresponding to the immunohistochemical labeling of the RV (green) showing that all RV containing neurons in the SuM were located in the region of the SuML surrounded the mt. f Merge of d, e. gi Higher magnification of region outlined in df showing that all these SuML neurons projecting to the DG, labeled for the RV (h, arrows), co-expressed VGLUT2 and VGAT mRNAs (g, i, arrows). jl RV labeled neuron (k, arrow) co-expressed VGAT mRNA (j, arrow) and VGLUT2 mRNA (l, arrow). Scale bars a 50 μm; b, c, 500 μm; insert, 50 μm; df 100 μm; gl 10 μm
Fig. 2
Fig. 2
Neurochemical features of axon terminals from SuML neurons innervating the dorsal DG characterized by simultaneous immunohistochemical labeling for the AAV-EYFP anterograde tracer (green), GAD65 or VGAT (red) and VGLUT2 (blue) in coronal sections. a Diagram illustrating the bilateral injections of the viral vector AAV-DIO-ChR2-EYFP within the lateral region of the SuM. Images from a coronal section showing endogenous fluorescence of EYFP observed in the cell body and proximal dendrites of a transfected neuron located within the SuML as well as fibers and axon terminals within the supragranular (arrowheads) and granular layer (G) of the DG. b Image obtained from a single optical slice showing labeling for EYFP (green), GAD65 (red) and VGLUT2 (blue) in the hippocampus. Fibers labeled with the anterograde tracer AAV-DIO-ChR2-EYFP injected within the SUM as illustrate in a were exclusively located in the supragranular (arrowheads) and granule cell (G) layers as well as the CA2 region of the hippocampus. c, d Images corresponding to a maximum intensity z-projection of a stack of 8 optical slices spaced at 370 nm, showing labeling for EYFP (green), VGLUT2 (blue) and GAD65 (c, red) or VGAT (d, red) in the dorsal DG. Axon terminals and fibers, from neurons in the SuML, labeled for the EYFP anterograde tracer (green) were located mainly in the supragranular layer but also in the granule cell layer. Numerous GAD65- (c) or VGAT- (d) containing terminals were present in the molecular layer (M) and granule cell layer (G) of the dorsal DG. VGLUT2-containing terminals were mainly located in the supragranular layer (SG) but were also observed in G. el Images of the three different fluorophores used for the triple labeling, obtained by sequential acquisition of separate wavelength channels from a single optical slice, in the SG of the DG demonstrated that many if not all axon terminals labeled for EYFP (b, i, green, arrowheads) contained GAD65 (g, red arrowheads), VGAT (k, red, arrowheads) but also VGLUT2 (f, j blue, arrowheads). h Merge of eg. l Merge of ik. Scale bars a, b, 200 μm; c, d, 25 μm and el, 3 μm
Fig. 3
Fig. 3
Pre-embedding immunolabeling for EYFP anterograde tracer in ultrathin coronal sections of the dorsal DG. ai In the dorsal DG, numerous axon terminals were labeled for EYFP, revealed by electron-dense peroxidase 3.3′-diaminobenzidine tetrahydrochloride product. a A labeled axon terminal (At) making two synaptic contacts (arrow and arrowhead) on unlabeled somata of 2 presumed granule cells (Gr). b Higher magnification of the At illustrated in a showing that these two synaptic contacts were different: one displayed a relatively thin post-synaptic density (arrowhead) characteristic of symmetric synapses on the soma of one Gr; the other one displayed a thick post-synaptic density (arrow) characteristic of asymmetric synapses on the soma of another Gr. c Labeled axon terminal established a synaptic contact displaying a thick synaptic density on a unlabeled dendritic process (D) that differed from the synaptic contact formed by the unlabeled At (arrow). The synaptic contacts illustrated in di displayed relatively thin post-synaptic densities (arrowheads) on the soma (df, i) or dendrites (g, h) of unlabeled Gr. m mitochondria, Nu nucleus. Scale bar ai 0.5 μm
Fig. 4
Fig. 4
Selective stimulation of axonal terminals from SuML neurons innervating the dorsal DG, performed in hippocampal slices of VGLUT2-ChR2-EYFP mice, induced co-release of GABA and glutamate on DG granule cells. a Diagram illustrating the site of the bilateral injections of AAV-DIO-ChR2-EYFP in VGLUT2-cre mice, of light stimulations and of the recorded patch clamp electrode in the DG of the VGLUT2-ChR2-EYFP mice. b Montage illustrating the position within the dentate granule cell layer of the biocytin-filled cells reconstructed after patch clamp recordings and EYFP-labeled terminals originating from SuML neurons. d, f, h, j, n Examples of light induced PSCs recorded in DG cells illustrated in c, e, g, i, m. d Light induced post-synaptic currents (PSCs) recorded at different holding potentials in DG neuron; short black bar above the upper trace shows the time moment and duration of light stimulus. Note at − 70 to − 50 mV holdings the PSCs had negative-going direction (inward) currents. They were positive-going (outward) at − 10 mV and 0 mV but displayed both negative- and positive-going phases when the neuron membrane was clamped at − 30 mV. This suggests that light stimulation induces two types of postsynaptic currents. Indeed, the application of glutamate receptor blockers NBQX and AP5 (f, red traces) inhibited inward (f, negative going) component of PSCs recorded at negative holding potentials (Vh), but had only small effect on outward component (positive going) recorded at positive Vh. Inversely, the outward component of light induced PSCs was sensitive to GABA A receptor inhibitor gabazine (h, green vs blue traces). This suggests that these PSCs are generated by simultaneous activation of glutamate and GABA post-synaptic receptors. Interestingly at − 50 mV holding, PSC was larger without gabazine (h, blue versus green trace), probably because GABA-mediated current hyperpolarizes the membrane potential increasing thus the driving force for the glutamatergic current. In voltage-clamp condition such an interaction is possible if the pool of postsynaptic GABA Rs is close to the postsynaptic Glu R pool. k, l Effect of glutamate and GABA A receptors blockers on the peak amplitude of light pulse evoked PSC recorded at − 70 mV (red circles) and 10 mV (green circles) holding potentials. For each Vh the peak amplitudes of first 10 PSCs were averaged and used then as a normalization factor for all peak amplitude recorded at given potential. Each point and error bars corresponds the mean ± SD of PSC normalized amplitude recorded in 5 DG neurons. In regular ACSF the repetitive light pulses (5 ms, 0.05 Hz) evoked PCS of relatively stable amplitude (1.00 ± 0.26, L left-hand side red trace-an example of averaged response of one neuron). The application of glutamate receptor blockers (10 µM NBQX + 40 µM D-AP5) reduced the peak amplitude by 84% (0.16 ± 0.15, p < 0.01, n = 5, paired Wilcoxon test). The remaining response was seen in 4 from 5 neurons and is probably due to GABA A mediated current because at − 70 mV the driving force for chloride driven currents is close to but not zero (l, red trance in the middle), therefore, in case of GABA massive release some inward current is still possible. Indeed a switch to Vh = 10 mV revealed a huge PSC response to light stimulation (l, green trace in the middle) whose amplitude was stable (1.00 ± 0.20) but progressively reduced to 12% (0.12 ± 0.16, p < 0.01, n = 5, paired Wilcoxon test) by the addition of 10 µM bicuculline to the ACSF already containing GluR blockers (l, green trace at left). In 3 from 5 neurons, 6 min-lasting bicuculline application completely abolished response to light pulses. In two neurons the remaining current is probably due to the competitive character of bicuculline induced inhibition, i.e. in case of high GABA release 10 µM of bicuculline may be not sufficient to all receptors inhibition. m, n The identical light stimulation (5 ms, 10%, 50% 90% max power LED) of fibers and axon terminals expressing EYFP on slices of control VGLUT2-EYFP mice (n = 3) did not evoke any response in the recorded granule cells (n = 5) confirming that ChR2 activation is required to obtain the PSCs. Scale bar c, e, g, i, m, 20 μm
Fig. 5
Fig. 5
Effects of light stimulation of axonal terminals from SuML neurons innervating the dorsal DG on DG LFP, EEG recordings and behavior of VGLUT2-ChR2-EYFP mice during WK, SWS and PS. a, e, i Examples of raw recording for EMG, LFP recorded in the DG and parietal cortex EEG as well as associated time–frequency analysis of LFP and EEG in a VGLUT2-ChR2-EYFP mouse during WK (a), SWS (e) and PS (i). The blue bar represents the optogenetic stimulation period (20 Hz with pulses of 10 ms for 10 s). b, c, f, g, j, k LFP power spectra between 0 and 18 Hz and 60–100 Hz in VGLUT2-ChR2-EYFP mouse before and during light stimulation (20 Hz 10 s, pulses of 10 ms, during 4 h) during WK (b, c), SWS (f, g) and PS (j, k). An effect was clearly visible on the LFP in all vigilance states. The stimulation induced a slight increase in the theta power during WK (a, b) and a major increase in theta power and frequency during PS (i, j) as well as a clear reduction of slow wave oscillation during SWS (e, f). The stimulation during WK and PS also increased the power of gamma (c, k). Light stimulation during WK increased locomotor activity reflected by an increase of EMG signal in VGLUT2-ChR2-EYFP mice (a, d, blue trace) as compared to control VGLUT2-EYFP mice (d, gray trace). h Light stimulation during SWS induced awakening reflected by a significant increase of the awakening percentage after stimulation in most VGLUT2-ChR2-EYFP mice (range 30–100%) as compared to that observed in control VGLUT2-EYFP mice (range 0–30%). l In contrast no significant difference in the percentage of awakening was observed between VGLUT2-CHR2-EYFP and control VGLUT2-EYFP mice when stimulation was performed during PS
Fig. 6
Fig. 6
Comparison of the effects of light stimulation of axonal terminals from SuML neurons innervating the dorsal DG on DG LFP performed during WK, SWS and PS between VGLUT2-ChR2-EYFP and control VGLUT2-ChR2-EYFP mice. a Ratio of power recorded during light stimulation to that recorded before the stimulation (20 Hz, 10 s for 4 h with pulses 10 ms) for the different frequency bands (delta, theta, gamma) of LFP in VGLUT2-ChR2-EYFP (n = 4) and control VGLUT2-EYFP (n = 4) mouse groups during WK, SWS and PS. These ratios illustrate the following: an increased power in the theta frequency band during stimulations performed in PS; an increase of theta/delta power during the stimulation when performed in WK and SWS and an increased power in the gamma frequency band when stimulations were performed during WK and PS in the VGLUT2-ChR2-EYFP group. Increased power observed during stimulations observed in the ChR2 group differed significantly from random variation observed before and after the stimulation in the control group. Significance: Mann Whitney: *p < 0.05. Theta/delta (b) and gamma (c) power ratios as a function of time after light stimulation during the different vigilance states. The blue bar on the x axis represents the stimulation period. Shaded regions show 95% confidence intervals. During WK, a significant increase of theta/delta (b) and gamma (c) power occurred in VGLUT2-ChR2-EYFP group immediately after the light stimulation. These increases were observed during the entire 20-s period analyzed. The increase of theta/delta during SWS occurred two to three seconds after the stimulation. The increase of theta (b) and gamma (c) powers during PS occurred immediately after the stimulation and stayed during the 10-s period of stimulation. No difference induced by the stimulation was observed in the control group. d, e Peak frequency analysis of theta before and during optogenetic stimulation in the control group (n = 4) and the ChR2 group (n = 4). Significance: Mann Whitney, *p < 0.05 compared to the control group
Fig. 7
Fig. 7
Comparison of the effects of light stimulation of axonal terminals from SuML neurons innervating the dorsal DG on EEG performed during WK, SWS and PS between VGLUT2-ChR2-EYFP and control VGLUT2-EYFP mice. a, b EEG power spectra between 0 and 18 Hz and 60–100 Hz in a VGLUT2-ChR2-EYFP mouse before and during light stimulation (20 Hz 10 s, pulses of 10 ms, during 4 h) during WK, SWS and PS. An effect was clearly visible on the EEG in all vigilance states. c Ratio of power recorded during light stimulation to that recorded before the stimulation for the different frequency bands (delta, theta, gamma) of EEG in VGLUT2-ChR2-EYFP (n = 4) and control VGLUT2-EYFP (n = 4). These ratios illustrate an increase of theta/delta power during the stimulation when performed in WK and SWS and an increased power in the gamma frequency band when stimulations were performed during all vigilance states in the VGLUT2-ChR2-EYFP group. These increased powers during stimulations observed in ChR2 group differed significantly from random variation observed before and after the stimulation in the control group. Significance: Mann Whitney: *p < 0.05. Theta/delta (d) and gamma (e) power ratios as a function of time after light stimulation during the different vigilance states. The blue bar on the x axis represents the stimulation period. Shaded regions show 95% confidence intervals. During WK, a significant increase of theta/delta (b) and gamma (c) powers occurred in VGLUT2-ChR2-EYFP group immediately after the light stimulation. These increases were observed during the entire 20-s period analyzed. The increase of theta/delta during SWS occurred 2- to 3 seconds after the stimulation. The increase of gamma (c) powers during PS occurred immediately after the stimulation and lasted during the 10-s period of stimulation. No increase in theta was observed during PS (c, d) in the EEG. No difference induced by the stimulation was observed in the control group
Fig. 8
Fig. 8
Activation of DG cells after light stimulation of axon terminals from SuML neurons innervating the DG in VGLUT2-ChR2-EYFP and VGLUT2-EYFP as reflected by cFos immunohistochemical labeling. ad Immunohistochemical labeling for cFos on sections of control VGLUT-EYFP (a, b) and VGLUT2-ChR2-EYFP (c, d) mice. In control mice (a, b) some neurons labeled for cFos were observed in the hippocampus. They were scattered in all layers of the CA1, CA3 regions of the hippocampus and the DG. In addition, most of these neurons were lightly labeled for cFos including those observed in the granule cell layer (G) of the DG. In contrast, in VGLUT2-ChR2-EYFP mice, many c-Fos containing neurons were located in the granule cells layer (G) of the DG, whereas only a few were observed within the CA3 and CA1 regions of the hippocampus. In the granule cell layer, most of these neurons were highly labeled for cFos (d) as compared to those observed in control mice (b). e Quantitative analysis showing that the number of cFos-containing neurons was increased in the granule cell layer of the stimulated DG (ipsi) but not in the contralateral DG (contra) in VGLUT2-ChR2-EYFP mice (n = 4) as compared to control mice (n = 4). Wilcoxon Rank Sum test *p < 0.05%; scale bars a, c 250 μm; b, d 50 μm

References

    1. Bernasconi-Guastalla S, Wolfer DP, Lipp H-P. Hippocampal mossy fibers and swimming navigation in mice: correlations with size and left-right asymmetries. Hippocampus. 1994;4:53–64. - PubMed
    1. Billwiller F, Renouard L, Clement O, Fort P, Luppi PH. Differential origin of the activation of dorsal and ventral dentate gyrus granule cells during paradoxical (REM) sleep in the rat. Brain Struct Funct. 2017;222:1495–1507. - PMC - PubMed
    1. Bland BH, Oddie SD, Colom LV, Vertes RP. Extrinsic modulation of medial septal cell discharges by the ascending brainstem hippocampal synchronizing pathway. Hippocampus. 1994;4:649–660. - PubMed
    1. Bolte S, Cordelières FP. A guided tour into subcellular colocalization analysis in light microscopy. J Microsc. 2006;224:213–232. - PubMed
    1. Borhegyi Z, Leranth C. Distinct substance P- and calretinin-containing projections from the supramammillary area to the hippocampus in rats; a species difference between rats and monkeys. Exp Brain Res. 1997;115:369–374. - PubMed

LinkOut - more resources