. 2021 Jan;51(1):231-246.
doi: 10.1002/eji.201948432. Epub 2020 Oct 29.

CD73 contributes to anti-inflammatory properties of afferent lymphatic endothelial cells in humans and mice

Affiliations

CD73 contributes to anti-inflammatory properties of afferent lymphatic endothelial cells in humans and mice

Dominik Eichin et al. Eur J Immunol. 2021 Jan.

Abstract

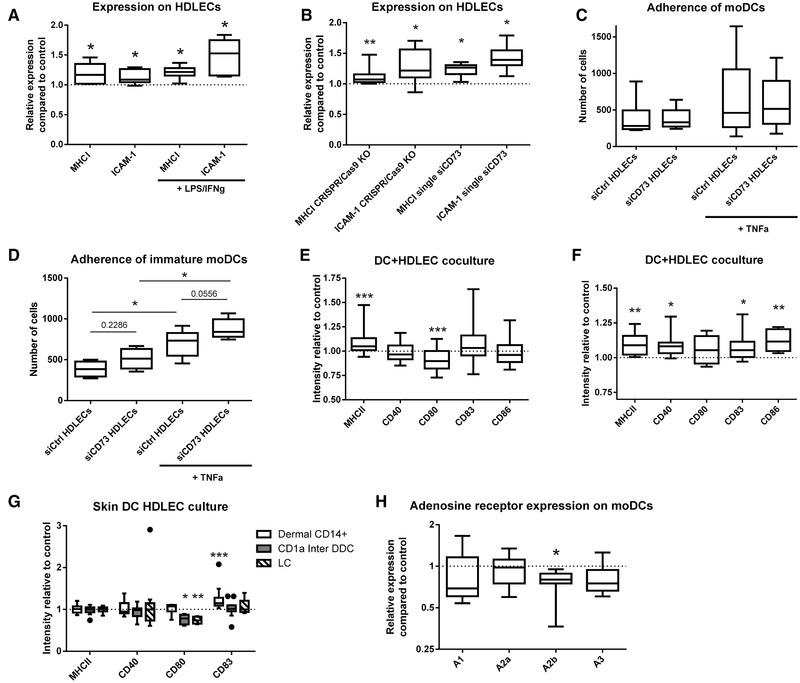
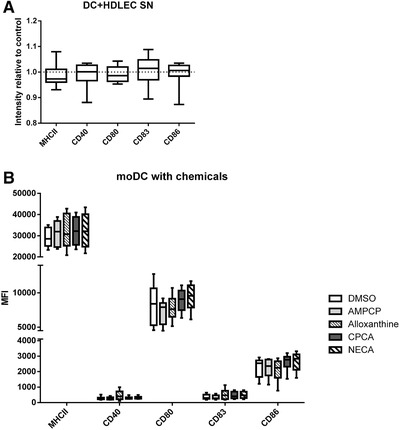
CD73 is an important ectoenzyme responsible for the production of extracellular adenosine. It is involved in regulating inflammatory responses and cell migration and is overexpressed in various cancers. The functions of CD73 in blood endothelial cells are understood in detail, but its role on afferent lymphatics remains unknown. Moreover, anti-CD73 antibodies are now used in multiple clinical cancer trials, but their effects on different endothelial cell types have not been studied. This study reveals that a previously unknown role of CD73 on afferent lymphatics is to dampen immune responses. Knocking it out or suppressing it by siRNA leads to the upregulation of inflammation-associated genes on lymphatic endothelial cells and a more pro-inflammatory phenotype of interacting dendritic cells in vitro and in vivo. In striking contrast, anti-CD73 antibodies had only negligible effects on the gene expression of lymphatic- and blood-endothelial cells. Our data thus reveal new functions of lymphatic CD73 and indicate a low likelihood of endothelial cell-related adverse effects by CD73 targeting therapeutic antibodies.

Keywords: CD73; dendritic cells; lymphatic endothelial cells; siRNA; vascular biology.


Conflict of interest statement

S. J. and M. S. own stocks of Faron Pharmaceuticals. The other authors have no additional commercial and financial interests.

Figures

Figure 1
Figure 1
siCD73 treated primary lymphatic endothelial cells (LECs) show extensive transcriptional changes and altered pro‐inflammatory pathways. (A) Representative histogram from flow‐cytometry showing reduction of CD73 after siRNA treatment. CD73‐silenced LECs are depicted with red (MFI: 1373), nontargeting control‐silenced cells in gray (MFI: 13265). (B) Multidimensional scaling (MDS) plot of RNA‐sequencing after siRNA treatment, built from Euclidian distances of logCPM values from sorted cells of four different HDMEC donors. Observations cluster according to donor, time, and treatment. (C) Limma‐plot indicating significantly changed genes after CD73‐silencing in red. The 20 most significantly altered genes are encircled. (D) Table depicting the 20 most significantly altered genes from (C) with their global average expression (logCPM), fold change, and q‐value. Genes in bold were altered similarly after siRNA and CRISPR/Cas9. (E and F) Pathway analysis results using the KEGG and GO database with significant up‐ and downregulations following silencing. (G) Inflammation pathways obtained using the GO database with significant up‐ and downregulations. Data are obtained from one experiment with four different biological donors as described in more detail in the method section.
Figure 2
Figure 2
Inflammation‐ and DC‐associated genes are altered after siCD73 treatment of LECs. (A) Interaction networks of CD73 (= NT5E) and inflammation‐associated genes obtained with CytoScape of CD73‐siRNA silenced cells compared to their nontargeted siRNA‐treated controls. The circle size indicates the expression of the gene, the color of its up‐ or downregulation (red and blue, respectively), ranging from +9.58 to −22.32. The color of the connectors indicate co‐expression (purple), co‐localization (blue), physical interaction (pink), predicted interaction (orange), or a shared protein domain (green). (B) qPCR verification of important RNA‐seq hits (CD69, ZNF366, MX1, IGF1, ICAM1, KDR, Clever, BST2, OAS2, IFI6, TRAF6, EPSTI1, ERG, S1PR1, TGFB1, ANGPT2, IL6R, NT5E) shown as fold changes of siCD73‐treated LECs compared and normalized to the nontargeted control, analyzed with Wilcoxon matched‐pairs signed rank test. Data are depicted as boxplots showing the median with Min and Max values as whiskers. (C) Altered genes after siCD73 treatment that code for proteins shown to interact with DCs, their up‐ or downregulation and expression are shown. Genes in bold were altered similarly after pool‐siRNA and CRISPR/Cas9. *p < 0.05, **p < 0.01. In (A) and (C), data are from one experiment with four different biological donors; in (B), the data are from three independent experiments with four, two, and three different biological donors, except for the genes ZNF366, OAS2, KDR, and TRAF6 where the data are from two independent experiments with four and three biological donors.
Figure 3
Figure 3
CD73‐silenced LECs promote an inflammatory phenotype on dendritic cells. (A) Relative expression of MHCI and ICAM‐1 on LECs after pool‐siCD73 treatment and LPS/IFN‐γ exposure as determined with flow cytometry compared to nontargeted siRNA‐treated controls. The data are from two to three independent experiments with two, four, and one different biological donor(s). (B) Relative expression of MHCI and ICAM‐1 on LECs after CRISPR/Cas9 and single‐siCD73 treatment with LPS/IFN‐γ exposure compared to controls determined with flow cytometry. Data are from three to four independent experiments with two to three biological donors. (C) Adherence of moDCs to CD73‐silenced and nontargeted control LECs in the steady‐state and after TNF‐α treatment of LECs. The data are from four independent experiments with one, two, two, and two (one, two, one, one after TNF‐α) different biological donors (one, two, one, and one donor(s) after TNF‐α). (D) As in (C), but with immature moDCs. Data are from two independent experiments with two to three donors. (E) Relative expression of moDC maturation markers following co‐culture with siCD73 treated LECs and their nontargeted controls measured by flow cytometry. The data are from 17 independent experiments with one to two different biological donors. (F) As in (E), but CD73 on LECs has been knocked out with CRISPR/Cas9. Data are from three independent experiments with two to three donors. (G) Relative expression of skin‐DC maturation markers following co‐culture with pool‐siCD73 treated LECs and their nontargeted controls measured by flow cytometry. The data are from six independent experiments with one to three different biological donors (n = 7–11). DDC = dermal dendritic cells; LC = Langerhans cells. (H) Relative adenosine receptors (A1, A2a, A2b, A3) expression on DCs following co‐culture with pool‐siCD73‐treated LECs compared to nontargeted control measured by qPCR. The data are from four independent experiments with one, two, two, and two different biological donors. Data have been analyzed with Wilcoxon matched‐pairs signed rank test. Data are depicted as boxplots showing the median with Min and Max values as whiskers. *p < 0.05, **p < 0.01, ***p < 0.001.
Figure 4
Figure 4
Physical contact, rather than secreted factors from LECs, is responsible for the changed inflammatory profile. (A) Relative expression of moDC maturation‐markers following culture with supernatants from pool‐siCD73‐treated LECs and their nontargeted control. The data are from seven independent experiments with one to two different biological donors (n = 10 biological replicas, Wilcoxon matched‐pairs signed rank test). (B) Median fluorescent intensity values of moDC maturation markers after culture with compounds affecting the adenosine pathway. The data are from five to seven independent experiments with one biological donor. Data are depicted as boxplots showing the median with Min and Max values as whiskers and measured by flow cytometry. AMPCP (adenosine 5′‐(α,β‐methylene)diphosphate sodium salt; CD73 inhibitor); alloxanthine (inihibitor of xhantine oxidase); CPCA (5′‐(N‐cyclopropyl)carboxamidoadenosine; A2‐adenosine receptor agonist); NECA (5′‐(N‐ethylcarboxamido)adenosine; adenosine receptor agonist).
Figure 5
Figure 5
CD73 KO animals show elevated maturation of DCs after an inflammatory stimulus. (A) Expression of DC maturation markers following footpad injection of OVA and incomplete Freud's adjuvant in CD73 WT and KO animals. The data are from two independent experiments with total of four different animals per group. (B) Percentage of dendritic cells is positive for FITC in the draining LN or control LN after FITC ear painting. (C) Expression of DC maturation markers after FITC ear painting on FITC positive cells in CD73 WT and KO animals. In (B) and (C), the data are from four different experiments with total of seven different animals per group. Data are depicted as boxplots showing the median with Min and Max values as whiskers and measured by flow cytometry. Data are analyzed with Wilcoxon matched‐pairs signed rank test. *p < 0.05, **p < 0.01.
Figure 6
Figure 6
CD73‐targeting antibodies alter its expression on LECs and BECs in an epitope‐specific manner. (A) Graphical overview of the different modus operandi of CD73 antibodies 118, AD2, and 4G4. (B) CD73 expression determined by flow‐cytometry on LECs and BECs following blocking and staining with CD73 antibodies 4G4, AD2, or 118, respectively. The data are from three (2‐h time point) to four (3 days time point) independent experiments with one to three different biological donors (n = 5–8). (C) CD73 (NT5E) gene expression determined by qPCR following blocking with CD73‐specific antibodies on LEC and BEC cells compared to control‐antibody–treated cells. The data are from two to three independent experiments with two to three different biological donors (n = 4–7). (D) Enzymatic activity of AMPase (CD73), following blocking with CD73‐specific antibodies on LEC and BEC cells and was analyzed by scintillation β‐counting. The data are from two to three independent experiments with two to four different biological donors (n = 5–7), analyzed by Mann–Whitney U test. (E) Enzymatic activity of ADPase, ATPase, and adenylate kinase following blocking with CD73‐specific antibodies on LEC and BEC cells and was analyzed by scintillation β‐counting. The data are from two to three independent experiments with two to four different biological donors (n = 5–7), analyzed by Mann–Whitney U test. Data are depicted as boxplots showing the median with Min and Max values as whiskers. *p < 0.05, ***p < 0.001.
Figure 7
Figure 7
CD73‐targeting antibodies do not have significant transcriptomics effects. (A) Multidimensional scaling (MDS) plot of RNA‐sequencing after CD73‐antibody treatment, built from Euclidian distances of logCPM values. Observations cluster according to donor, time, and treatment in both LEC and BEC cells. Cells from four different sorted HDMEC donors were used. (B) Altered genes after 4G4 treatment on LEC and BEC cells are shown. Gray indicates no alteration. (C) qPCR verification of RNA‐seq hits (S1PR1, ERG, OGDH, ELOVL6, HES1, CD69, and IGF1) with LECs after antibody treatment shown as fold changes compared to control‐antibody–treated cells. The data are from two independent experiments with three different biological donors and depicted as boxplots showing the median with Min and Max values as whiskers; analyzed with Wilcoxon matched‐pairs signed rank test (nonsignificant). (D) As in (C), but obtained from BECs. The data are from two independent experiments with three different biological donors. (E) Relative expression of moDC maturation markers following co‐culture with CD73‐antibody‐treated LECs and their controls and measured by flow cytometry. The data are from three independent experiments with one to three different biological donors (n = 6), analyzed with Wilcoxon matched‐pairs signed rank test (nonsignificant). Data are depicted as boxplots showing the median with Min and Max values as whiskers.

References

    1. Antonioli, L. , Pacher, P. , Vizi, E. S. and Haskó, G. CD39 and CD73 in immunity and inflammation. Trends Mol. Med. 2013. 19: 355–367. - PMC - PubMed
    1. Eltzschig, H. K. , Sitkovsky, M. V and Robson, S. C. Purinergic signaling during inflammation. N. Engl. J. Med. 2012. 367: 2322–2333. - PMC - PubMed
    1. Haskó, G. and Cronstein, B. Regulation of inflammation by adenosine. Front. Immunol. 2013. 4: 1–8. - PMC - PubMed
    1. Sek, K. , Mølck, C. , Stewart, G. D. , Kats, L. , Darcy, P. K. and Beavis, P. A. Targeting adenosine receptor signaling in cancer immunotherapy. Int. J. Mol. Sci. 2018. 19: 3837. - PMC - PubMed
    1. Fredholm, B. B. , IJzerman, A. P. , Jacobson, K. A. , Linden, J. and Müller, C. E. International Union of Pharmacology. LXXXI. Nomenclature and classification of adenosine receptors—an update. Pharmacol. Rev. 2011. 63: 1–34. - PMC - PubMed

Publication types

MeSH terms