. 2020 Nov;39(11):2010-2017.
doi: 10.1377/hlthaff.2020.00980. Epub 2020 Sep 24.

The Impact Of The COVID-19 Pandemic On Hospital Admissions In The United States

Affiliations

The Impact Of The COVID-19 Pandemic On Hospital Admissions In The United States

John D Birkmeyer et al. Health Aff (Millwood). 2020 Nov.

Abstract

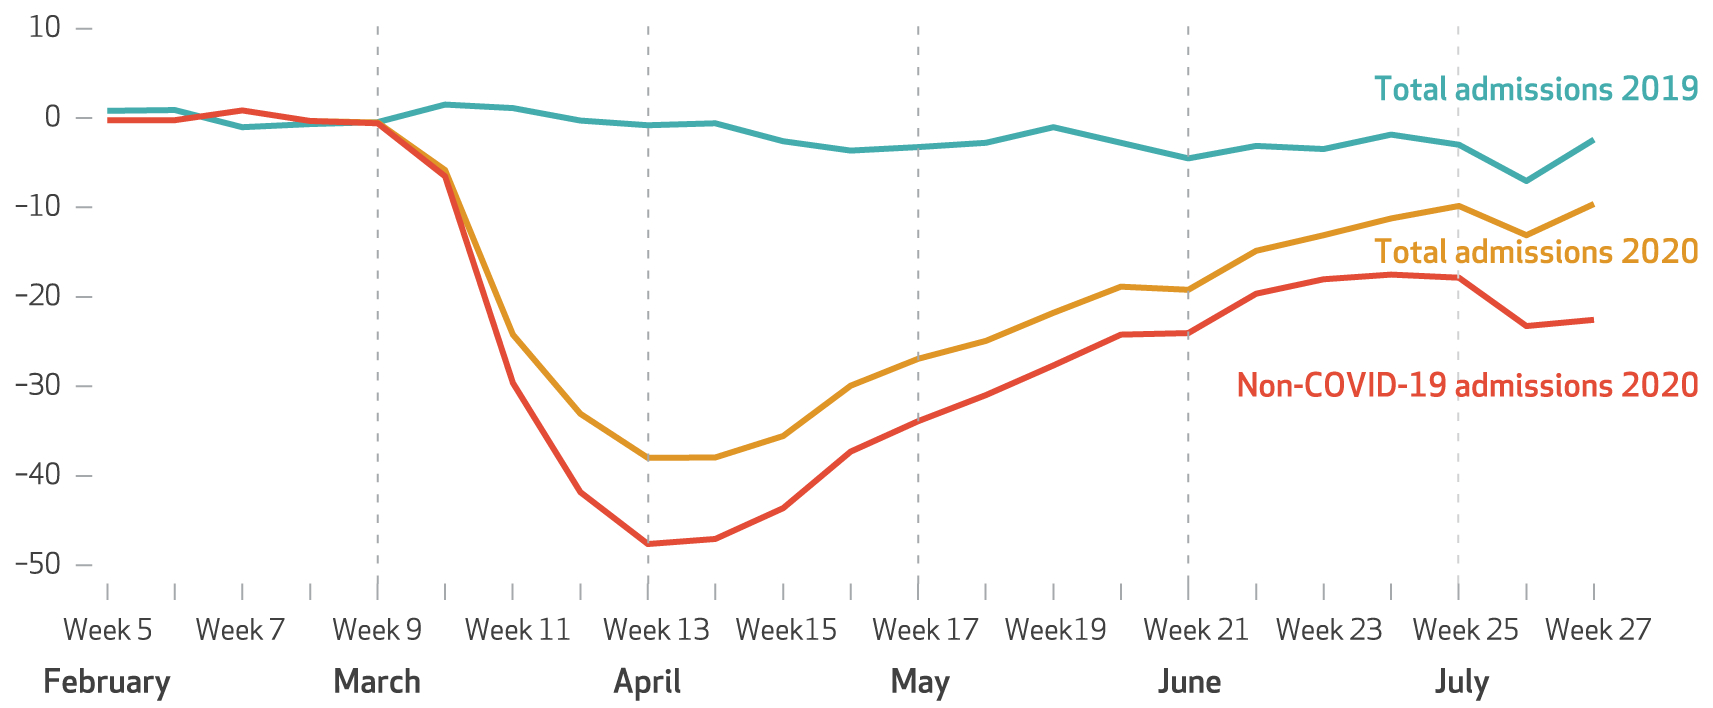
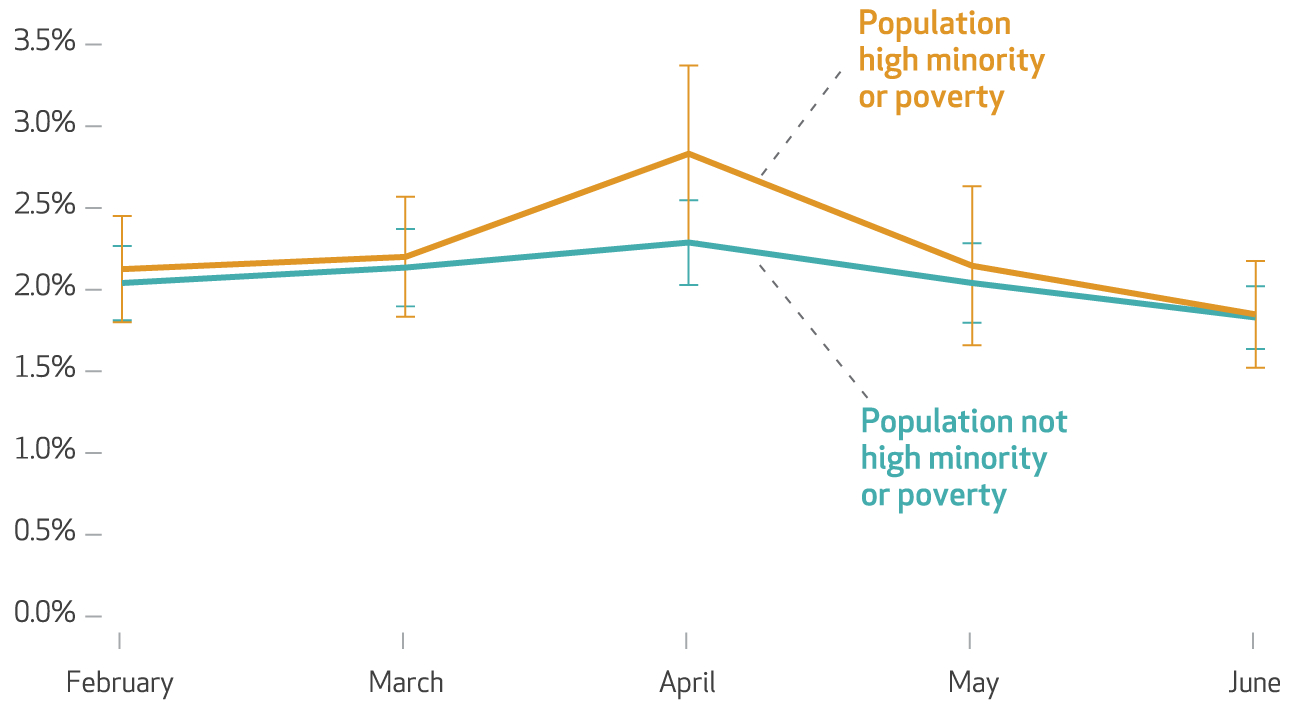
Hospital admissions in the US fell dramatically with the onset of the coronavirus disease 2019 (COVID-19) pandemic. However, little is known about differences in admissions patterns among patient groups or the extent of the rebound. In this study of approximately one million medical admissions from a large, nationally representative hospitalist group, we found that declines in non-COVID-19 admissions from February to April 2020 were generally similar across patient demographic subgroups and exceeded 20 percent for all primary admission diagnoses. By late June/early July 2020, overall non-COVID-19 admissions had rebounded to 16 percent below prepandemic baseline volume (8 percent including COVID-19 admissions). Non-COVID-19 admissions were substantially lower for patients residing in majority-Hispanic neighborhoods (32 percent below baseline) and remained well below baseline for patients with pneumonia (-44 percent), chronic obstructive pulmonary disease/asthma (-40 percent), sepsis (-25 percent), urinary tract infection (-24 percent), and acute ST-elevation myocardial infarction (-22 percent). Health system leaders and public health authorities should focus on efforts to ensure that patients with acute medical illnesses can obtain hospital care as needed during the pandemic to avoid adverse outcomes.


Figures

Exhibit 1
Exhibit 1. Total medical admissions in 2019 and 2020 and non-COVID-19 medical admissions in 2020 in a group of US hospitals, by week
SOURCE Data from Sound Physicians hospital admissions. NOTES Data represent 1,056,951 admissions in 201 hospitals in 36 states. Non-COVID-19 admissions exclude all suspected or confirmed COVID-19 admissions based on physicians’ response to a specific prompt in the electronic medical record at admission starting in week 10, which corresponds to the beginning of the pandemic. The percentage decline is relative to the average weekly admissions during February (weeks 5–8). Week 5 corresponds to February 2–8 and week 27 to July 5–11, 2020.
Exhibit 4
Exhibit 4. Adjusted in-hospital mortality rates for non-COVID-19 medical admissions in a group of US hospitals, by minority or poverty status in the patient’s ZIP code, February–June 2020
SOURCE Data from Sound Physicians hospital admissions. NOTES Data from 201 hospitals in 36 states. The orange (upper) line corresponds to estimates for patients living in ZIP codes with either majority-Black or majority-Hispanic populations or those with poverty rates higher than 25 percent; the teal (lower) line denotes all other patients. Estimates are from a logistic regression that adjusted for diagnosis, age, sex, and month by year by high-minority/poverty ZIP code categorical variables. The weeks correspond to months as follows: February (weeks 5–8), March (weeks 9–12), April (weeks 13–17), May (weeks 18–21), and June/July (weeks 22–26). Error bars represent 95% confidence intervals. The full regression analysis is in the appendix (see note 17 in text).

Similar articles

Cited by

References

    1. Cigna. Cigna study finds reduced rates of acute non-elective hospitalizations during the COVID-19 pandemic [Internet]. Bloomfield (CT): Cigna; 2020. April [cited 2020 Sep 25]. Available from: https://www.cigna.com/about-us/newsroom/studies-and-reports/deferring-ca...
    1. Cox C, Kamal R, McDermott D. How have healthcare utilization and spending changed so far during the coronavirus pandemic? [Internet]. San Francisco (CA): Peterson-KFF Health System Tracker; 2020. August 6 [cited 2020 Sep 25]. Available from: https://www.healthsystemtracker.org/chart-collection/how-have-healthcare...
    1. Hartnett KP, Kite-Powell A, DeVies J, Coletta MA, Boehmer TK, Adjemian J, et al. Impact of the COVID-19 pandemic on emergency department visits—United States, January 1, 2019–May 30, 2020. MMWR Morb Mortal Wkly Rep. 2020;69(23): 699–704. - PMC - PubMed
    1. Arcaya MC, Tucker-Seeley RD, Kim R, Schnake-Mahl A, So M, Subramanian SV. Research on neighborhood effects on health in the United States: a systematic review of study characteristics. Soc Sci Med. 2016;168:16–29. - PMC - PubMed
    1. De Rosa S, Spaccarotella C, Basso C, Calabrò MP, Curcio A, Filardi PP, et al. Reduction of hospitalizations for myocardial infarction in Italy in the COVID-19 era. Eur Heart J. 2020;41(22):2083–8. - PMC - PubMed

Publication types

MeSH terms