Randomized Controlled Trial
. 2021 Jan 4;131(1):e133960.
doi: 10.1172/JCI133960.

CMV viral load kinetics as surrogate endpoints after allogeneic transplantation

Affiliations
Randomized Controlled Trial

CMV viral load kinetics as surrogate endpoints after allogeneic transplantation

Elizabeth R Duke et al. J Clin Invest. .

Abstract

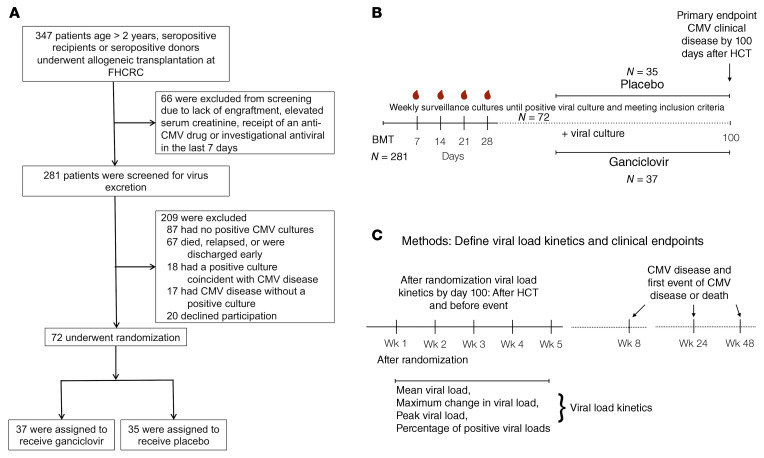
BACKGROUNDViral load (VL) surrogate endpoints transformed development of HIV and hepatitis C therapeutics. Surrogate endpoints for CMV-related morbidity and mortality could advance development of antiviral treatments. Although observational data support using CMV VL as a trial endpoint, randomized controlled trials (RCTs) demonstrating direct associations between virological markers and clinical endpoints are lacking.METHODSWe performed CMV DNA PCR on frozen serum samples from the only placebo-controlled RCT of ganciclovir for early treatment of CMV after hematopoietic cell transplantation (HCT). We used established criteria to assess VL kinetics as surrogates for CMV disease or death by weeks 8, 24, and 48 after randomization and quantified antiviral effects captured by each marker. We used ensemble-based machine learning to assess the predictive ability of VL kinetics and performed this analysis on a ganciclovir prophylaxis RCT for validation.RESULTSVL suppression with ganciclovir reduced cumulative incidence of CMV disease and death for 20 years after HCT. Mean VL, peak VL, and change in VL during the first 5 weeks of treatment fulfilled the Prentice definition for surrogacy, capturing more than 95% of ganciclovir's effect, and yielded highly sensitive and specific predictions by week 48. In the prophylaxis trial, the viral shedding rate satisfied the Prentice definition for CMV disease by week 24.CONCLUSIONSOur results support using CMV VL kinetics as surrogates for CMV disease, provide a framework for developing CMV preventative and therapeutic agents, and support reductions in VL as the mechanism through which antivirals reduce CMV disease.FUNDINGMerck Sharp & Dohme Corp., a subsidiary of Merck & Co., Inc.

Keywords: Clinical Trials; Drug therapy; Infectious disease; Stem cell transplantation.


Conflict of interest statement

Conflict of interest: The Fred Hutchinson Cancer Research Center (ERD, BB, TSA, MEF, KRJ, LC, PBG, JTS, and MJB) received a research grant from Merck & Co., Inc. to support the conduct of the study. NC, HW, TCM, and MAM are employees of Merck Sharp & Dohme Corp., a subsidiary of Merck & Co., Inc. BDW, BB, and JLG declare no competing interests. The following conflicts of interest are not related to the submitted study: KRJ reports grant funding from Immune Design Corp. and personal fees from Editas Medicine, Janssen Sciences Ireland, and Vir Biotechnology, Inc.; LC reports ownership interest in Immune Design Corp., Vir Biotechnology, Inc., and Cero Therapeutics; PGB has grant funding from Sanofi Pasteur; JTS reports grant funding from Genocea Biosciences, Inc.; MB has grant funding from Astellas, Chimerix, Gilead, GlaxoSmithKline, Takeda, Vir Biotechnology, and Lophius Biosciences and is a consultant to AlloVir, Artemis Therapeutics, Astellas, Chimerix, Gilead, GlaxoSmithKline, Moderna Therapeutics, Oxford Immunotec, Takeda, and Vir Biotechnology Inc., and is a scientific advisory board member of Helocyte, Inc. and Evrys Bio.

Figures

Figure 1
Figure 1. CONSORT diagram and study designs for the early treatment trial.
Study design for Goodrich et al. RCT (A and B) and for VL kinetic analysis (C). (A) The reconstructed CONSORT diagram for the original RCT. (B) The original study design with surveillance and screening beginning at HCT and randomization beginning at the time of first positive surveillance culture. (C) The VL kinetics study design with analysis beginning at randomization (receipt of study drug) and ending at day 100 after HCT or a study endpoint of CMV disease or death, whichever occurred first.
Figure 2
Figure 2. CMV disease and death clinical outcomes in the early treatment trial.
CMV disease (right-censored for death), overall mortality, and first event of CMV disease or mortality in the placebo and ganciclovir (GCV) groups at time points defined in the original study (A) and at extended follow-up times out to 20 years (B). In all plots, the ganciclovir group is shown in red; the placebo group is shown in blue. Numbers at risk are shown below their respective plots (PLAC indicates the placebo group. GCV indicates the treatment group). Survival and first event of CMV disease or death curves were estimated using Kaplan-Meier methods. The cumulative incidence of CMV disease with death as a competing risk was estimated using the Aalen-Johnson method. Survival distributions and times to the composite endpoint of CMV disease or death were compared using a log-rank test. Cumulative incidence distributions for CMV disease with death as a competing risk were compared using Gray’s test.
Figure 3
Figure 3. Weekly CMV VL kinetics in the early treatment trial.
CMV VL kinetics from time of randomization (Week 0). (A and B) VL data are shown for patients who had not reached an endpoint of CMV disease or death by that week. GCV indicates patients in the ganciclovir treatment group (shown in red). Placebo indicates patients in the placebo treatment group (shown in blue). Error bars indicate 95% CI. The dashed horizontal line represents the limit of detection (LOD) of the CMV VL assay. VL kinetics summary calculations (C) were performed with the data shown in A and B. Box-and-whisker plots show the middle 50% of VL kinetics in gray boxes with a horizontal black line at the median. Whiskers extend upward from the third quartile at the top of the box to 1.5 times the IQR (the distance between first and third quartiles) and downward from the first quartile at the bottom of the box to 1.5 times the IQR. P values were calculated from 2-tailed t tests comparing the means of the viral kinetics in GCV versus placebo groups.
Figure 4
Figure 4. Prentice criteria evaluation using multivariate logistic regression and proportion of treatment effect captured in the early treatment trial.
(A) Forest plots of the ORs for associations of VL kinetics with risk for CMV disease and CMV disease or death by week 48 after randomization were calculated from logistic regression models adjusted for baseline characteristics and treatment group. OR for VL kinetics are indicated by navy dots surrounded by 95% CI indicated with navy lines; OR with 95% CI for treatment group assignment are shown with light green dots and lines. Asterisks (*) indicate VL kinetics that met the Prentice criteria by multivariable logistic regression testing, i.e. the coefficient for VL kinetic was significantly different from 0 (P < 0.05), whereas the treatment group assignment coefficient was not significantly different from 0 (P ≥ 0.20). The treatment by marker interaction coefficient was not significantly different from 0 (P ≥ 0.20) for any kinetic. The percentage positive did not meet Prentice criteria for CMV disease with P = 0.07 for VL kinetic association. Max change did not meet Prentice criteria for CMV disease with P = 0.14 for GCV association. For mean, max change, and peak, ORs were calculated as the ratio of odds of the clinical outcome in groups differing by log10 IU/mL. For percentage positive, the OR was calculated as the ratio of odds of the clinical outcome in groups differing by 25% in percentage of samples with detectable VL. Dashed vertical lines indicate OR = 1. (B) The percentages of ganciclovir’s effect on clinical outcomes captured by the candidate surrogate were calculated using Kobayashi and Kuroki’s measure (23) and are shown for each of the VL kinetics.
Figure 5
Figure 5. Prediction accuracy for clinical outcomes with Super Learner in the early treatment trial.
(A and C) Receiver operating characteristic (ROC) curves are shown for Super Learner predictions for CMV disease and CMV disease or death by 48 weeks after randomization. The diagonal line drawn at y = x indicates the boundary above which ROC curves describe a prediction that is better than chance. (B and D) Forest plots show cross-validated area under the ROC curves (cv-AUC) of Super Learner predictions for CMV disease and CMV disease or death. For AD, predictions made only on data from the placebo group are in blue, from the ganciclovir group (GCV) in red, and from both treatment groups (All) in purple. In B and D, the vertical line indicates cv-AUC = 50%, the area under the diagonal line in A and C.
Figure 6
Figure 6. CONSORT diagram and study design for the prophylaxis trial.
Study design for Goodrich et al. AIM 1993 RCT. (A) The reconstructed CONSORT diagram for the original RCT. (B) The original study design with surveillance and screening beginning at HCT and randomization beginning at the time of engraftment.
Figure 7
Figure 7. CMV disease clinical outcomes in the prophylaxis trial.
CMV disease (right-censored for death), overall mortality, and first event of CMV disease or mortality in the placebo and ganciclovir groups at 14, 24, and 48 weeks after randomization. The ganciclovir group is shown in red; the placebo group is shown in blue. Numbers at risk are shown below their respective plots (PLAC indicates the placebo group. GCV indicates the treatment group). Survival and first event of CMV disease or death curves were estimated using Kaplan-Meier methods. The cumulative incidence of CMV disease with death as a competing risk was estimated using the Aalen-Johnson method. Survival distributions and times to the composite endpoint of CMV disease or death were compared using a log-rank test. Cumulative incidence distributions for CMV disease with death as a competing risk were compared using Gray’s test.
Figure 8
Figure 8. Weekly CMV VL kinetics in the prophylaxis trial.
CMV VL kinetics from time of randomization (week 0). (A and B) VL data are shown for patients who had not reached an endpoint of CMV disease or death by that week. GCV indicates patients in the ganciclovir treatment group (shown in red). Placebo indicates patients in the placebo treatment group (shown in blue). Error bars indicate 95% CI. The dashed horizontal line represents the limit of detection (LOD) of the CMV VL assay. (C) VL kinetics summary calculations were performed with the data shown in A and B. Box-and-whisker plots show the middle 50% of VL kinetics in gray boxes with a horizontal black line at the median. Whiskers indicate 1.5 times the IQR of the VL kinetics. P values were calculated from 2-tailed t tests comparing the means of the viral kinetics in ganciclovir (GCV) versus placebo groups.
Figure 9
Figure 9. Prentice criteria evaluation using multivariate logistic regression, proportion of treatment effect captured, and prediction accuracy for clinical outcomes with Super Learner in the prophylaxis trial.
(A) Forest plots of the OR for associations of VL kinetics with risk for CMV disease by week 24 after randomization were calculated from logistic regression models adjusted for baseline characteristics and treatment group. ORs for VL kinetics are indicated by navy dots surrounded by 95% CI indicated with navy lines; OR with 95% CI for treatment group assignment shown with light green dots and lines. Asterisks (*) indicate VL kinetics that met the Prentice criteria by multivariable logistic regression testing. The dashed vertical line indicates OR = 1. (B) The percentages of ganciclovir’s effect on clinical outcomes captured by the candidate surrogate were calculated using Kobayashi and Kuroki’s measure (23) and are shown for each of the VL kinetics indicated. (C) Receiver operating characteristic (ROC) curves are shown for Super Learner predictions for CMV disease by week 24 after randomization. The diagonal line drawn at y = x indicates the boundary above which ROC curves describe a prediction that is better than chance. (D) The Forest plot shows cross-validated area under the ROC curves (cv-AUC) of Super Learner predictions for CMV disease. The vertical line indicates cv-AUC = 50%, the area under the diagonal line in C. For C and D, predictions made only on data from the placebo group are in blue, from the ganciclovir group (GCV) in red, and from both treatment groups (All) in purple.

References

    1. Teira P, et al. Early cytomegalovirus reactivation remains associated with increased transplant-related mortality in the current era: a CIBMTR analysis. Blood. 2016;127(20):2427–2438. doi: 10.1182/blood-2015-11-679639. - DOI - PMC - PubMed
    1. Green ML, et al. Cytomegalovirus viral load and mortality after haemopoietic stem cell transplantation in the era of pre-emptive therapy: a retrospective cohort study. Lancet Haematol. 2016;3(3):e119–e127. doi: 10.1016/S2352-3026(15)00289-6. - DOI - PMC - PubMed
    1. Cantoni N, et al. Evidence for a bidirectional relationship between cytomegalovirus replication and acute graft-versus-host disease. Biol Blood Marrow Transplant. 2010;16(9):1309–1314. doi: 10.1016/j.bbmt.2010.03.020. - DOI - PubMed
    1. Nichols WG, Corey L, Gooley T, Davis C, Boeckh M. High risk of death due to bacterial and fungal infection among cytomegalovirus (CMV)-seronegative recipients of stem cell transplants from seropositive donors: evidence for indirect effects of primary CMV infection. J Infect Dis. 2002;185(3):273–282. doi: 10.1086/338624. - DOI - PubMed
    1. Young JH, et al. Infections after transplantation of bone marrow or peripheral blood stem cells from unrelated donors. Biol Blood Marrow Transplant. 2016;22(2):359–370. doi: 10.1016/j.bbmt.2015.09.013. - DOI - PMC - PubMed

Publication types