Comparative Study
. 2020 Sep 24;16(9):e1008817.
doi: 10.1371/journal.ppat.1008817. eCollection 2020 Sep.

Comparative assessment of multiple COVID-19 serological technologies supports continued evaluation of point-of-care lateral flow assays in hospital and community healthcare settings

Affiliations
Comparative Study

Comparative assessment of multiple COVID-19 serological technologies supports continued evaluation of point-of-care lateral flow assays in hospital and community healthcare settings

Suzanne Pickering et al. PLoS Pathog. .

Abstract

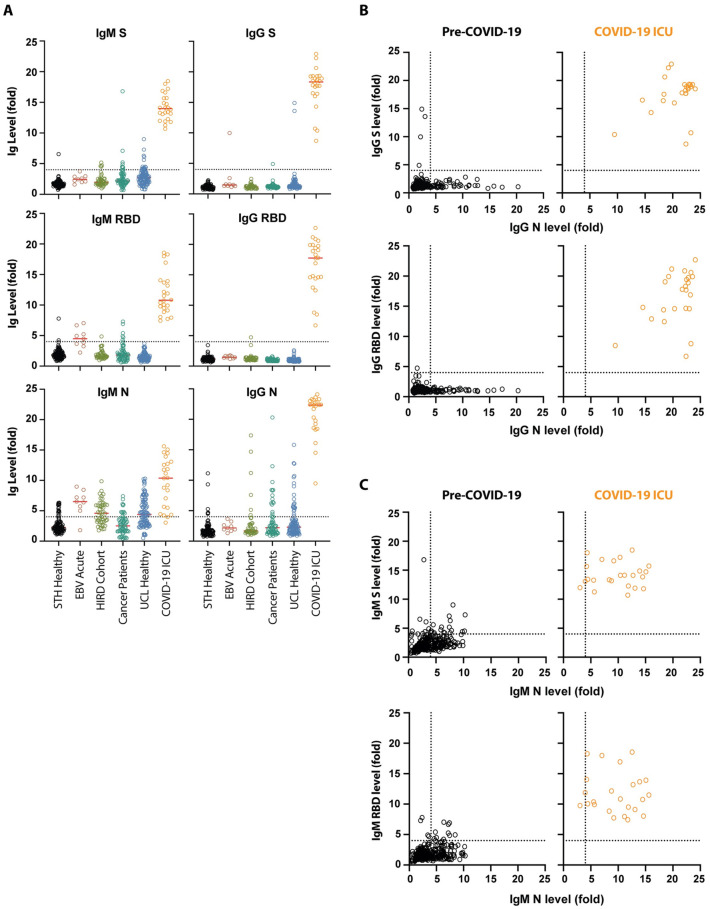
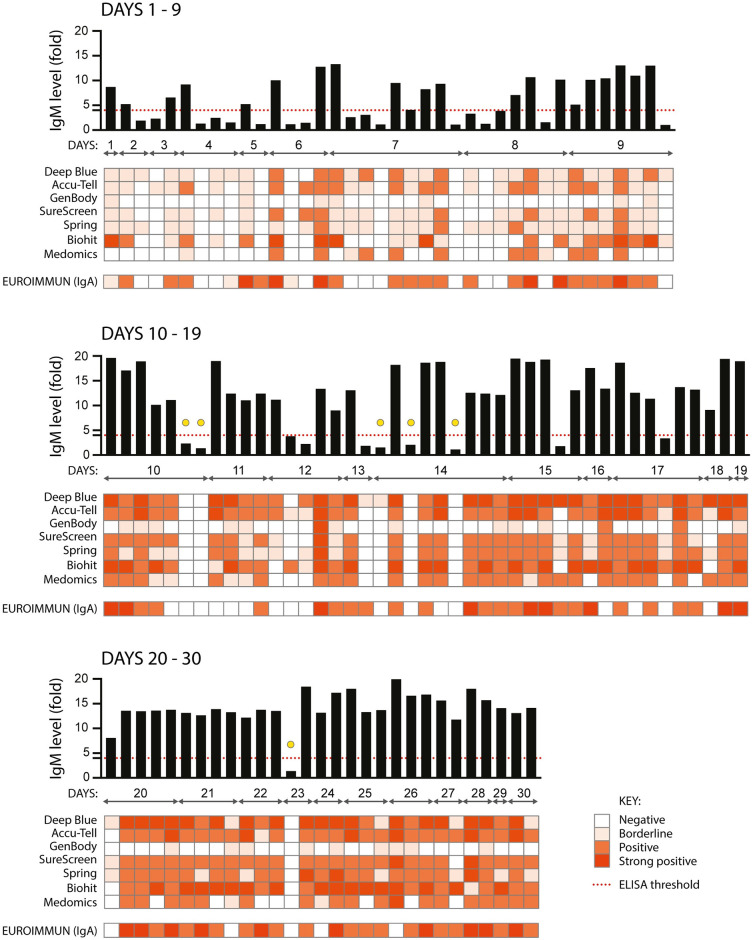
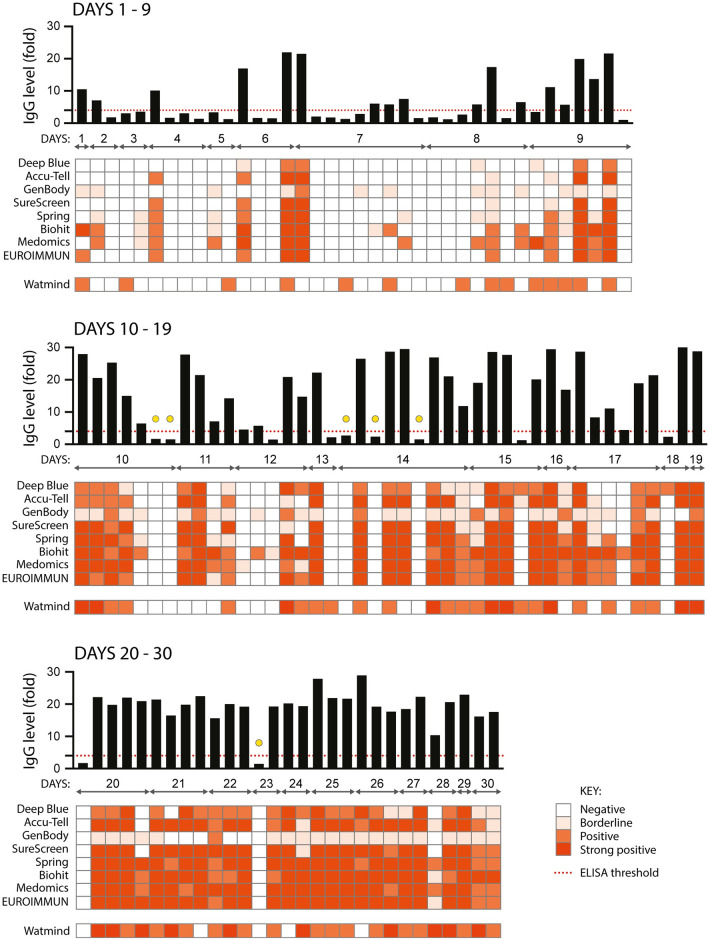
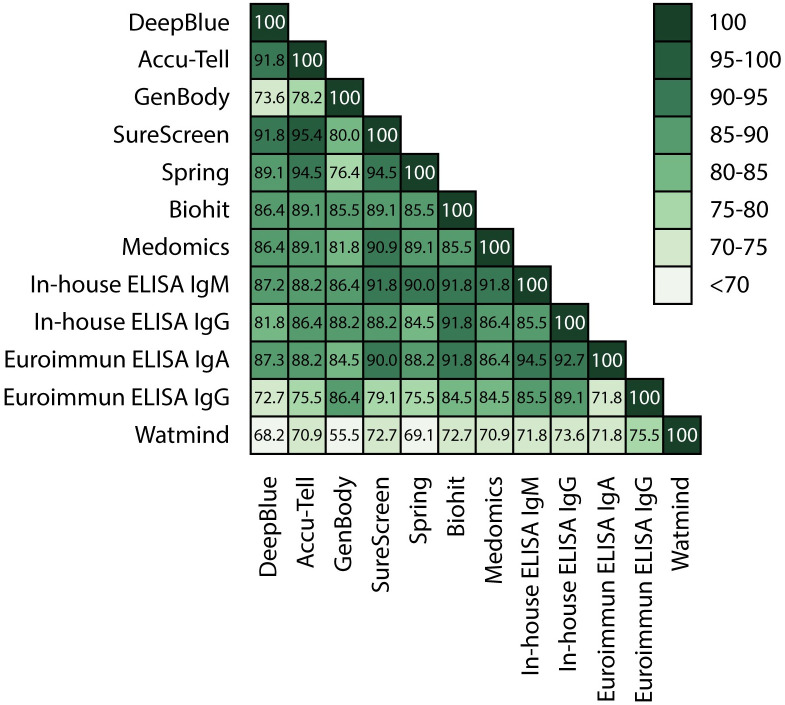
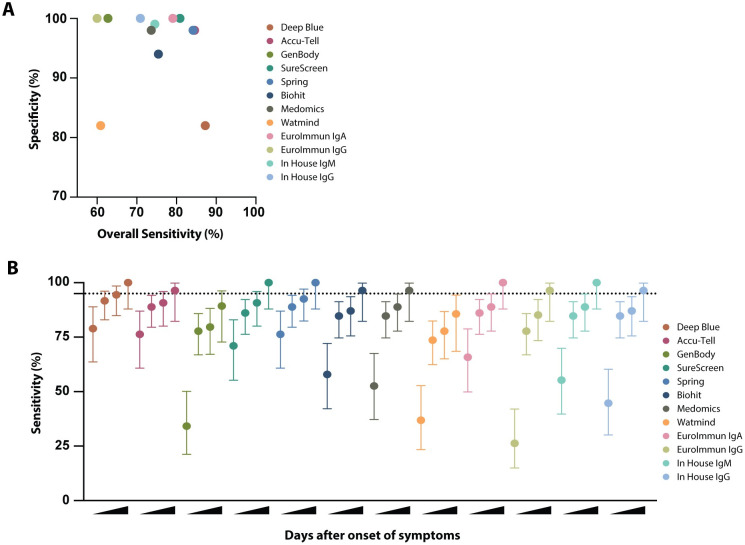
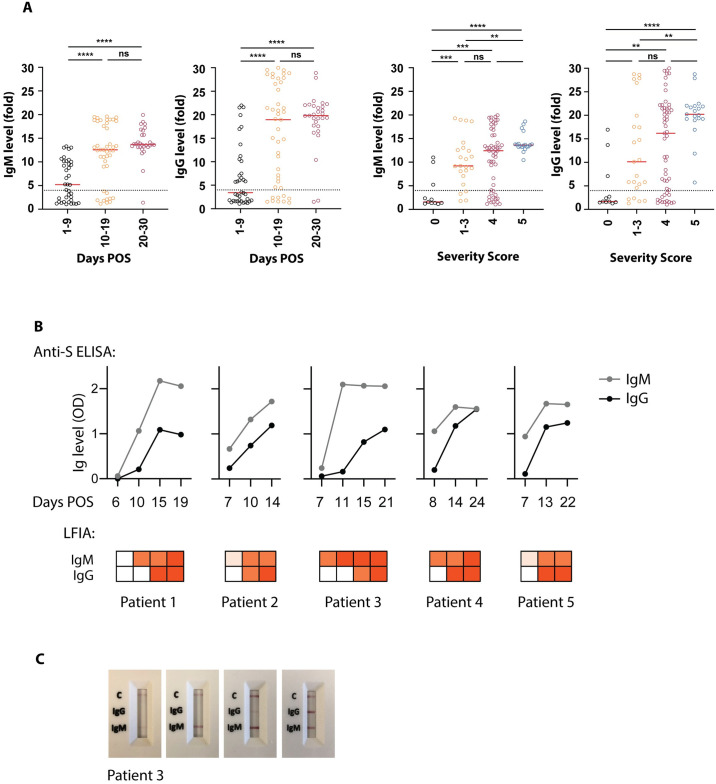
There is a clear requirement for an accurate SARS-CoV-2 antibody test, both as a complement to existing diagnostic capabilities and for determining community seroprevalence. We therefore evaluated the performance of a variety of antibody testing technologies and their potential use as diagnostic tools. Highly specific in-house ELISAs were developed for the detection of anti-spike (S), -receptor binding domain (RBD) and -nucleocapsid (N) antibodies and used for the cross-comparison of ten commercial serological assays-a chemiluminescence-based platform, two ELISAs and seven colloidal gold lateral flow immunoassays (LFIAs)-on an identical panel of 110 SARS-CoV-2-positive samples and 50 pre-pandemic negatives. There was a wide variation in the performance of the different platforms, with specificity ranging from 82% to 100%, and overall sensitivity from 60.9% to 87.3%. However, the head-to-head comparison of multiple sero-diagnostic assays on identical sample sets revealed that performance is highly dependent on the time of sampling, with sensitivities of over 95% seen in several tests when assessing samples from more than 20 days post onset of symptoms. Furthermore, these analyses identified clear outlying samples that were negative in all tests, but were later shown to be from individuals with mildest disease presentation. Rigorous comparison of antibody testing platforms will inform the deployment of point-of-care technologies in healthcare settings and their use in the monitoring of SARS-CoV-2 infections.


Conflict of interest statement

The authors have declared that no competing interests exist.

Figures

Fig 1
Fig 1. Validation of a SARS-CoV-2 ELISA for measuring IgG and IgM in Covid-19 patients.
(A) 320 pre-pandemic serum/plasma samples were assayed for IgM and IgG against SARS-CoV-2 stabilised and uncleaved S protein, the RBD from S, and N. Sera/plasma came from emergency admissions to St Thomas’ hospital in March 2019 (STH healthy, n = 105), individuals with acute EBV infection (n = 9), vaccine trials (HIRD cohort [16], n = 44), cancer patients (n = 61), and healthy volunteers (UCL healthy, n = 101). The IgM and IgG binding were compared to that of 24 SARS-CoV-2 PCR positive ICU patients collected in March and April 2020. Sera and plasma were diluted to 1:50 and 1:25 respectively. The values reported are the fold-change in OD above background. (B) Analysis of IgG binding of pre-Covid-19 human sera/plasma (n = 320) compared to sera from SARS-CoV-2 infected patients (n = 24) revealed that IgG against both N and S distinguished these two groups. The fold-change above background for IgG against N was plotted against the fold-change above background for S IgG binding and RBD IgG binding for each individual. (C) Analysis of IgM binding of pre-Covid-19 human sera/plasma (n = 320) compared to sera from SARS-CoV-2 infected patients (n = 24).
Fig 2
Fig 2. Comparison of nine serological assays for the detection of anti-SARS CoV-2 IgM and IgA.
110 serum samples from 87 individuals with confirmed SARS-CoV-2 infection (RNA+ by RT-PCR) were assayed for anti-SARS CoV-2 IgM using an in-house anti-S ELISA (shown in the graph across the top of each panel, black bars), seven colloidal gold lateral flow tests (Deep Blue, Accu-Tell, GenBody, SureScreen, Spring, Biohit and Medomics), and for anti-S1 IgA using a commercial ELISA (EUROIMMUN). The threshold for a positive result in the in-house ELISA is set at 4-fold above background, as indicated by the red dashed line. Results for the other tests are represented as heatmaps, with colour intensity corresponding to strength of signal for each test. For EUROIMMUN, scores of <0.8 are negative, ≥0.8 to <1.1 are borderline, ≥1.2 to <4 are positive, and ≥4 are strong positive. Samples are grouped according to days post onset of COVID-19 symptoms, and squares aligned in columns under each bar of the graph show results for a single serum sample. Yellow circles indicate samples from 10 days or more POS that were negative by ELISA and in at least 6 other tests, as detailed in the text.
Fig 3
Fig 3. Comparison of ten serological assays for the detection of anti-SARS CoV-2 IgG.
As for in Fig 2, the same 110 serum samples were assessed for the presence of anti-SARS CoV-2 IgG. Each sample was assayed using an in-house anti-S ELISA (shown in the graph across the top of each panel, black bars), seven colloidal gold lateral flow tests (Deep Blue, Accu-Tell, GenBody, SureScreen, Spring, Biohit and Medomics), and a commercial ELISA (EUROIMMUN). A chemiluminescent assay for total anti-SARS CoV-2 IgM, IgG and IgA (Watmind) was also included. The threshold for a positive result in the in-house ELISA is set at 4-fold above background, as indicated by the red dashed line. Results for the other tests are represented as heatmaps, with colour intensity corresponding to strength of signal for each test. For EUROIMMUN, scores of <0.8 are negative, ≥0.8 to <1.1 are borderline, ≥1.2 to <4 are positive, and ≥4 are strong positive. For Watmind, scores <1 are negative, >1 to <10 are positive, and >10 to 100 are strong positive. Yellow circles indicate samples from 10 days or more POS that were negative by ELISA and in all commercial tests.
Fig 4
Fig 4. Comparative tables.
Serological assays were compared and the percentage agreement between the results of each of the samples in the assays is represented within each box.
Fig 5
Fig 5. Sensitivity and specificity comparison of serological assays.
(A) Specificity was determined for each serological assay using a panel of 50 pre-pandemic serum samples the St Thomas’ emergency admissions cohort (STH Healthy, March 2019). Overall sensitivity was determined for each serological assay, based on results for 110 serum samples from known SARS-CoV-2-positive individuals (shown in Figs 3 and 4). For the lateral flow assays, a positive result for IgM, IgG or both is considered positive. For the EUROIMMUN and in-house ELISAs, sensitivities for IgA, IgM and IgG are calculated separately. (B) Sensitivity and 95% confidence intervals (vertical lines) were determined for each serological assay at increasing days POS. 95% sensitivity is indicated by the horizontal dashed line. Results for each test were categorised according to whether the serum sample was from <10, ≥10, ≥14, or ≥20 days POS.
Fig 6
Fig 6. Antibody detection over increasing days POS and illness severity.
(A) In-house ELISA results for anti-SARS-CoV-2 IgM and IgG were grouped by days POS and severity of illness, with 0 indicating mild illness (requiring no respiratory support) and 5 indicating critical (requiring ECMO) (see materials and methods for full classification). The 4-fold threshold for a positive result is shown as a dashed line on each graph. Median values are shown as red lines. (B) Sequential serum samples from five individuals were assayed for the development of anti-SARS-CoV-2 IgM and IgG. All five individuals were hospitalised with COVID-19 symptoms and confirmed positive for SARS-CoV-2 RNA by RT-PCR. A semi-quantitative in-house ELISA detecting anti-S antibodies (shown in graphs) and the SureScreen lateral flow assay (shown in heatmaps below the graphs) were compared for their detection of anti-SARS-CoV-2 in the same serum samples. Days POS are indicated for each sample. (C) Images of the lateral flow test results for patient 3 are shown.

References

    1. NHS. Guidance and Standard Operating Procedure COVID-19 Virus Testing in NHS Laboratories (https://www.rcpath.org/uploads/assets/90111431-8aca-4614-b06633d07e2a3dd...)
    1. Centers for Disease Control and Prevention. Interim Guidelines for Collecting, Handling, and Testing Clinical Specimens for COVID-19 (https://www.cdc.gov/coronavirus/2019-nCoV/lab/guidelines-clinical-specim...)
    1. To KK, Tsang OT, Leung WS, Tam AR, Wu TC, Lung DC, et al. Temporal profiles of viral load in posterior oropharyngeal saliva samples and serum antibody responses during infection by SARS-CoV-2: an observational cohort study. Lancet Infect Dis. 2020;20(5):565–74. - PMC - PubMed
    1. Zou L, Ruan F, Huang M, Liang L, Huang H, Hong Z, et al. SARS-CoV-2 Viral Load in Upper Respiratory Specimens of Infected Patients. N Engl J Med. 2020;382(12):1177–9. - PMC - PubMed
    1. Verdoni L, Mazza A, Gervasoni A, Martelli L, Ruggeri M, Ciuffreda M, et al. An outbreak of severe Kawasaki-like disease at the Italian epicentre of the SARS-CoV-2 epidemic: an observational cohort study. Lancet. 2020. - PMC - PubMed

Publication types

MeSH terms

Substances