. 2021 Jan 4;218(1):e20192378.
doi: 10.1084/jem.20192378.

Spatiotemporal restriction of endothelial cell calcium signaling is required during leukocyte transmigration

Affiliations

Spatiotemporal restriction of endothelial cell calcium signaling is required during leukocyte transmigration

Prarthana J Dalal et al. J Exp Med. .

Abstract

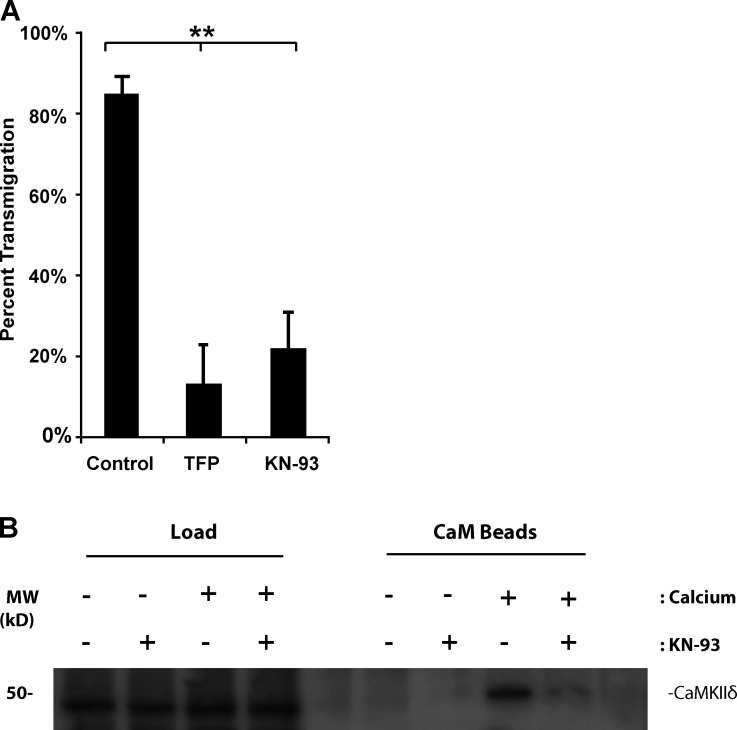
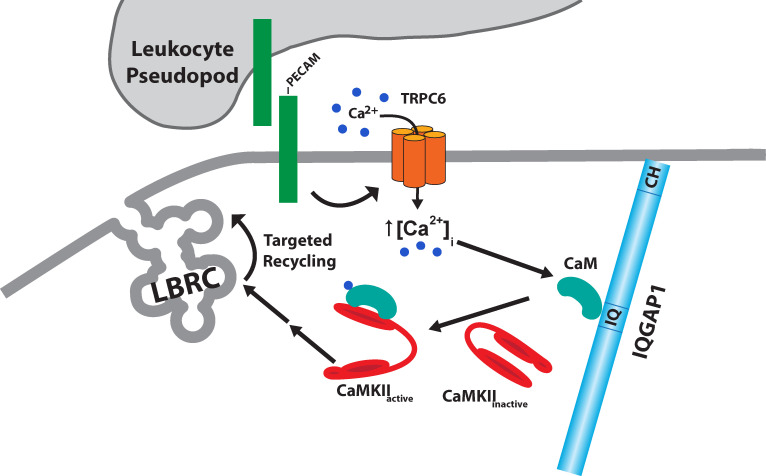
Endothelial cell calcium flux is critical for leukocyte transendothelial migration (TEM), which in turn is essential for the inflammatory response. Intravital microscopy of endothelial cell calcium dynamics reveals that calcium increases locally and transiently around the transmigration pore during TEM. Endothelial calmodulin (CaM), a key calcium signaling protein, interacts with the IQ domain of IQGAP1, which is localized to endothelial junctions and is required for TEM. In the presence of calcium, CaM binds endothelial calcium/calmodulin kinase IIδ (CaMKIIδ). Disrupting the function of CaM or CaMKII with small-molecule inhibitors, expression of a CaMKII inhibitory peptide, or expression of dominant negative CaMKIIδ significantly reduces TEM by interfering with the delivery of the lateral border recycling compartment (LBRC) to the site of TEM. Endothelial CaMKII is also required for TEM in vivo as shown in two independent mouse models. These findings highlight novel roles for endothelial CaM and CaMKIIδ in transducing the spatiotemporally restricted calcium signaling required for TEM.


Conflict of interest statement

Disclosures: I.M. Grumbach reported grants from the National Institutes of Health, the Department of Veterans Affairs, and the American Heart Association outside the submitted work. No other disclosures were reported.

Figures

Figure 1.
Figure 1.
Local endothelial cell calcium influx is associated with in vivo neutrophil TEM. (A) Mice expressing the calcium sensor GCaMP3 specifically in endothelial cells (VE-Cadherin Cre GCaMP3fl/fl) were lethally irradiated and their bone marrow reconstituted from CatchUpIVM with red fluorescent neutrophils. After allowing reconstitution, inflammation was induced by intrascrotal injection of IL-1β. Nonblocking fluorophore-conjugated anti-PECAM (blue) was also coinjected to visualize the vasculature. 4 h after the injection, the cremaster muscle was exteriorized and prepared for confocal intravital microscopy as detailed in the Materials and methods. The images shown are Z-projections of the 3D stacks. A full-length video is included in the supplemental material (Video 1). Arrows denote neutrophils in the process of TEM. Endothelial cell calcium influx is associated with neutrophil TEM and is localized around the transmigratory pore. Insets display a magnified view of the local PECAM pore and calcium influx. 12 mice were studied. Scale bar is 50 µm. (B) Inflammation was induced in VE-Cadherin Cre GCaMP3fl/fl mice by intrascrotal injection of IL-1β. Nonblocking fluorophore-conjugated anti-PECAM (red) and fluorescently conjugated anti-CD18 (blue) were coinjected to visualize the vasculature and circulating neutrophils, respectively. This additional approach provided validation of our adoptive bone marrow transfer model. 4 h after the injection, the cremaster muscle was exteriorized and prepared for confocal intravital microscopy as detailed in the Materials and methods. The images shown are Z-projections of the 3D stacks. A full-length video is included in the supplemental material (Video 2). Arrows denote neutrophils in the process of TEM. Endothelial cell calcium influx is associated with neutrophil TEM and is localized around the transmigratory pore. Insets display a magnified view of the local calcium influx. Scale bar is 10 µm. (C) Each colored line represents a separate transmigration event where the calcium signal was quantitated. Mean fluorescence intensity of the region of interest (dotted lines in A and B) was calculated, background corrected, and normalized to baseline as described in the Materials and methods. The beginning and completion of TEM were defined by the PECAM gap. Eight independent TEM events are shown here. (D) Intravital microscopy videos of inflammation in mice expressing the calcium sensor GCaMP3 restricted to endothelial cells were analyzed. For axial profile analysis, a 15-µm line (shown as the dotted red line) was drawn centered on the pore of a TEM event, and the pixel intensity along that line was recorded for the green channel (GCaMP3 signal). The same line was used to analyze pixel intensity for the GCaMP3 signal when the leukocyte was adherent to the endothelium before the TEM event. The individual lines were adjusted slightly to account for variations in the center of the pore. The plots were normalized to the minimum intensity value proximal to the pore. Note that this makes the relative intensities for the plots similar at the proximal 0-µm end of the plot, but retains meaningful information regarding the axial profile of the GCaMP3 signal. Five separate TEM events are shown here.
Figure 2.
Figure 2.
The IQ domain of IQGAP1 interacts with CaM in endothelial cells. (A) Schematic showing the two IQGAP1 domain truncation constructs fused to GFP. GRD, RasGAP-related domain; IQ, IQ motifs domain; RGCT, RasGAP C-terminus; WW, tandem tryptophan-containing domain. (B) The GFP-tagged IQGAP1 domain truncation constructs shown in A were transduced into iHUVECs grown on 60-mm tissue culture plates. After 2 d of expression, the cells were lysed in either the presence of CaCl2 or EGTA. The protein lysates were then incubated with CaM Sepharose beads, and the beads were then eluted in 6× Laemmli buffer to be probed using Western blotting as described in the Materials and methods. The blot shown here was probed for IQGAP1. Both endogenous (Endog.) full-length IQGAP1 and construct Δ5,6 interact with CaM. However, construct Δ4–6, which lacks the IQ domain, cannot bind CaM in either the presence or the absence of calcium. Three separate experiments were performed. MW, molecular weight.
Figure 3.
Figure 3.
CaM interacts with CaMKIIδ in the presence of calcium and inhibiting CaM, or CaMKII activity significantly reduces monocyte TEM. (A) Monocyte transmigration across iHUVECs pretreated with either 100 µM TFP or 10 µM KN-93 is substantially reduced when compared with monocyte transmigration across untreated iHUVEC monolayers. Data represent the average and standard deviation of three independent experiments. Each experiment comprises at least two samples with >50 leukocytes scored per sample for each condition. ** denotes P value < 0.01 with Student’s t test. (B) iHUVECs grown on 60-mm tissue culture plates were left untreated or were treated with 10 µM KN-93 for 30 min as described in the Materials and methods. After extensive washing, the endothelial cells were lysed in the presence of either CaCl2 or EGTA. The protein lysates were then incubated with CaM Sepharose beads, and the beads were eluted in 6× Laemmli buffer to be probed using Western blotting as described in the Materials and methods. The blot shown here was probed for CaMKIIδ. CaMKIIδ interacts with CaM in the presence of calcium but not in the absence of calcium. Furthermore, the interaction between CaM and CaMKIIδ even in the presence of calcium can be attenuated by pretreating with KN-93, and this also prevents monocyte transmigration as shown in A. Three separate experiments were performed. MW, molecular weight.
Figure 4.
Figure 4.
A small peptide inhibitor of CaMKII substantially reduces monocyte TEM. (A) iHUVECs were transduced with CaMKIIN. 2 d after transduction, cells were lysed and their protein content resolved using SDS-PAGE and probed with Western blotting. Control (Cont) is shown for reference. GAPDH is shown as the loading control. (B) iHUVECs were fixed, permeabilized, stained for HA and VE-cadherin, and visualized using confocal immunofluorescence microscopy. Scale bar is 10 µm. (C) Monocyte transmigration across iHUVECs grown on collagen gels transduced with CaMKIIN is shown. The mouse anti-human PECAM antibody hec7 was included as a control. Data represent the average and standard deviation of three independent experiments. Each experiment comprises at least three samples with >50 leukocytes scored per sample for each condition. ** denotes P value < 0.01 with Student’s t test. MW, molecular weight.
Figure 5.
Figure 5.
Dominant negative CaMKIIδ markedly reduces monocyte TEM. (A) iHUVECs were transduced with dominant negative CaMKIIδ. 2 d after transduction, cells were lysed and their protein content resolved using SDS-PAGE and probed with Western blotting. Control (Cont) is shown for reference. GAPDH is shown as the loading control. (B) iHUVECs were fixed, permeabilized, stained for HA and VE-cadherin, and visualized using confocal immunofluorescence microscopy. Scale bar is 10 µm. (C) Monocyte transmigration across iHUVECs grown on collagen gels and transduced with dominant negative (DN) CaMKIIδ is shown. The mouse anti-human PECAM antibody hec7 was included as a control. Data represent the average and standard deviation of three independent experiments. Each experiment comprises at least three samples with >50 leukocytes scored per sample for each condition. ** denotes P value < 0.01 with Student’s t test. MW, molecular weight.
Figure 6.
Figure 6.
CaMKIIδ is required for targeted recycling of the LBRC. (A) iHUVECs grown on collagen gels and transduced with dominant negative (DN) CaMKIIδ as in Fig. 4 were subjected to the targeted recycling assay (described in the Materials and methods). This assay follows the recruitment of the LBRC to the site of transmigration. Using immunofluorescence microscopy, recycled LBRC is visualized as increased fluorescence adjacent to transmigrating monocytes. The arrow in the control panel highlights LBRC recruitment adjacent to the transmigrating monocyte while the arrow in the dominant negative panel highlights the notable absence of LBRC recruitment. Images shown here are representative of three independent experiments. Scale bar is 10 µm. (B) Quantification of the monocyte position and LBRC recruitment shown in A. Monocytes were considered at the junction if they overlapped at all with the endothelial cell (EC) junctions in the x-y plane. Data shown here are the average and standard deviation of three independent experiments. Each experiment had at least 50 monocytes scored. Data from each experiment were normalized to the total adherent cells to account for subtle differences in adhesion on each monolayer. ** denotes P value < 0.01 with Student’s t test.
Figure 7.
Figure 7.
Inhibiting CaMKII in vivo significantly reduces neutrophil TEM. (A) iVE-Cre CaMKIINfl/fl mice were injected for 5 d consecutively with either tamoxifen or corn oil (control) as described in the Materials and methods. After allowing for a 1-wk recovery period, one ear of each mouse was treated topically with croton oil in an acetone:olive oil carrier while the other ear was treated topically with carrier alone. After 5 h, the mice were sacrificed and their ears were processed for immunofluorescence imaging using confocal microscopy on whole-mount specimens. Representative images from control and CaMKIIN-expressing (tamoxifen-injected) mice are shown. Neutrophils and endothelial cell junctions were visualized with antibodies against MRP14 (blue) and PECAM (red), respectively. Insets show the orthogonal view at the position denoted by the dashed line. Orthogonal inset 1 shows three leukocytes (i–iii) outside the blood vessel. Orthogonal insets 2 and 3 show two leukocytes arrested on the apical surface (iv and v). Scale bar is 10 µm. (B) Schematic of the neutrophil positional scoring system used to quantify the locations of neutrophils observed in A. (C) Quantification of the total number of neutrophils per field. Data shown are the average and standard deviations of the three independent experiments. Only neutrophils within 50 µm of the vessel were scored. (D) Quantification of the leukocyte positions from the images collected in A. Data shown are the average and standard deviations from three separate experiments. At least five fields with at least 100 neutrophils for each mouse were analyzed. Data shown do not include data for the neutrophils found in the luminal position. ** denotes P value < 0.01 with Student’s t test. Carrier-only ears showed no signs of inflammation, and neutrophils were rarely found in the tissue or associated with the vessels (data not shown).
Figure S1.
Figure S1.
Tamoxifen induces endothelial cell CaMKIIN expression in vivo. The inducible VE-Cadherin CaMKIIN mice expressed a floxed eGFP sequence upstream of a stop codon followed by an HA-tagged CaMKII inhibitor peptide, CaMKIIN (HA-tagged CaMKIIN). Once Cre recombinase activity was induced with tamoxifen, the floxed GFP/stop codon sequence was excised, allowing expression of CaMKIIN selectively in endothelial cells. (A) Immunofluorescence of whole mount of the control aorta shows absence of HA-tagged CaMKIIN staining in control endothelial cells. (B) Immunofluorescence of whole mount of the aorta of mice injected with tamoxifen shows that expression of HA-tagged CaMKIIN is indeed specifically induced in endothelial cells. Furthermore, CaMKIIN expression does not have any effect on endothelial cell morphology or PECAM expression. At least three fields from three independent experiments were evaluated, and representative images are shown. Scale bar is 10 µm.
Figure S2.
Figure S2.
Tamoxifen induces deletion of CaMKIIδ in endothelial cells in vivo. The inducible VE-Cadherin CaMKIIδfl/fl mice exhibit selective deletion of CaMKIIδ in endothelial cells after induction of the Cre recombinase with tamoxifen. (A) Immunofluorescence of the whole mount of the control aorta demonstrates CaMKIIδ expression in endothelial cells. (B) Immunofluorescence of whole mount of the aorta after tamoxifen injections shows that expression of CaMKIIδ is specifically deleted in endothelial cells. Residual staining that appears as streaks in the tamoxifen-treated, CaMKIIδ-stained sample is an artifact created by folds during the tissue mounting process and not residual expression. Furthermore, deletion of CaMKIIδ does not have any effect on endothelial cell morphology or PECAM expression. At least three fields from three independent experiments were evaluated, and representative images are shown. Scale bar is 10 µm.
Figure 8.
Figure 8.
CaMKIIδ is required for neutrophil TEM in vivo. (A) iVE-Cre CaMKIIδfl/fl mice were injected for 5 d consecutively with either tamoxifen or corn oil as described in the Materials and methods. After allowing for a 1-wk recovery period, one ear of each mouse was treated topically with croton oil in an acetone:olive oil carrier while the other ear was treated topically with carrier alone. After 5 h, the mice were sacrificed and their ears processed for immunofluorescence imaging using confocal microscopy. Representative images from control and endothelial cell CaMKIIδ knockout mice are shown. Here, neutrophils, endothelial cell junctions, and basement membranes were visualized with antibodies against MRP14 (green), PECAM (red), and collagen IV (blue), respectively. Insets show the orthogonal view at the position denoted by the dashed line. Orthogonal inset 1 shows two leukocytes (i and ii) outside the blood vessel and basement membrane. Orthogonal insets 2 and 3 show three leukocytes arrested on the apical surface (iii–v). Scale bar is 10 µm. (B) Schematic of the neutrophil positional scoring system used to quantify the locations of neutrophils observed in A. (C) Quantitation of the total number of neutrophils per field. Only neutrophils within 50 µm of the vessel were scored. Data shown are the average and standard deviations of the three independent experiments. (D) Quantitation of the leukocyte positions from the images collected in A. Data shown are the average and standard deviations collected from three separate experiments. At least five fields with at least 100 neutrophils for each mouse were analyzed. Data shown do not include data for the neutrophils found in the luminal position. ** denotes P value <0.01 with Student’s t test. Carrier-only ears showed no signs of inflammation, and neutrophils were rarely found in the tissue or associated with the vessels (data not shown).
Figure 9.
Figure 9.
Schematic illustrating mechanism of endothelial cell calcium signaling during TEM. The endothelial cell calcium signaling pathway is activated by homophilic PECAM–PECAM interactions. This leads to activation of TRPC6 and an influx of calcium. The CHD helps enrich IQGAP1 at the junction, allowing CaM bound to the IQ domain to be locally concentrated for the calcium influx. The local influx of calcium allows CaM to then activate CaMKIIδ. CaMKIIδ subsequently mediates targeted delivery of the LBRC to facilitate TEM. Note that CaMKII is shown as a monomer for clarity.

References

    1. Akerboom, J., Rivera J.D., Guilbe M.M., Malavé E.C., Hernandez H.H., Tian L., Hires S.A., Marvin J.S., Looger L.L., and Schreiter E.R.. 2009. Crystal structures of the GCaMP calcium sensor reveal the mechanism of fluorescence signal change and aid rational design. J. Biol. Chem. 284:6455–6464. 10.1074/jbc.M807657200 - DOI - PMC - PubMed
    1. Ali, J., Liao F., Martens E., and Muller W.A.. 1997. Vascular endothelial cadherin (VE-cadherin): cloning and role in endothelial cell-cell adhesion. Microcirculation. 4:267–277. 10.3109/10739689709146790 - DOI - PubMed
    1. Ancuta, P., Rao R., Moses A., Mehle A., Shaw S.K., Luscinskas F.W., and Gabuzda D.. 2003. Fractalkine preferentially mediates arrest and migration of CD16+ monocytes. J. Exp. Med. 197:1701–1707. 10.1084/jem.20022156 - DOI - PMC - PubMed
    1. Boulay, G. 2002. Ca(2+)-calmodulin regulates receptor-operated Ca(2+) entry activity of TRPC6 in HEK-293 cells. Cell Calcium. 32:201–207. 10.1016/S0143416002001550 - DOI - PubMed
    1. Brooks, I.M., and Tavalin S.J.. 2011. Ca2+/calmodulin-dependent protein kinase II inhibitors disrupt AKAP79-dependent PKC signaling to GluA1 AMPA receptors. J. Biol. Chem. 286:6697–6706. 10.1074/jbc.M110.183558 - DOI - PMC - PubMed

Publication types

MeSH terms

Substances