. 2020 Dec 7;217(12):e20190706.
doi: 10.1084/jem.20190706.

The GM-CSF-IRF5 signaling axis in eosinophils promotes antitumor immunity through activation of type 1 T cell responses

Affiliations

The GM-CSF-IRF5 signaling axis in eosinophils promotes antitumor immunity through activation of type 1 T cell responses

Isabelle C Arnold et al. J Exp Med. .

Abstract

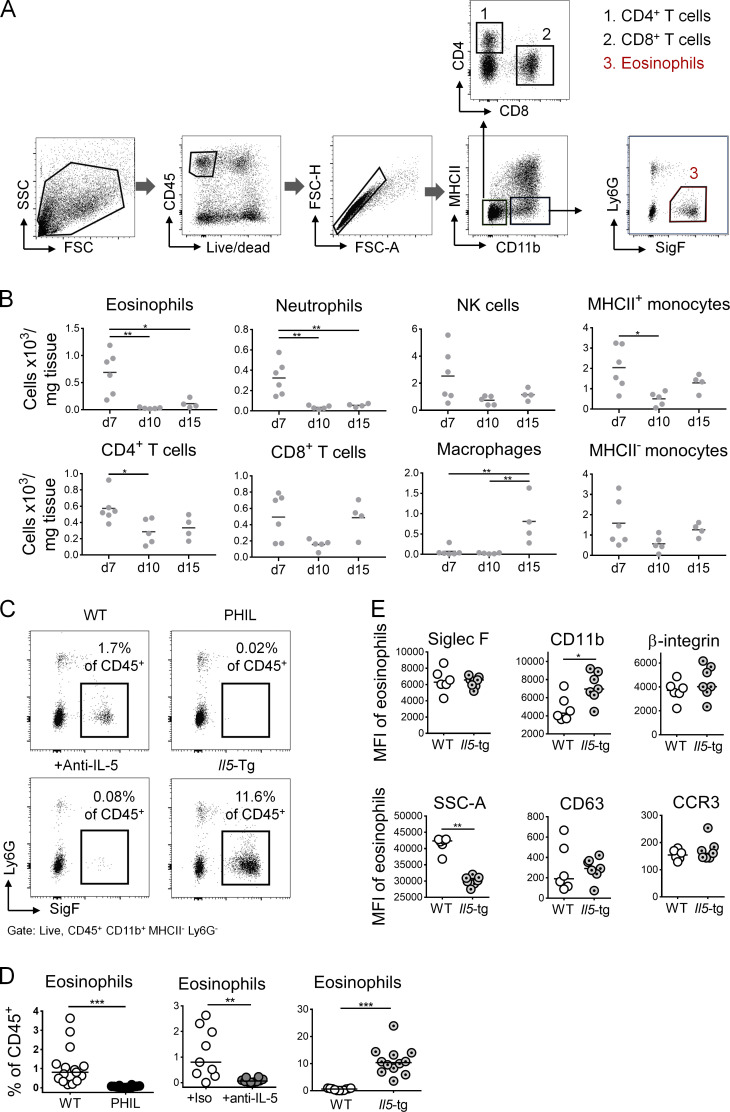
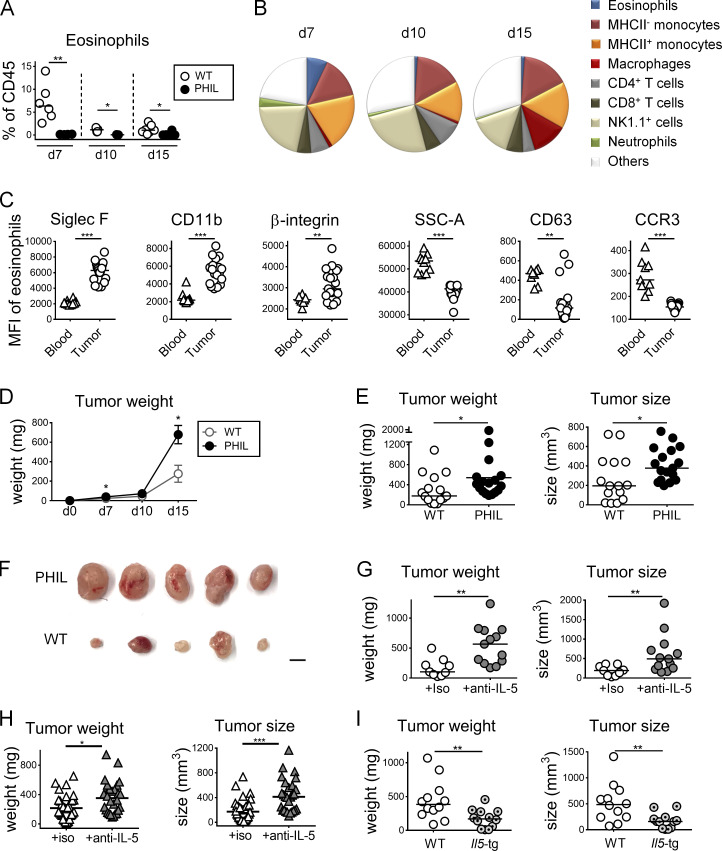
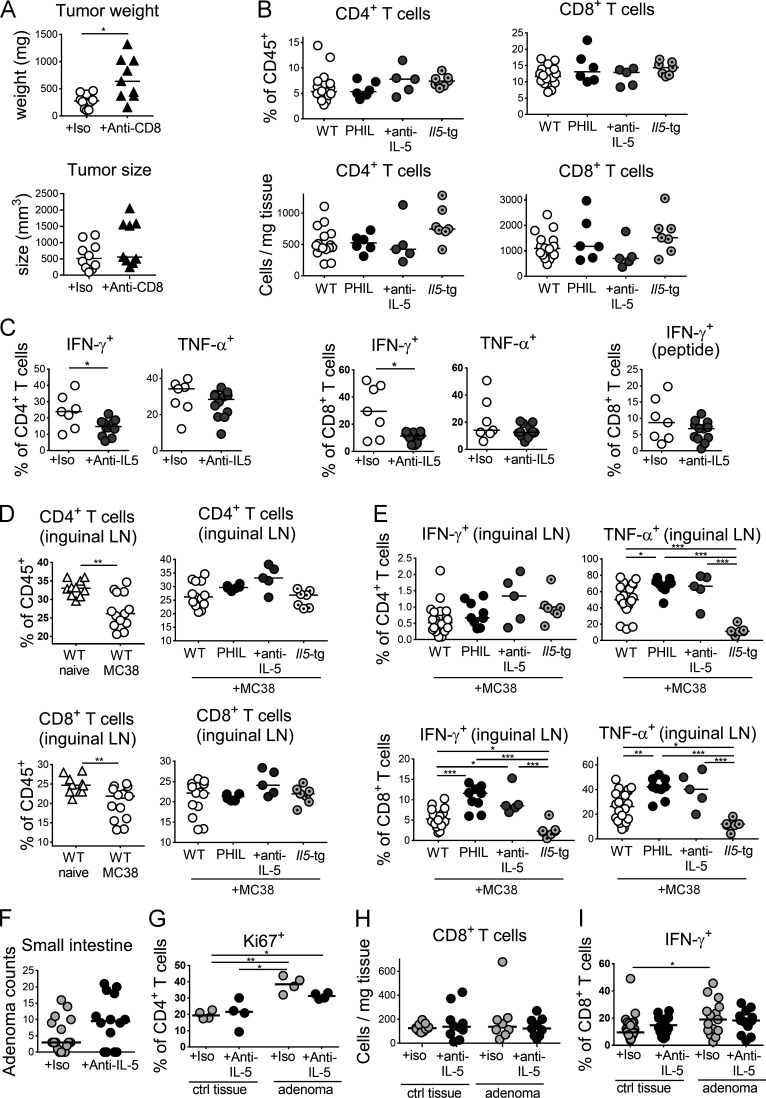
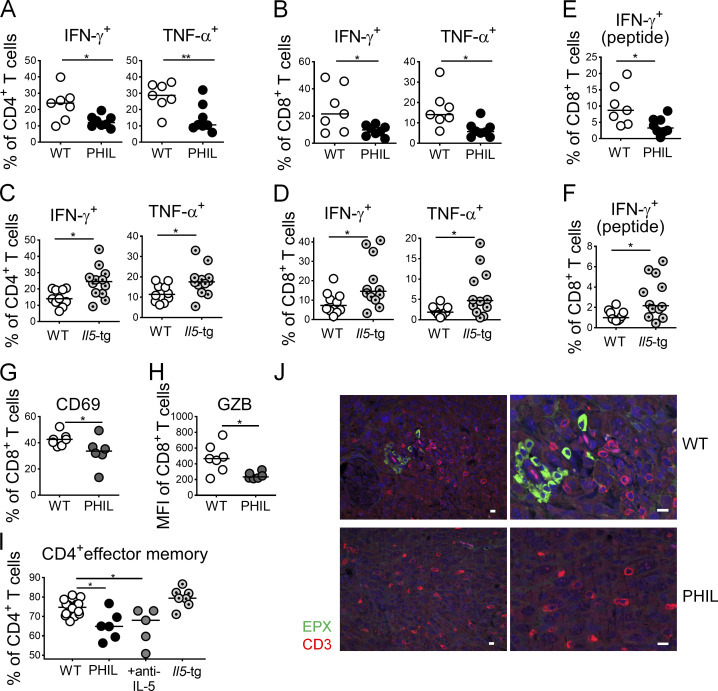
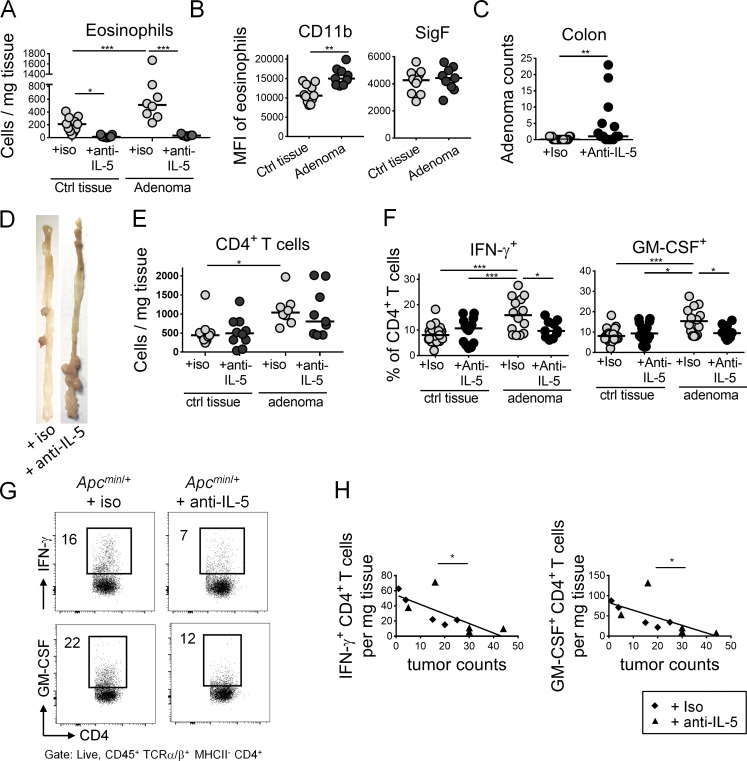
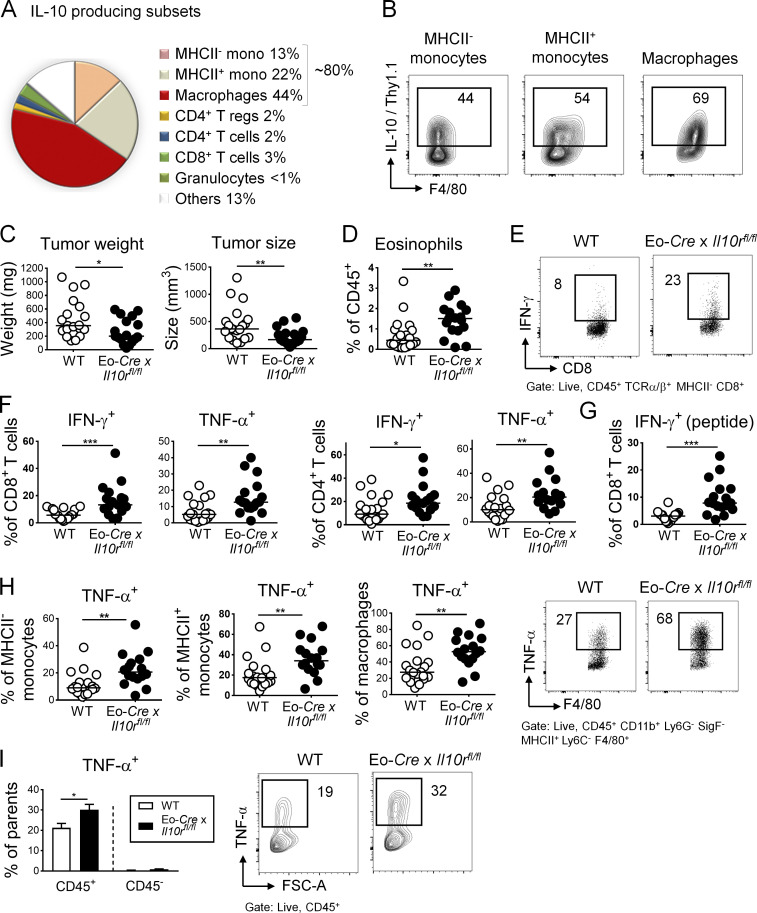
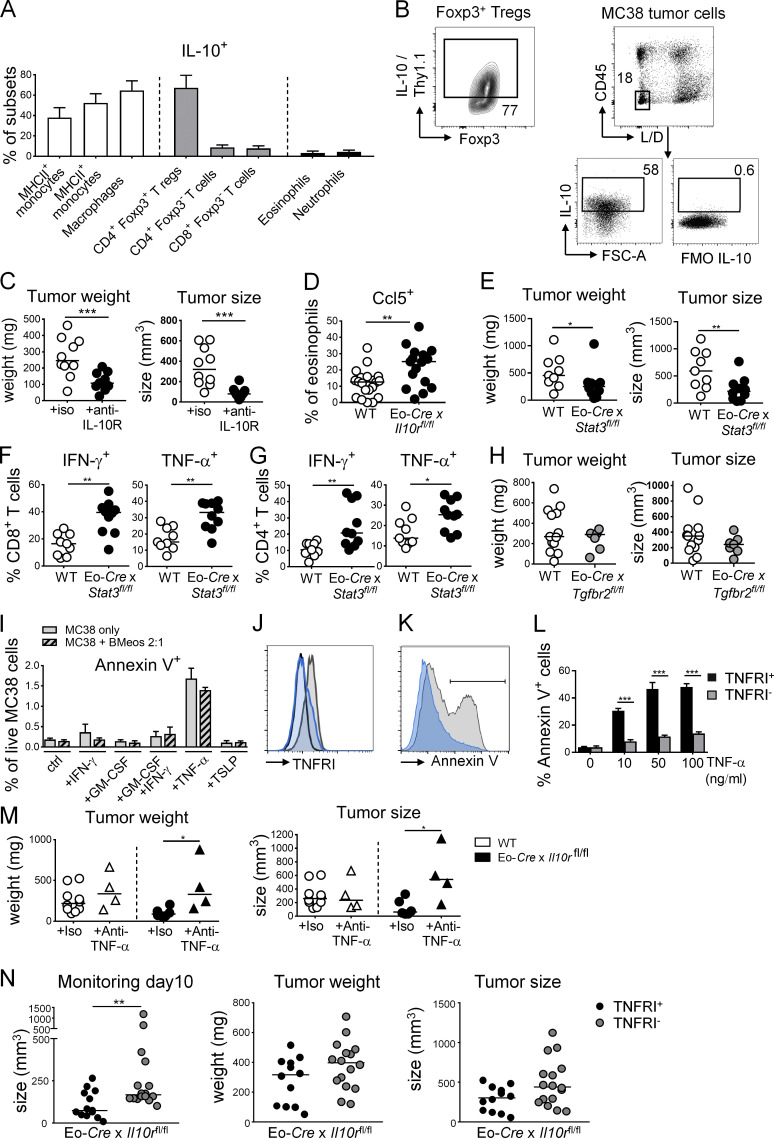
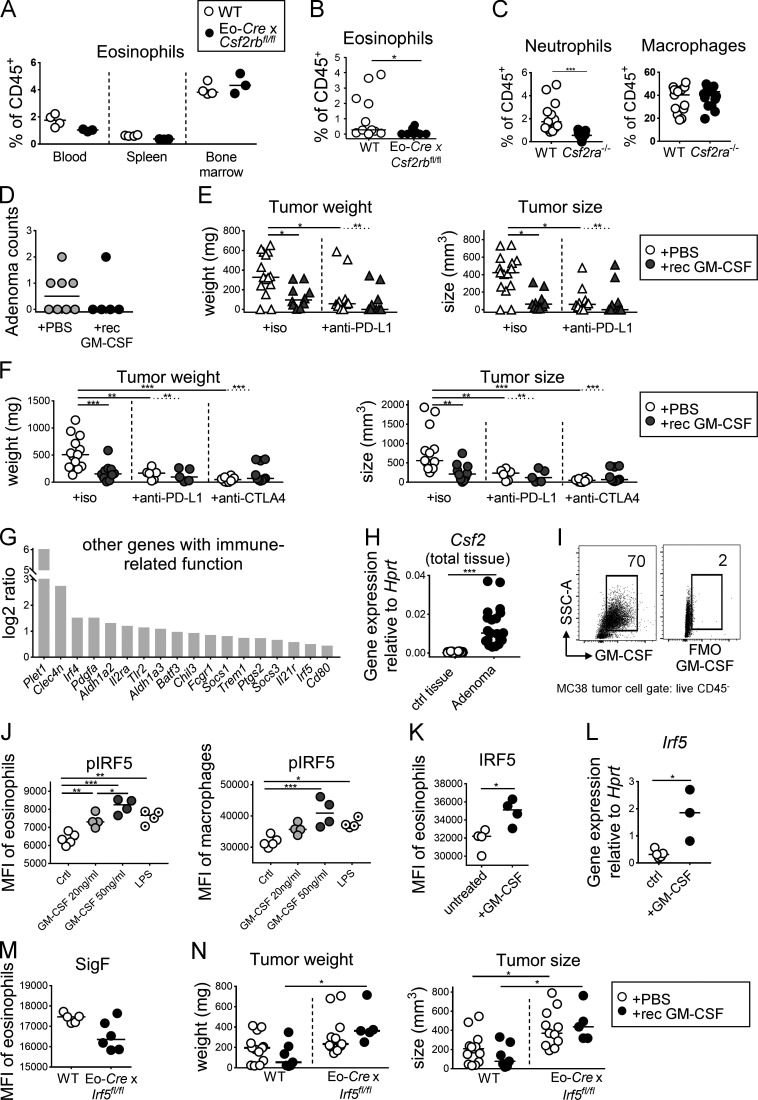
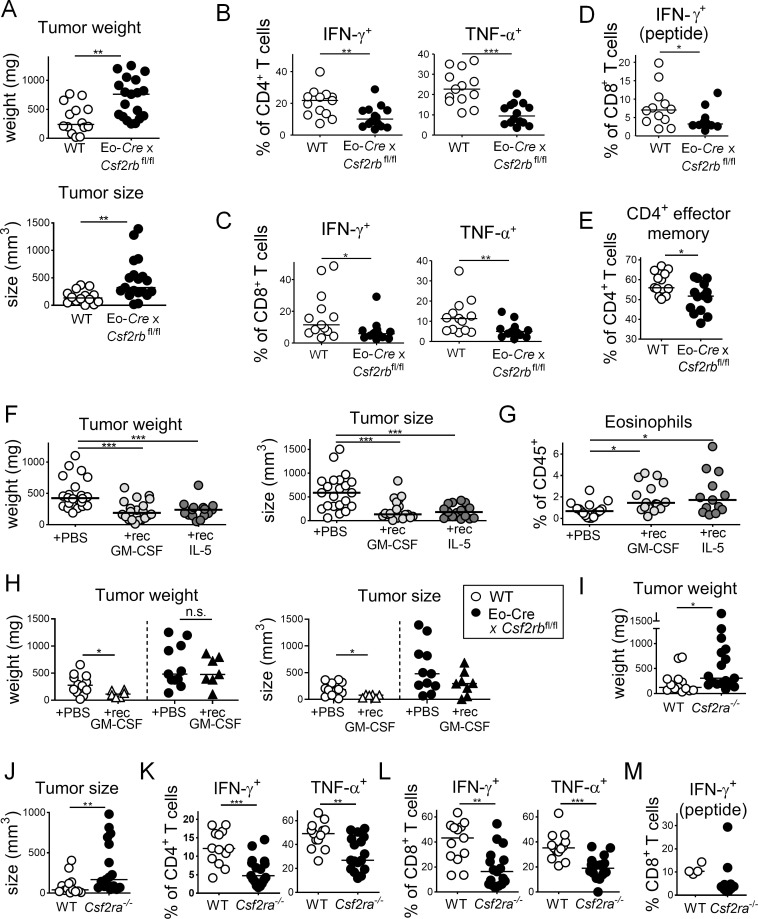
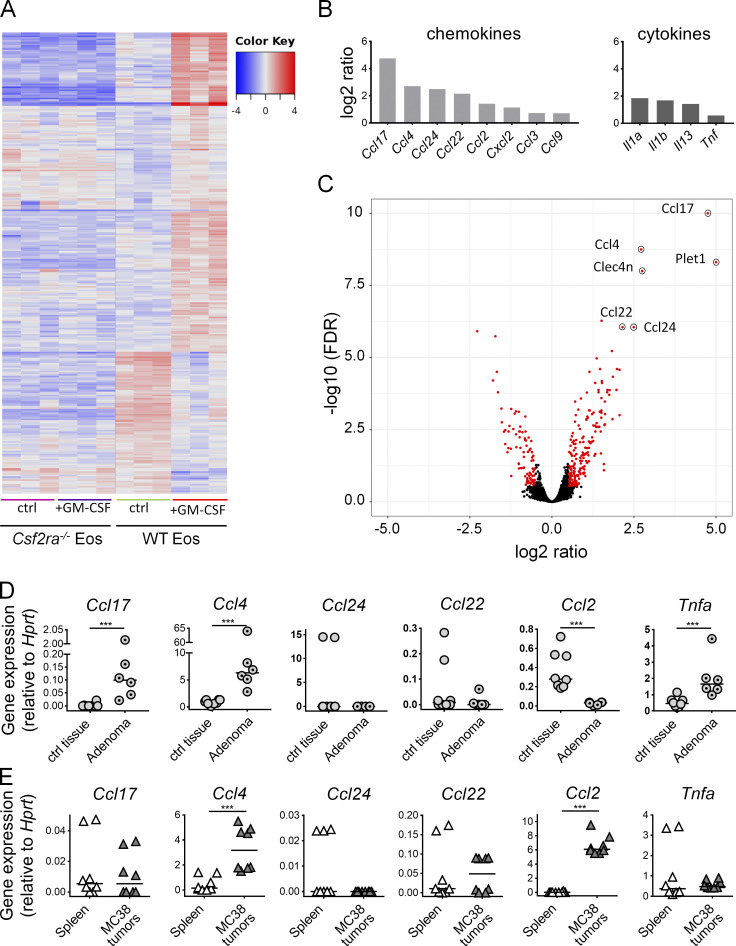
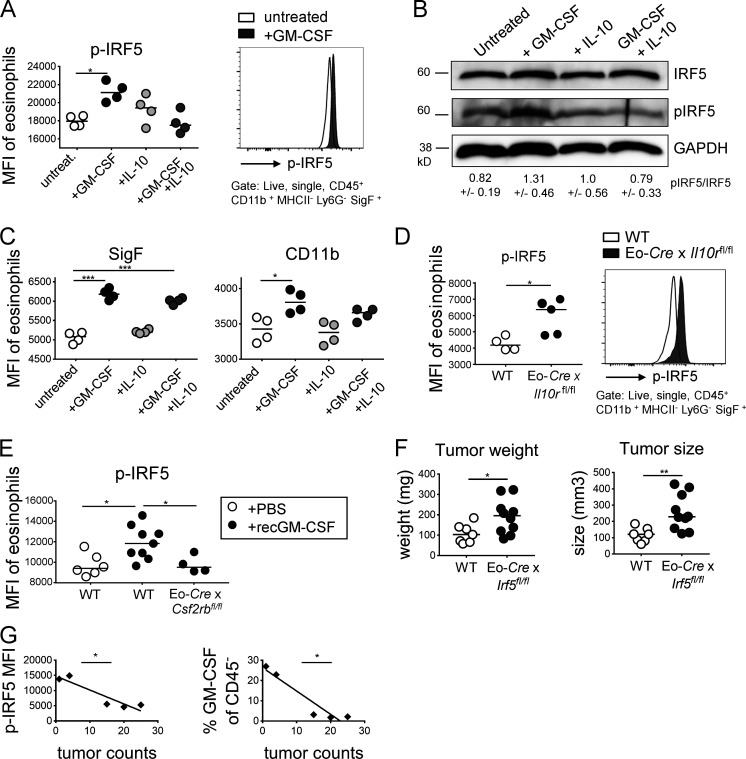
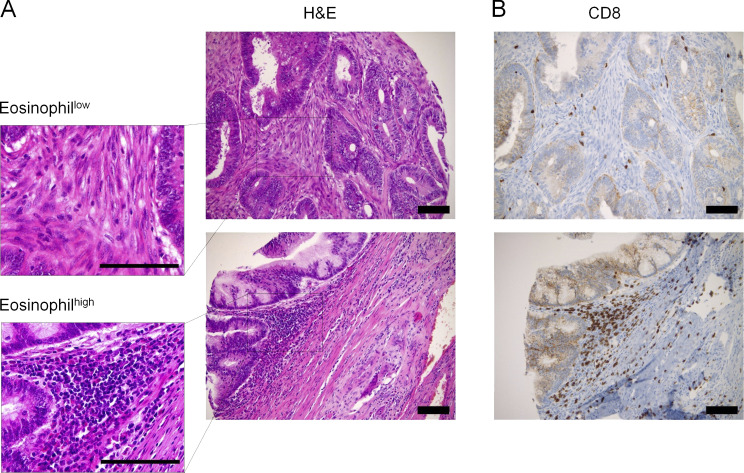
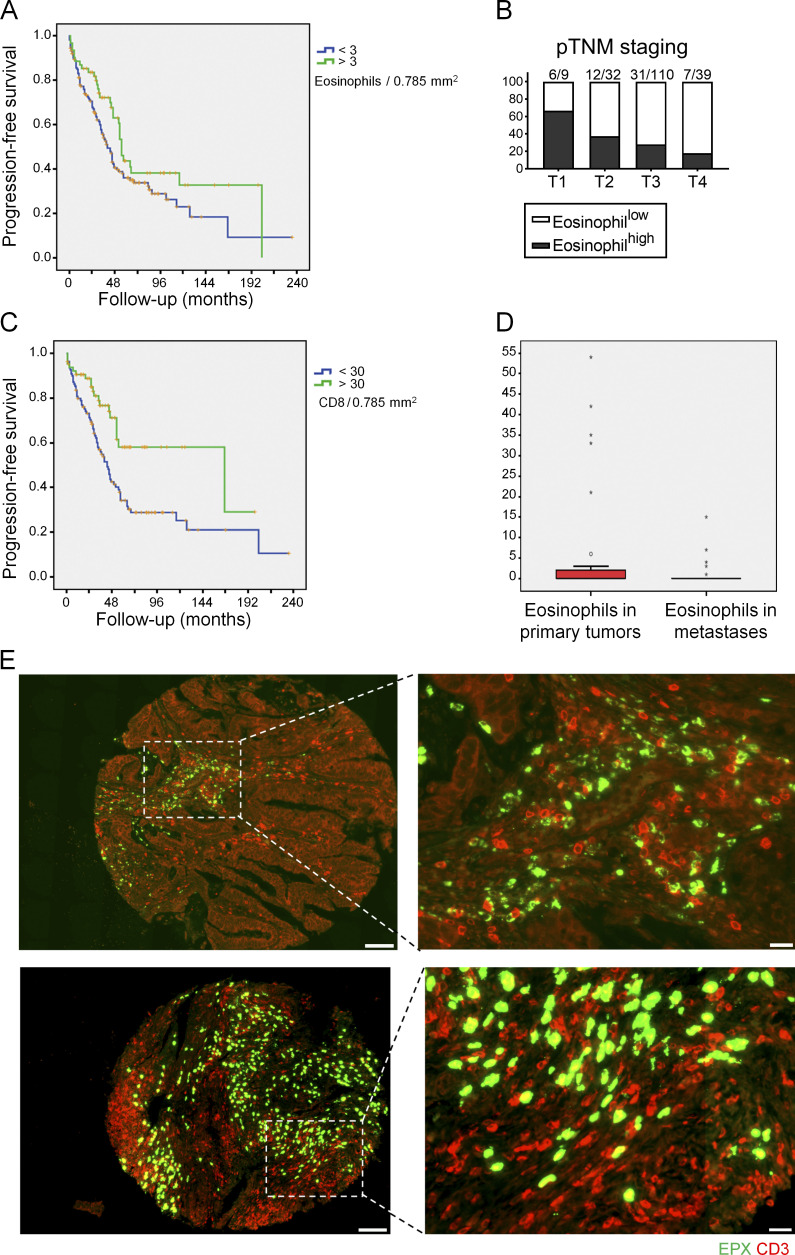
The depletion of eosinophils represents an efficient strategy to alleviate allergic asthma, but the consequences of prolonged eosinophil deficiency for human health remain poorly understood. We show here that the ablation of eosinophils severely compromises antitumor immunity in syngeneic and genetic models of colorectal cancer (CRC), which can be attributed to defective Th1 and CD8+ T cell responses. The specific loss of GM-CSF signaling or IRF5 expression in the eosinophil compartment phenocopies the loss of the entire lineage. GM-CSF activates IRF5 in vitro and in vivo and can be administered recombinantly to improve tumor immunity. IL-10 counterregulates IRF5 activation by GM-CSF. CRC patients whose tumors are infiltrated by large numbers of eosinophils also exhibit robust CD8 T cell infiltrates and have a better prognosis than patients with eosinophillow tumors. The combined results demonstrate a critical role of eosinophils in tumor control in CRC and introduce the GM-CSF-IRF5 axis as a critical driver of the antitumor activities of this versatile cell type.


Conflict of interest statement

Disclosures: The authors declare no competing interests exist.

Figures

Figure S1.
Figure S1.
Eosinophil depletion and overproduction by IL-5 neutralization or transgenic expression. (A) Gating strategy to identify eosinophils and CD4+ and CD8+ T cells among tumor-infiltrating CD45+ leukocytes. (B) Absolute numbers of the indicated tumor-infiltrating leukocyte populations, as quantified per mg of tumor tissue, of the tumors shown in Fig. 1 B. (C and D) Intratumoral eosinophil frequencies of WT, PHIL, anti–IL-5 antibody–treated and IL-5–transgenic mice; representative plots are shown in C along with summary plots in D of all the mice shown in the main Fig. 1. (E) Expression of the indicated surface markers on intratumoral eosinophils from IL-5–transgenic mice and their WT littermates. Data are from one representative study (n = 6–7 mice per genotype). *, P < 0.05; **, P < 0.01; ***, P < 0.001; as calculated by Mann–Whitney test (D and E) or by one-way ANOVA with Tukey’s post-test (B).
Figure 1.
Figure 1.
Eosinophils are recruited to the TME and promote tumor control in an ectopic model of colon cancer. (A–C) PHIL mice and their WT littermates were subcutaneously injected in both flanks with 5 × 10⁵ MC38 colon cancer cells. Tumors were analyzed at 7, 10, and 15 d after injection (n = 14–18 tumors per genotype) with respect to intratumoral eosinophil frequencies (in percentage of all CD45+ leukocytes; A), the composition of the overall leukocyte compartment (WT only; B), and the expression of the indicated surface markers (along with granularity, in corresponding blood, n = 9 versus tumor, n = 18) in the eosinophil compartment of WT mice (C). (D–F) PHIL mice and their WT littermates were injected with MC38 cells and analyzed over time (D) and at the study endpoint (day 15; E) with respect to tumor weights and volumes. Macroscopic images of representative tumors are shown in F; scale bar represents 0.5 cm (n = 14–15 tumors per genotype). (G) C57BL/6 mice were injected with MC38 cells and treated twice weekly with 250 µg/dose of isotype control (iso) or anti–IL-5 antibody. Tumor weights and volumes at the endpoint are shown (n = 9–13 tumors per condition). (H) BALB/c mice were injected with 5 × 10⁵ CT26 colon cancer cells and received twice-weekly injections of 250 µg/dose of isotype control (iso) or anti–IL-5 antibody. Tumor weights and volumes at the study endpoint (day 20) are plotted (n = 28–32 tumors per condition). (I) IL-5–transgenic mice and their WT littermates were injected with MC38 cells and analyzed with respect to tumor weights and volumes at the study endpoint (n = 12 tumors per genotype). Data from at least two and up to three independent experiments are pooled throughout. Symbols represent individual tumors; horizontal lines indicate medians. *, P < 0.05; **, P < 0.01; and ***, P < 0.001; as calculated by Mann–Whitney test.
Figure S2.
Figure S2.
The manipulation of the eosinophil compartment modulates T cell responses in the tumor and draining LNs. (A) Tumor weights and volumes at the study endpoint of WT mice injected with MC38 cells and treated twice weekly with 250 µg/dose of a CD8+ T cell–depleting antibody or its isotype control (n = 9–10 tumors per group). (B) CD4+ and CD8+ T cell frequencies among all leukocytes (upper panels) and absolute numbers per milligram of tumor tissue (lower panels) of PHIL, anti–IL-5 antibody–treated, and IL-5–transgenic mice shown in main Fig. 2 relative to their WT littermates. (C) Intratumoral frequencies of IFN-γ+ and TNF-α+ CD4+ and CD8+ T cells as assessed by intracellular cytokine staining upon restimulation with PMA/ionomycin and of CD8+ T cells upon restimulation with MC-38–specific peptide of the anti–IL-5–treated mice shown in Fig. 1 G. (D) Frequencies of CD4+ and CD8+ T cells among all leukocytes in the tumor-draining inguinal LNs of MC38 tumor-bearing relative to naive mice (left panels, n = 10–13 LNs per group) and of tumor-bearing PHIL, IL-5–transgenic, and anti–IL-5–treated mice and their WT littermates presented in main Figs. 1 and 2 (right panels). (E) Frequencies of IFN-γ+ and TNF-α+ CD4+ and CD8+ T cells as assessed by intracellular staining upon restimulation with PMA/ionomycin, in the inguinal LNs of tumor-bearing PHIL, IL-5–transgenic, and anti–IL-5–treated mice and their WT littermates (n = 5–21 LNs per group). (F–I) ApcMin/+ mice were treated twice weekly with 250 µg of anti–IL-5 or isotype control antibody for 3 wk beginning at 12 wk of age. At the study endpoint, small intestinal and colonic adenomas were harvested along with adjacent normal (tumor-free) colonic tissue per mouse for flow cytometric analysis. Small intestinal adenoma counts are shown in F (n = 14–17 mice per condition); frequencies of Ki67+ cells among all CD4+ T cells and CD8+ T cell counts are shown for colonic adenomas and adjacent colonic lamina propria in G and H. Frequencies of IFN-γ+ cells among all CD8+ T cells of tumor and adjacent normal tissue are shown in I. Data in D and G are from one representative study in E and H and from two pooled studies and in F and I from three pooled studies. *, P < 0.05; **, P < 0.01; ***, P < 0.001.
Figure 2.
Figure 2.
Eosinophils drive tumor-specific T cell responses in the TME. (A–H) PHIL (A, B, E, G, and H) and IL-5-transgenic mice (C, D, and F) and their littermates (WT) were subcutaneously injected with 5 × 10⁵ MC38 cells and analyzed after 15 d with respect to the frequencies of intratumoral IFN-γ+ and TNF-α+ CD4+ T cells and of IFN-γ+ and TNF-α+ CD8+ T cells as assessed by intracellular cytokine staining upon restimulation with PMA/ionomycin and of IFN-γ+ CD8+ T cells upon stimulation with MC38-specific peptide where indicated (“peptide”; A–F). Littermates were used throughout (n = 7–12 tumors per genotype); note that the IL-5–transgenic line generally mounts weaker intratumoral T cell responses than the PHIL line, which is reflected in the generally lower frequencies in C, D, and F relative to A, B, and E. Tumors were further stained for expression of the activation marker CD69 and granzyme B in the CD8 compartment (G and H, n = 6–7 tumors per genotype). (I) CD4+ effector memory cells were identified by staining for CD62L and CD44, of the mice shown in A–F as well as tumor-bearing WT mice treated with anti–IL-5 neutralizing antibody (n = 5–16 tumors per condition). (J) Representative micrographs of eosinophil peroxidase (EPX)– and CD3-stained formalin-fixed sections of MC38 tumors growing on WT and PHIL mice. Scale bars represent 10 µm. Data from one representative of at least two independent experiments are shown throughout. *, P < 0.05; **, P < 0.01; as calculated by Mann–Whitney test (A–H) or by one-way ANOVA with Tukey’s post-test (I).
Figure 3.
Figure 3.
Eosinophils are recruited to adenomas of ApcMin/+ mice and promote antitumor CD4+ T cell responses. ApcMin/+ mice were treated twice weekly with 250 µg of anti–IL-5 or isotype control antibody for 3 wk beginning at 12 wk of age (n = 14–17 mice per condition). At the study endpoint, adenoma formation in the colon was quantified by counting individual polyps with diameters of >1 mm; colonic adenomas were harvested along with adjacent normal (tumor-free) colonic tissue per mouse for flow cytometric analysis of the TME relative to normal colonic lamina propria. (A) Eosinophil numbers per milligram of tumor and adjacent normal tissue of mice treated with anti–IL-5 or isotype control antibody. (B) Eosinophil activation in tumor and normal tissue of isotype control antibody–treated mice, as assessed by flow cytometric analysis of CD11b and Siglec F (SigF) expression. (C) Colonic adenoma counts of anti–IL-5 or isotype control antibody–treated mice. (D) Representative macroscopic images of the colon of an ApcMin/+ mouse treated with anti–IL-5 or isotype control antibody. (E) CD4+ T cell numbers per milligram of colonic adenoma and adjacent normal tissue of mice treated with anti–IL-5 or isotype control antibody. (F and G) Intratumoral frequencies of IFN-γ+ and GM-CSF+ CD4+ T cells in tumor and normal colon tissue of the mice shown in A–C. Summary plots are shown in F alongside representative FACS plots in G. Numbers indicate frequencies (%) in respective gates. (H) Intratumoral counts per mg of tissue, of IFN-γ+ CD4+ T cells (ρ, correlation coefficient = −0.7368) and GM-CSF+ CD4+ T cells (ρ = −0.6507) relative to tumor counts. Data in A, B, E, and H are pooled from two (n = 8–11 samples per condition), in C and F from three independent experiments (n = 10–24 samples per experiment). Horizontal lines indicate medians. *, P < 0.05; **, P < 0.01; and ***, P < 0.001; as calculated by Mann–Whitney test (B and C), by one-way ANOVA with Tukey’s post-test (A, E, and F) or by linear regression (H).
Figure 4.
Figure 4.
Eosinophil activities in the TME are suppressed by IL-10. (A and B) IL-10 reporter (10BiT) mice were subcutaneously injected with 5 × 10⁵ MC38 cells and analyzed after 15 d with respect to their intratumoral frequencies of Thy1.1 (IL-10)+ myeloid cells, granulocytes, and T cells. Average frequencies as assessed in independent tumors are shown in A alongside representative FACS plots for the indicated major IL-10–producing myeloid populations in B (n = 8 tumors). (C–I) Eo-Cre × Il10rafl/fl mice and their Cre-negative littermates were subcutaneously injected with 5 × 10⁵ MC38 cells and analyzed after 15 d with respect to their tumor weights and volumes (C), their intratumoral frequencies of eosinophils (D), and their intratumoral frequencies of IFN-γ+ and TNF-α+ CD4+ and CD8+ T cells (F, representative FACS plots in E; PMA and ionomycin) and IFN-γ+ CD8+ T cells upon restimulation with MC38-specific peptide (G). (H) Frequencies of TNF-α+ monocytes and macrophages among their respective parent populations, shown alongside representative FACS plots for macrophages. (I) Frequencies of TNF-α+ cells among CD45+ leukocytes and among all CD45 cells in the tumor. Data in C–I are pooled from three independent studies, n = 17–20 tumors per genotype. *, P < 0.05; **, P < 0.01; and ***, P < 0.001; as calculated by Mann–Whitney test.
Figure S3.
Figure S3.
The IL-10–STAT3 signaling axis in eosinophils suppresses their antitumor properties. (A) Frequencies of Thy1.1 (IL-10)+ cells in the indicated cellular compartments of the colonic lamina propria in (naive) IL-10 reporter (10BiT) mice (n = 8 mice). Means + SD are shown. (B) Representative FACS plot of Thy1.1 (IL-10) expression by intratumoral Foxp3+ T reg cells and IL-10 expression by MC38 tumor cells growing subcutaneously in mice as determined by intracellular cytokine staining relative to FMO (fluorescence minus one control). FSC-A, forward scatter area; L/D, live/dead. (C) WT C57BL/6 mice were subcutaneously injected with 5 × 10⁵ MC38 cells, treated twice weekly with anti–IL-10R or control antibody for the duration of the experiment, and analyzed after 15 d with respect to their tumor weights and volumes (n = 10 tumors per group). (D) Ccl5 expression by intratumoral eosinophils in Eo-Cre × Il10rafl/fl mice relative to their WT littermates (n = 17–20 tumors per genotype). (E–G) Eo-Cre × Stat3fl/fl mice and their WT littermates were subcutaneously injected with 5 × 10⁵ MC38 cells and analyzed after 15 d with respect to their tumor weights and volumes (E) and their intratumoral frequencies of IFN-γ+ and TNF-α+ CD4+ and CD8+ T cells as assessed by intracellular cytokine staining upon restimulation with PMA/ionomycin (n = 9–10 tumors per genotype). (H) Eo-Cre × Tgfbr2fl/fl mice and their Cre-negative littermates were subcutaneously injected with 5 × 10⁵ MC38 cells and analyzed after 15 d with respect to their tumor weights and volumes (n = 7–12 tumors per genotype). Data in C and H are from one experiment, data in D are pooled from three independent experiments, and data in E–G are pooled from two independent experiments. (I) Apoptosis rate as determined by Annexin V staining followed by flow cytometry of MC38 cells cultured overnight in the presence or absence of 10 ng/ml of the indicated recombinant cytokines and in the presence or absence of bone marrow–derived eosinophils at a ratio of 2:1 (tumor/eosinophil). (J) TNFRI expression of MC38 cells subjected to genomic editing with a TNFRI-specific guide RNA (in blue) or an irrelevant guide RNA (gray); cells were stained with a TNFRI-specific (gray, blue) or control antibody (black). (K and L) Apoptosis as determined by Annexin V staining followed by flow cytometry, of MC38 cells described in J cultured o/n in the presence or absence of the indicated concentrations of TNF-α. A representative Annexin V histogram is shown in K and a summary plot of four replicate samples per condition from two independent experiments is shown in L. (M) Tumor weights and volumes at the study endpoint of Eo-Cre × Il10ra fl/fl mice and their Cre-negative littermates injected with MC38 cells, and treated twice weekly with 250 µg/dose of a TNF-α–neutralizing antibody or its isotype control (n = 4–10 tumors). (N) Tumor weights and volumes at the study endpoint of Eo-Cre × Il10ra fl/fl mice that have been subcutaneously injected with MC38 cells that express either normal (TNFRI+) or low amounts (TNFRI) as shown in J due to CRISPR-mediated deletion of the TNFR1 locus (n = 12–16 tumors per group). The tumor size on day 10 is shown alongside tumor sizes and weights at the study endpoint (day 15). *, P < 0.05; **, P < 0.01; ***, P < 0.001.
Figure S4.
Figure S4.
GM-CSF promotes tumor control through the activation of IRF5, but does not synergize with checkpoint blockade. (A) Systemic eosinophil frequencies are not affected by the deletion of Csf2rb in the eosinophil compartment. Eo-Cre × Csf2rbfl/fl mice and their Cre-negative littermates were examined with respect to their eosinophil frequencies, as determined by flow cytometry of the indicated tissues (n = 3–4 mice per genotype). (B) Eosinophil frequencies in the tumors of Eo-Cre × Csf2rbfl/fl mice and their Cre-negative littermates (n = 10–11 tumors per genotype). (C) Myeloid cell frequencies in the tumors of CSF2ra/− mice and WT (n = 13–17 tumors per genotype). Data are pooled from two studies. (D) ApcMin/+ mice were treated three times weekly with recombinant GM-CSF during the last 3 wk of a 4-mo experiment. At the study endpoint, adenoma formation in the colon was quantified by counting individual polyps with diameters of >1 mm. Data are from one experiment and representative of two (n = 5–8 mice per group). (E) WT BALB/c mice were injected with CT26 cells and treated three times weekly with recombinant GM-CSF and/or twice weekly with a PD-L1–specific or isotype control antibody as indicated. Tumor weights and volumes are plotted for one large study (n = 10–15 tumors per group). (F) WT C57BL/6 mice were injected with MC38 cells and treated three times weekly with recombinant GM-CSF and/or twice weekly with a PD-L1–specific or CTLA4-specific antibody or isotype control as indicated. Tumor weights and volumes are pooled from two independently conducted studies (n = 6–13 tumors per group). (G) Expression of the indicated immune response–related transcripts in bone marrow–derived WT eosinophil cultures that were treated overnight with 20 ng/ml recombinant GM-CSF or vehicle control and subjected to RNA-sequencing–based transcriptome analyses, as shown in Fig. 6. The log2 ratio is shown for GM-CSF–treated cells relative to control. (H) GM-CSF (Csf2) expression, as determined by quantitative RT-PCR, in adenomas harvested from ApcMin/+ mice relative to adjacent control tissue. Each data point represents one tumor or tissue, respectively (n = 20 samples per condition). (I) GM-CSF expression, as determined by FACS, of subcutaneously growing MC38 cells at the study endpoint relative to FMO (fluorescence minus one control). (J) Splenocytes from IL-5 transgenic donors were treated for 30 min with the indicated amount of recombinant GM-CSF, or with 100 ng/ml LPS and stained for lineage markers and for phosphorylated IRF5; the p-IRF5 signal in Siglec F-positive eosinophils (left panel) and F4/80-positive macrophages (right panel) was quantified by flow cytometry. (K) Splenocytes from IL-5–transgenic donors were treated overnight with 20 ng/ml GM-CSF. Cells were stained for IRF5 and the signal in eosinophils was quantified by flow cytometry. The summary plots in J and K show the MFI (n = 4–5 parallel cultures each). (L) IRF5 expression, as determined by quantitative RT-PCR in sorted eosinophils from IL-5–transgenic splenocyte cultures that have been exposed overnight to 20 ng/ml GM-CSF (n = 3–4 samples per condition). (M) Eosinophil activation in tumors of Eo-Cre × Irf5fl/fl mice and their WT littermates, as assessed by flow cytometric analysis of Siglec F expression (n = 5–6 per genotype, P = 0.053. (N) Tumor weights and volumes of Eo-Cre × Irf5fl/fl mice and their WT littermates that have (black circles) or have not (white circles) been treated with recombinant GM-CSF three times weekly for the duration of the 2-wk experiment (n = 5–13 tumors per group). Data are pooled from two studies. *, P < 0.05; **, P < 0.01; ***, P < 0.001.
Figure 5.
Figure 5.
GM-CSF promotes tumor control through its activities on eosinophils. (A–E) Eo-Cre × Csf2rbfl/fl mice and their Cre-negative littermates were subcutaneously injected with 5 × 10⁵ MC38 cells and analyzed after 15 d with respect to their tumor weights and volumes (A) as well as their intratumoral frequencies of IFN-γ+ and TNF-α+ CD4+ T cells (B), IFN-γ+ and TNF-α+ CD8+ T cells (C; PMA/ionomycin), and IFN-γ+ CD8+ T cells upon stimulation with MC38-specific peptide (D; n = 13–14 tumors per genotype). Frequencies of effector memory cells are shown as well (E). Data in A–E are pooled from two independent studies. (F–H) WT C57BL/6 mice (F and G, n = 15–22 tumors per group) and Eo-Cre × Csf2rbfl/fl mice and their Cre-negative littermates (H, n = 6–14 tumors per group) were injected with MC38 cells and treated three times weekly with recombinant GM-CSF or IL-5 as indicated. The tumor weights and volumes at the study endpoint are plotted for two (IL-5) and three (GM-CSF) independently conducted, pooled studies in F and G and a representative study of two in H. (I–M) Csf2ra−/− mice and WT controls were injected with MC38 cells and analyzed after 15 d with respect to their tumor weights and volumes (I and J) and their intratumoral frequencies of IFN-γ+ and TNF-α+ CD4+ T cells and of IFN-γ+ and TNF-α+ CD8+ T cells (K and L; PMA/ionomycin, n = 13–17), and of IFN-γ+ CD8+ T cells upon stimulation with MC38-specific peptide (M; n = 4–10). Data in I–L are pooled from three independent studies; data in M are from one representative study of three. *, P < 0.05; **, P < 0.01; and ***, P < 0.001; n.s., not significant; as calculated by Mann–Whitney test.
Figure 6.
Figure 6.
Eosinophils respond to GM-CSF by activating the transcription of T cell–recruiting and –activating chemokines. (A–C) Triplicate bone marrow–derived WT and Csf2ra−/− eosinophil cultures were treated overnight with 20 ng/ml recombinant GM-CSF or vehicle control and subjected to RNA-sequencing–based transcriptome analyses. A heat map showing the top 500 differentially expressed genes that differed most across the 12 samples are shown in A; the log2 ratio of expression of the indicated chemokine and cytokine genes in WT eosinophils treated with GM-CSF relative to control is presented in B; the volcano plot in C shows all significantly differentially expressed transcripts (in red, significance cutoff P = 0.05, fold change >0.5), with the top transcripts annotated with their gene names. (D and E) Expression of the indicated chemokine and cytokine transcripts in eosinophils FACS-sorted from adenomas versus adjacent tissue (D; n = 6–8 samples per group) and MC38 tumors versus corresponding spleen (E; n = 8 samples per group). Each dot corresponds to sorted eosinophils from one adenoma or MC38 tumor. ***, P < 0.001, as calculated by Mann–Whitney test.
Figure 7.
Figure 7.
GM-CSF-activated IRF5 is a critical regulator of eosinophil activities in the TME. (A–C) Splenocytes from IL-5–transgenic donors were treated overnight with 20 ng/ml GM-CSF, 50 ng/ml IL-10, or both cytokines. Cells were either stained for phosphorylated IRF5 and the signal in eosinophils was quantified by flow cytometry (A, summary plot of MFI and representative histogram, n = 4 technical replicates per condition) or subjected to protein extraction and Western blotting with a p-IRF5-specific antibody (B, total IRF5 and GADPH shown as loading controls). The quantification of three Western blots representing independent experiments is shown below the lanes as mean ± SEM. (C) The same cells as shown in A were also stained for Siglec F and CD11b to assess the activation state of eosinophils in the cultures. (D) IRF5 activation as assessed by p-IRF5–specific flow cytometry of eosinophils in tumors of Eo-Cre × Il10ra fl/fl mice and their Cre-negative littermates. One representative experiment of two is shown, n = 4–5 tumors per genotype. (E) IRF5 activation as assessed by p-IRF5–specific flow cytometry of eosinophils in tumors of Eo-Cre × Csf2rb fl/fl mice and their Cre-negative littermates that were treated three times weekly with recombinant GM-CSF or PBS as indicated. (F) Tumor weights and volumes at the study endpoint of Eo-Cre × Irf5 fl/fl mice and their Cre-negative littermates that had been subcutaneously injected with MC38 cells. Data are pooled from two independent experiments. (G) GM-CSF in CD45 negative leukocytes (right panel, correlation coefficient ρ = −0.948) and p-IRF5 in eosinophils infiltrating adenomas of ApcMin/+ mice treated with isotype control antibody (left panel, ρ = −0.927) as assessed flow cytometrically, relative to tumor counts (small intestine plus colon, as shown in Fig. 3). *, P < 0.05; **, P < 0.01; and ***, P < 0.001; as calculated by Mann–Whitney test (D and F), by one-way ANOVA with Tukey’s post-test (A, C, and E) or by linear regression (G).
Figure S5.
Figure S5.
Eosinophils colocalize with CD8+ T cells in human CRC biopsy specimens. (A and B) Representative consecutive H&E-stained (A) and anti-CD8–stained (B) sections of CRC biopsy specimens showing either low (upper panels) or high (lower panels) eosinophil infiltration into the tumor mass. Scale bars indicate 100 µm.
Figure 8.
Figure 8.
Eosinophil densities in CRC have prognostic relevance and are positively correlated with T cell infiltration. (A) Progression-free survival of 61 patients whose tumors were classified as eosinophilhigh (>3 eosinophils per 0.785 mm2) versus 162 patients classified as eosinophillow (<3 eosinophils per 0.785 mm2). P = 0.046 according to the log rank Mantel–Cox test. (B) Stratification of eosinophilhigh and eosinophillow patients according to their pTNM status. (C) Progression-free survival of 64 cases whose tumors were classified as CD8high (>30 CD8+ T cells per 0.785 mm2) versus 110 patients classified as CD8low (<30 CD8+ T cells per 0.785 mm2). P = 0.001 according to the log rank Mantel–Cox test. (D) Eosinophil infiltration into the primary tumor and metastases of 36 matched pairs. P = 0.049 according to the Wilcoxon paired/signed-rank test. (E) Representative low- and high-magnification images of two stamp biopsy specimens included on our TMA that feature high eosinophil (in green) and high CD3+ T cell infiltration (in red), as assessed by immunofluorescence microscopy using antibodies for CD3 and the eosinophil peroxidase. Scale bars indicate 100 µm (left images) and 20 µm (right images), respectively.

Similar articles

Cited by

References

    1. American Joint Committee on Cancer . 2002. AJCC Cancer Staging Manual. Sixth edition. Springer, New York.
    1. Arnold, I.C., Artola-Borán M., Tallón de Lara P., Kyburz A., Taube C., Ottemann K., van den Broek M., Yousefi S., Simon H.U., and Müller A.. 2018. Eosinophils suppress Th1 responses and restrict bacterially induced gastrointestinal inflammation. J. Exp. Med. 215:2055–2072. 10.1084/jem.20172049 - DOI - PMC - PubMed
    1. Bergeron, C., Al-Ramli W., and Hamid Q.. 2009. Remodeling in asthma. Proc. Am. Thorac. Soc. 6:301–305. 10.1513/pats.200808-089RM - DOI - PubMed
    1. Carretero, R., Sektioglu I.M., Garbi N., Salgado O.C., Beckhove P., and Hämmerling G.J.. 2015. Eosinophils orchestrate cancer rejection by normalizing tumor vessels and enhancing infiltration of CD8(+) T cells. Nat. Immunol. 16:609–617. 10.1038/ni.3159 - DOI - PubMed
    1. Castellino, F., Huang A.Y., Altan-Bonnet G., Stoll S., Scheinecker C., and Germain R.N.. 2006. Chemokines enhance immunity by guiding naive CD8+ T cells to sites of CD4+ T cell-dendritic cell interaction. Nature. 440:890–895. 10.1038/nature04651 - DOI - PubMed

Publication types

MeSH terms

Substances