. 2020 Oct 15;183(2):411-428.e16.
doi: 10.1016/j.cell.2020.08.048. Epub 2020 Sep 23.

Macrophages Maintain Epithelium Integrity by Limiting Fungal Product Absorption

Affiliations

Macrophages Maintain Epithelium Integrity by Limiting Fungal Product Absorption

Aleksandra S Chikina et al. Cell. .

Abstract

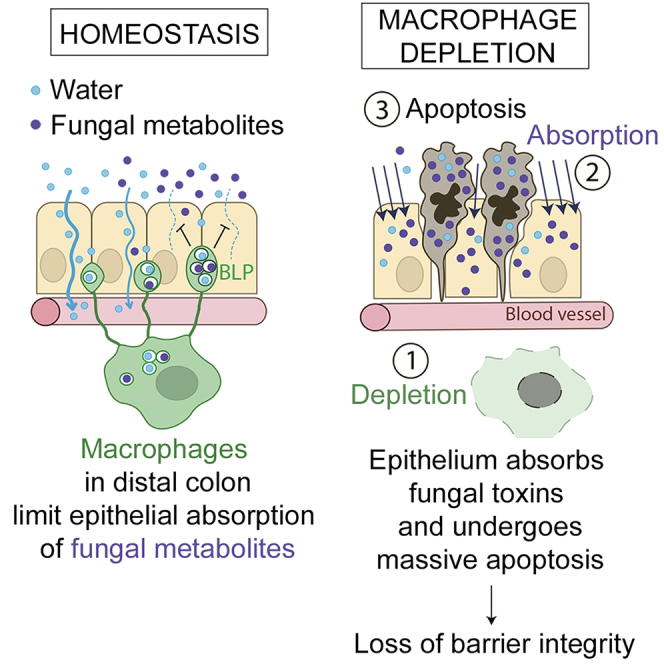
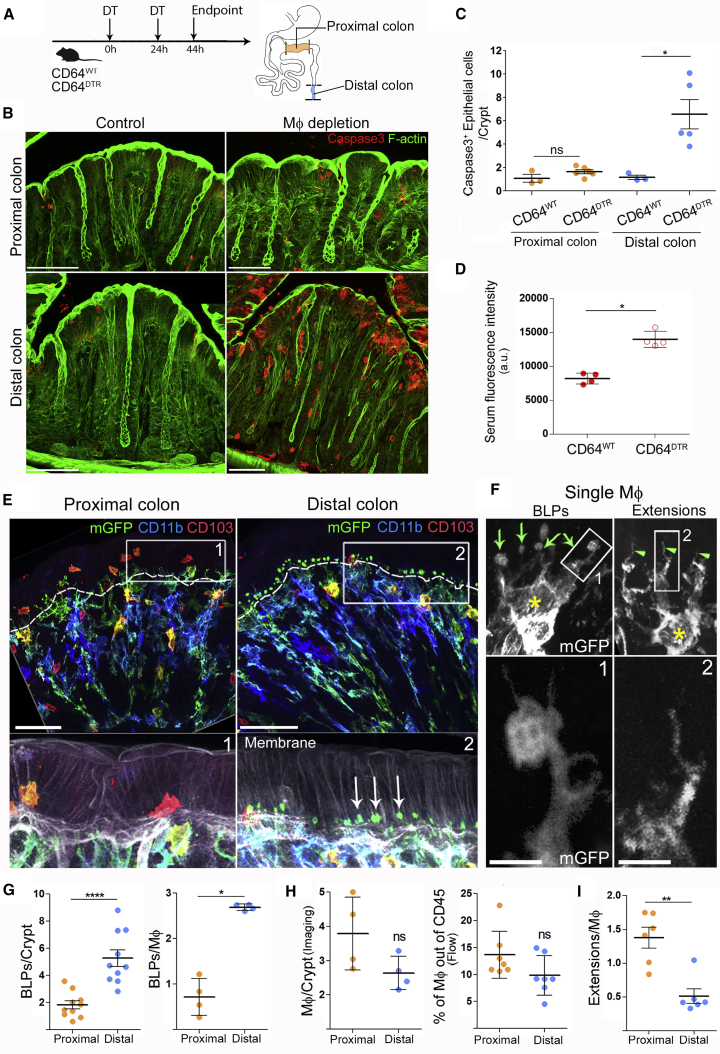
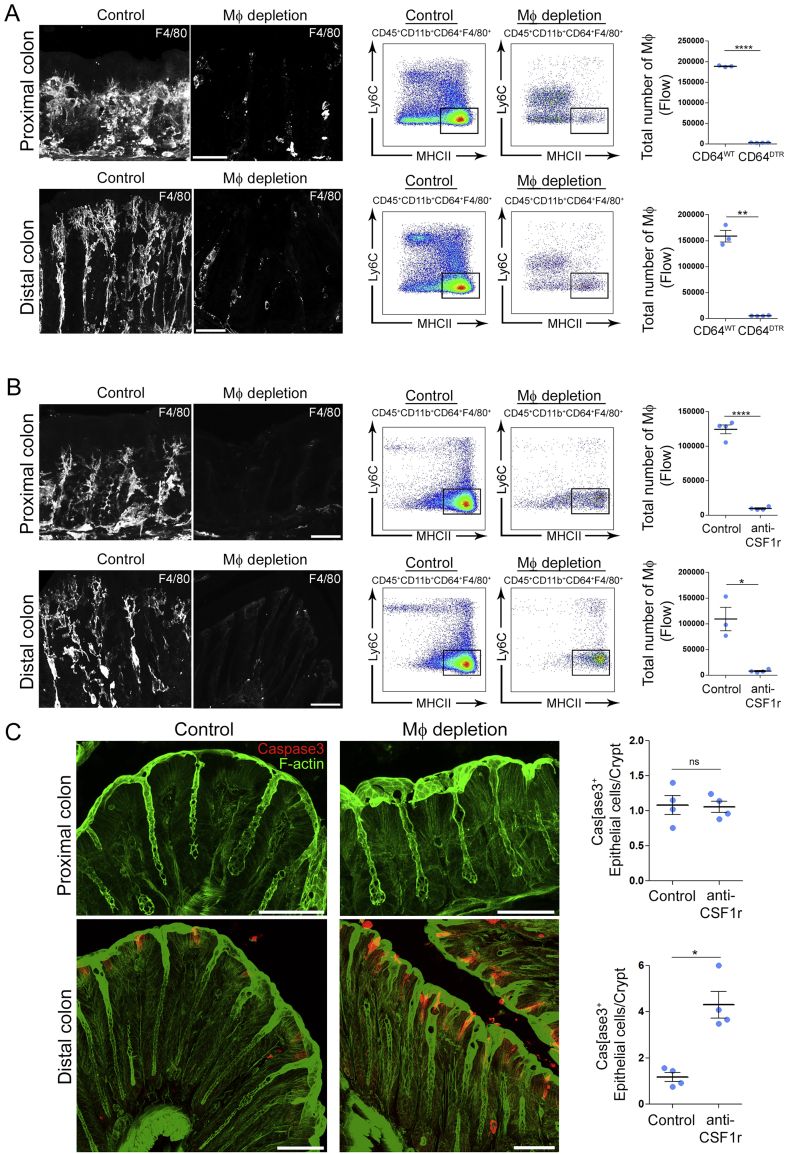
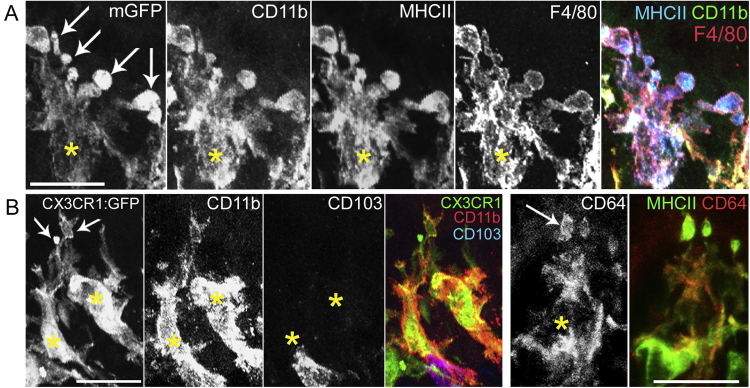
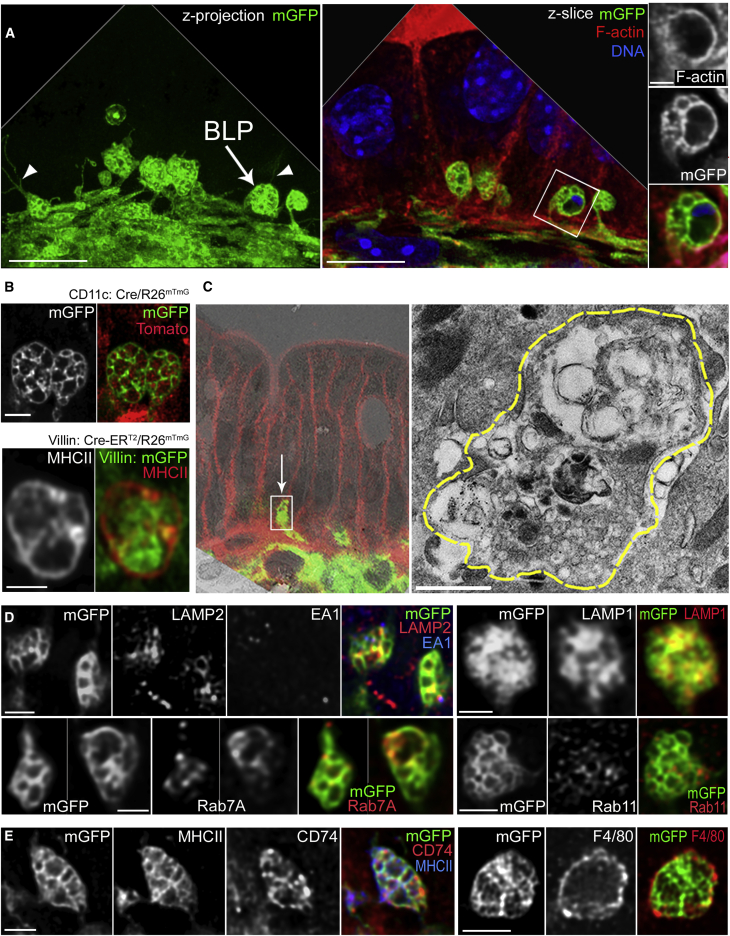
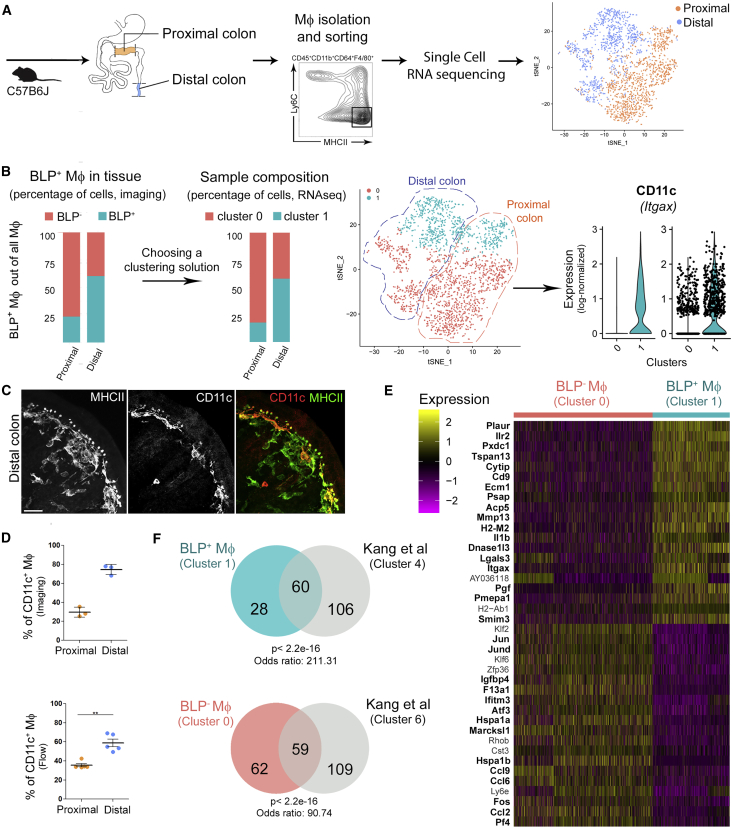
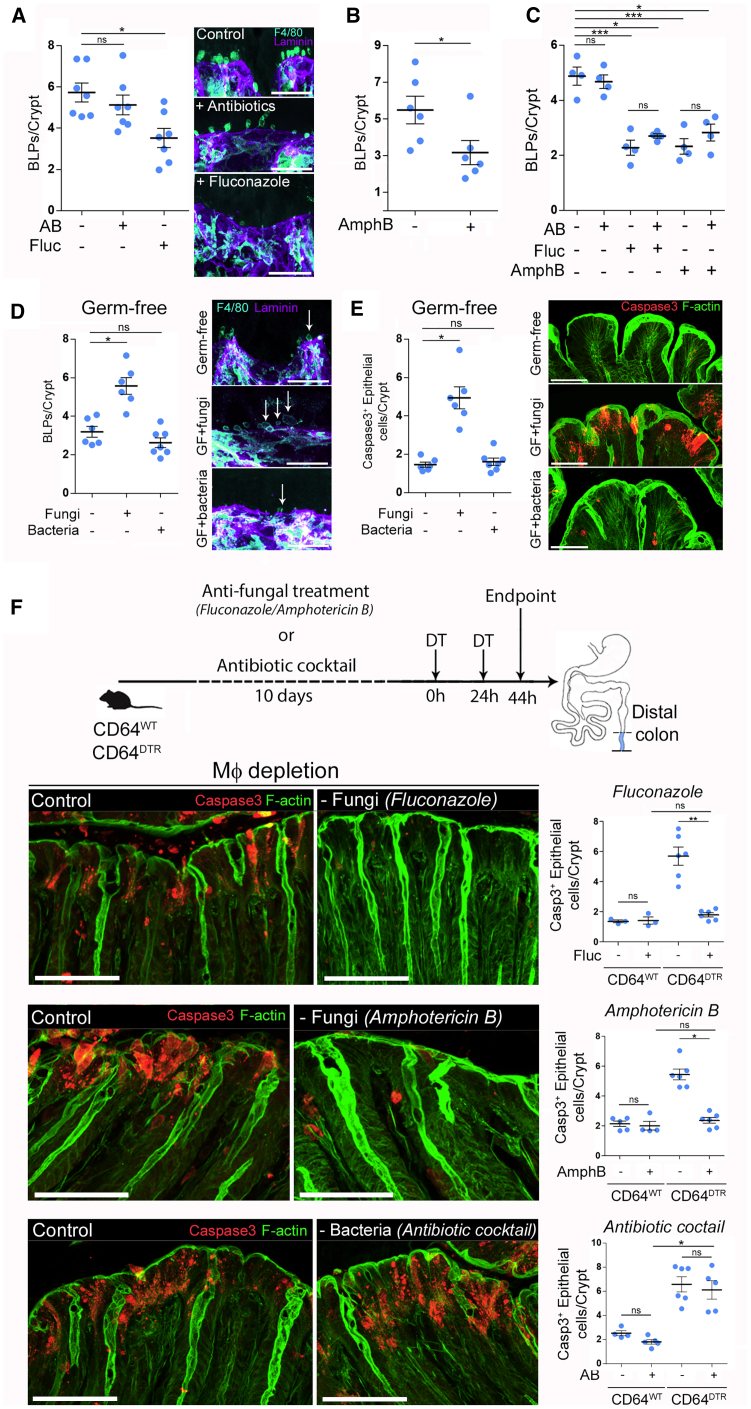
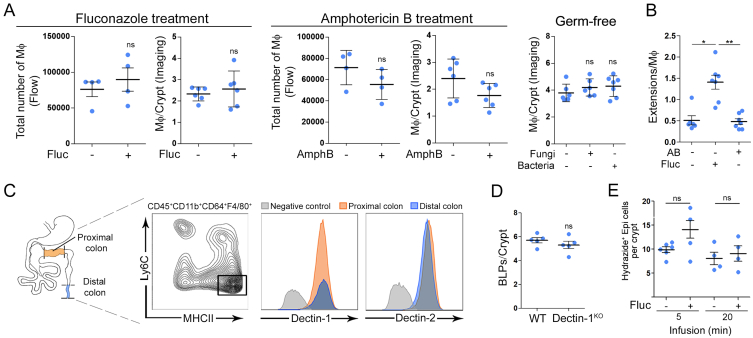
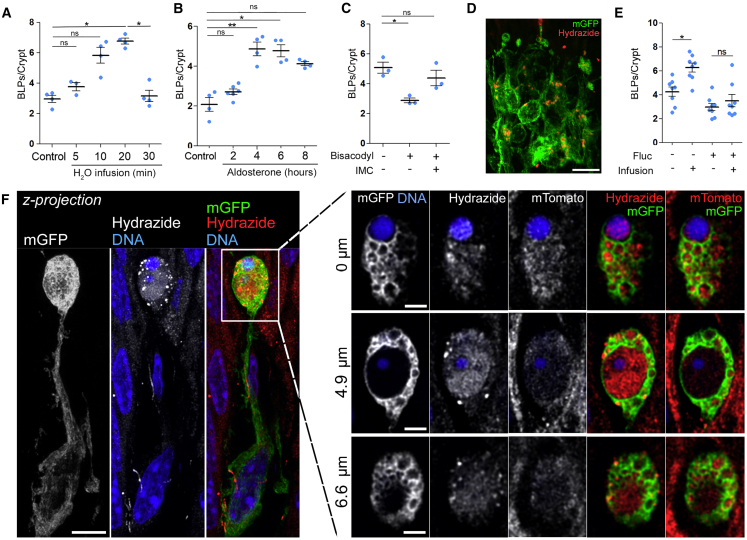
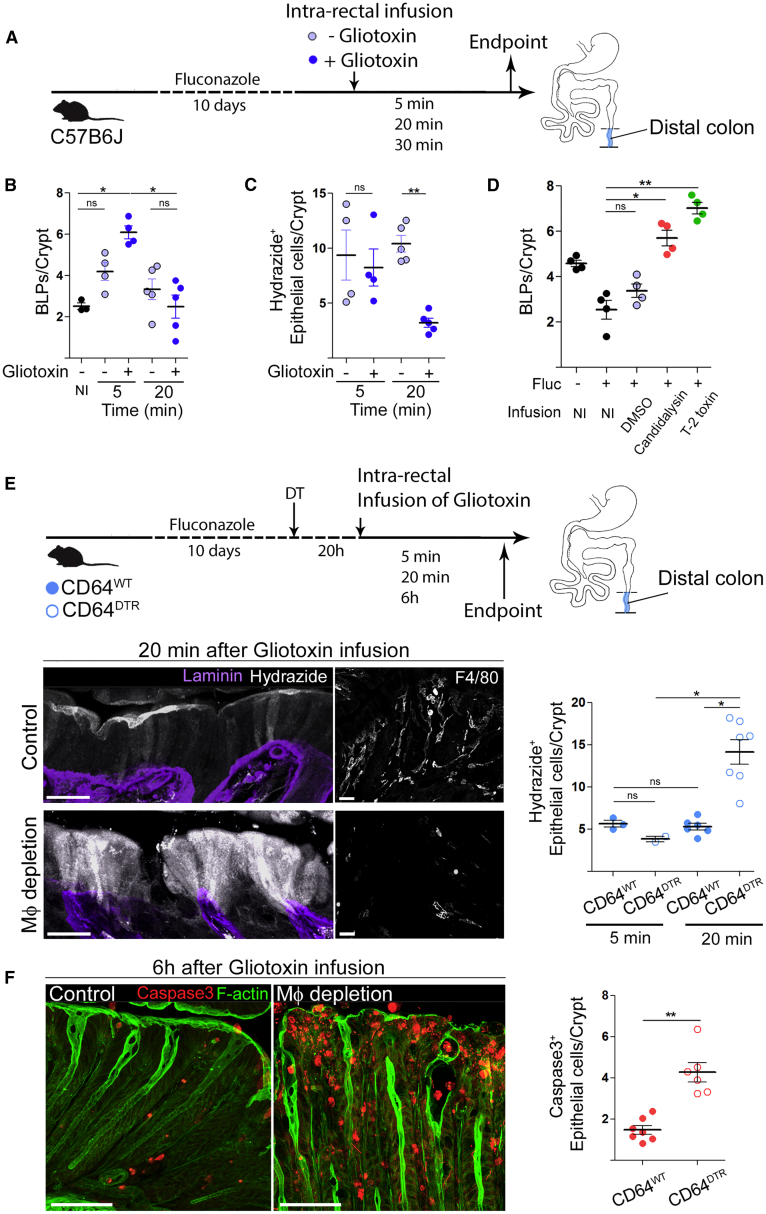
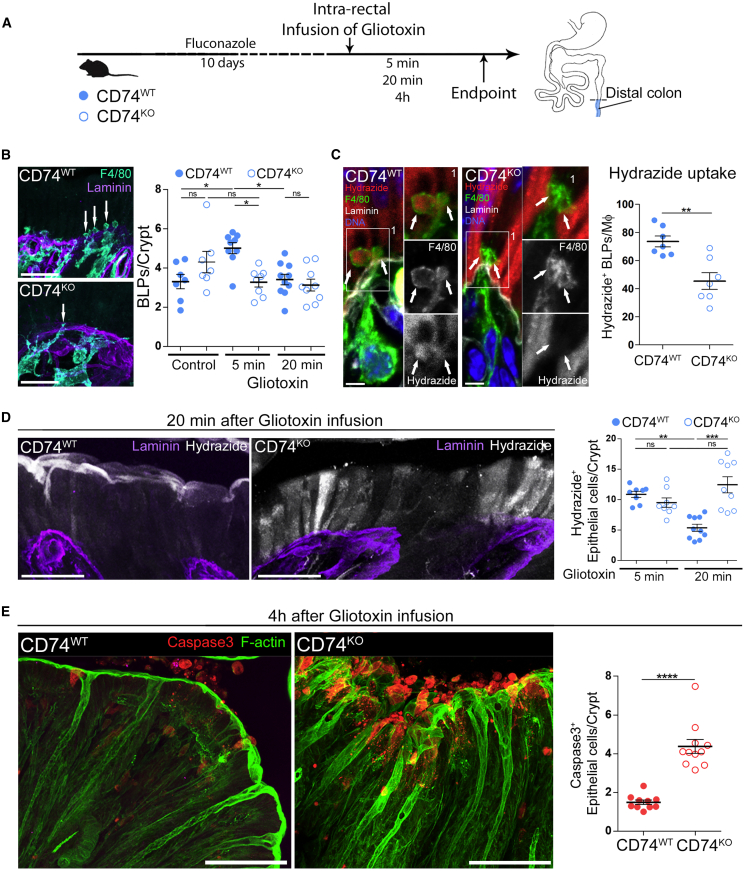
The colon is primarily responsible for absorbing fluids. It contains a large number of microorganisms including fungi, which are enriched in its distal segment. The colonic mucosa must therefore tightly regulate fluid influx to control absorption of fungal metabolites, which can be toxic to epithelial cells and lead to barrier dysfunction. How this is achieved remains unknown. Here, we describe a mechanism by which the innate immune system allows rapid quality check of absorbed fluids to avoid intoxication of colonocytes. This mechanism relies on a population of distal colon macrophages that are equipped with "balloon-like" protrusions (BLPs) inserted in the epithelium, which sample absorbed fluids. In the absence of macrophages or BLPs, epithelial cells keep absorbing fluids containing fungal products, leading to their death and subsequent loss of epithelial barrier integrity. These results reveal an unexpected and essential role of macrophages in the maintenance of colon-microbiota interactions in homeostasis. VIDEO ABSTRACT.

Keywords: colon; epithelium integrity; fluid absorption; fungi; gut; macrophages; metabolites; microbiota; protrusions; toxins.


Conflict of interest statement

Declaration of Interests The authors declare no competing interests.

Figures

None
Graphical abstract
Figure 1
Figure 1
Mɸs Are Required for Epithelial Cell Survival in the Distal Colon and Form “Balloon-like” Protrusions Inserted in between Epithelial Cells (A) Scheme of Мф depletion. CD64WT or CD64DTR littermates received two injections of diphtheria toxin (DT) 24 h apart. (B) Maximum z-projection (30 μm) of proximal and distal colon transversal sections 44 h after the first DT injection. Apoptotic cells were revealed with cleaved caspase 3 staining (red), F-actin (green). Scale bar: 50 μm. (C) Number of apoptotic epithelial cells per crypt in the distal or proximal colon. Pooled data from three independent experiments; dots represent average number per individual mouse. Mean ± SEM, multiple comparison Kruskal-Wallis test, p < 0.05. (D) Serum fluorescence intensities 5–10 min after intra-rectal administration of hypotonic solution of hydrazide-AlexaFluor633. All mice were injected with DT. Pooled data from two independent experiments; dots represent average number per individual mouse. Mean ± SEM, Mann-Whitney test, p < 0.05. (E) Morphological differences of Мфs in the proximal and distal colon. Whole-mount staining of the distal and proximal colon of CD11c: Cre/R26mTmG mice. mGFP (green), CD11b (blue), CD103 (red), membrane tdTomato (gray). BLPs are indicated with arrows, the border between epithelium and the stroma is indicated with the dashed line. Z-projections of 20–40 μm; scale bars: 50 μm. (F) Single Mф forming BLPs (left) or thin extensions (right). Yellow star: cell bodies; green arrows: BLPs; green arrowheads: extensions. Maximum z-projection of 10–15 μm; scale bar: 2 μm. (G) Number of BLPs, normalized per crypt (left) or per Mф (right). Dots represent average number per individual mouse; left: pooled data from seven independent experiments; right: pooled data from another two independent experiments. (H) Number of Mфs in the proximal and distal colon, analyzed by imaging (F4/80+MHCII+CD103 cells per crypt; each dot represents average number per individual mouse; data pooled from three independent experiments) and by flow cytometry (presented as percentage of CD45+ cells; dots represent individual mouse; data pooled from four independent experiments). (I) Number of extensions, normalized per Mф. Dots represent average number per individual mouse; four independent experiments. In (G–I), mean ± SEM, Mann-Whitney test, p < 0.05, ∗∗p < 0.01, ∗∗∗∗p < 0.0001. See also Figure S1 and S2, Video S1.
Figure S1
Figure S1
Mф Depletion Efficiency Using CD64DTR and Anti-CSF1R Antibody-Mediated Models, Related to Figure 1 (A) Mф depletion efficiency using CD64DTR model analyzed by imaging and flow cytometry in the proximal and the distal colon. (B) Mф depletion efficiency using anti-CSF1R antibody – mediated model analyzed by imaging and flow cytometry in the proximal and the distal colon. (C) Number of apoptotic epithelial cells per crypt in the distal or proximal colon of control or anti-CSF1R antibody-injected mice. Maximum z-projections of ∼30 μm, scale bar - 50 μm. Data pooled from 2 independent experiments, dots represent average number per individual mouse. Results are presented as mean ± SEM, Mann- Whitney test, p < 0.05, ∗∗p < 0.01, ∗∗∗∗p < 0.0001.
Figure S2
Figure S2
BLP-Forming Мϕ Express Common Intestinal Macrophage Markers, Related to Figure 1 (A) Cell bodies of Mф are indicated with yellow stars, arrows indicate BLPs. CD11b, MHCII, F4/80 staining of distal colon Мф from CD11c: Cre/R26mTmG mouse, z-projection of 12 μm. Bottom panel (left): CD11b, CD103 staining of CX3CR1-GFP mouse, z-projection of 14 μm. (B) CD64 and MHCII staining of colon Мф from CD11c: Cre/R26mTmG mouse, z-projection of 11 μm, scale bars – 20 μm.
Figure 2
Figure 2
BLPs Contain Epithelial Cell Membranes and Are Enriched in Endolysosomal Compartments (A) BLPs (arrow) with thin membranous extensions (arrowheads). Maximum z-projection of a 7 μm (left) and a single slice (right) of distal colonic Мфs from CD11c: Cre/R26mTmG mouse; mGFP (green); F-actin (red); DNA (blue); deconvolved. Scale bars: 10 μm, 1 μm on the magnified inset. (B) Inner compartments of BLPs are filled with membranous material, derived from CD11c-negative cells (top panel, distal colon of CD11c: Cre/R26mTmG mouse), in part from the epithelium (bottom panel, distal colon of Villin: Cre-ERT2/R26mTmG mouse; intestinal epithelial cells express membranous GFP [green]), BLPs (MHC class II staining [red]). Maximum z-projections of 1 μm, deconvolved. Scale bar: 1 μm. (C) Correlative electron microscopy (left) of BLP from distal colon of CD11c: Cre/R26mTmG mouse; arrow indicates a BLPs found on the confocal image (mGFP [green], membrane tdTomato, boxed [red]) and overlaid with the low-magnification TEM image; borders or the same BLPs are highlighted with yellow dashed line on the higher-magnification TEM image (right). Scale bar: 1 μm. (D) LAMP2, LAMP1, Rab7A, and Rab11 staining of BLPs, maximum z-projections of 1–2 μm, deconvolved. Scale bars: 2 μm. (E) MHCII, CD74, and F4/80 staining of BLPs. Maximum z-projection of 1–2 μm, deconvolved. Scale bars: 2 μm. See also Video S2.
Figure 3
Figure 3
BLP+ Mфs Have Distinct Transcriptomic Profile and Express CD11c as a Specific Marker (A) Single-cell RNA-seq experiment workflow. Mфs were isolated from proximal/distal colon by FACS and sequenced. 2,106 Mфs were identified, n = 1176 for proximal and n = 930 for distal colon, and shown on a t-distributed stochastic neighbor embedding (tSNE) representation; cells isolated from proximal (orange), cells from distal colon (blue) (top 22 PCs computed on the top 1,000 variable genes, vst method). (B) Selection of clustering parameters was based on the silhouette score and expected fraction of BLP+ Mфs in proximal and distal colon obtained from IHC (mean fraction of BLP+ Mфs out of all Mфs; data pooled from two independent experiments). The selected clustering solution (graph-based clustering, 30 neighbors, resolution = 0.3) revealed the presence of two Mф subpopulations, displayed on the same tSNE as in (A) and colored accordingly: cluster 0, containing 964 cells in proximal and 390 cells in distal colon, and cluster 1, containing 212 cells in proximal and 540 cells in distal colon. Cluster 1 expresses CD11c as a specific marker. (C) Co-staining of MHC class II and CD11c of the distal colon from C57B6J mouse. Maximum z-projection of 30 μm; scale bar: 20 μm. (D) Percentage of CD11c+ Mфs out of all Mфs in proximal and distal colon determined by imaging (top, % of CD11c+ Mфs out of F4/80+ CD103 MHCII+ cells) or flow cytometry (bottom, % of CD11c+ Мфs out of CD45+CD3CD19CD11b+CD103CD64+F4/80+Ly6CMHCII+ cells); dots represent average number per individual mice; three independent experiments. Mean ± SEM, Mann-Whitney test, ∗∗p < 0.01. (E) Heatmap of the top 20 significantly up- and downregulated genes between BLP+ Mфs (cluster 1) and BLP Mфs (cluster 0), respectively, sorted by non-decreasing p value; entries represent the scaled (Z score) normalized expression, values <−2.5 or >2.5 are clipped; genes found respectively up- and downregulated in Kang et al. (2020) are highlighted in bold (see F). (F) (Top) Comparison of significantly upregulated genes in BLP+ Mфs (cluster 1, 88 genes, in blue) and in cluster 4 from Kang et al. (2020) (166 genes, in gray). Fisher’s exact test using 10,768 detected genes in the 2,106 Mфs as background. (Bottom) Comparison of significantly upregulated genes in BLP Mфs (cluster 0, 121 genes, in pink) and cluster 6 from Kang et al. (2020) (168 genes, in gray). See also Figures S3 and S4 and Tables S1 and S2.
Figure S3
Figure S3
Gating Strategy Used to Isolate Мϕ from the Distal and the Proximal Murine Colon, Related to Figure 3 The gating strategy begins on the top row, left.
Figure S4
Figure S4
Single-Cell RNA Sequencing of Colonic Macrophages, Related to Figure 3 (A, left) tSNE computed on the top 22 PCs obtained on the 1000 most variable genes (vst method). Cells are colored by the sample. (A, right) tSNE computed on the top 22 PCs obtained on the 1000 most variable genes (vst method). Cells are colored by the cluster (number of neighbors = 30, resolution = 0.3). (B) Distribution of the log-normalized expression levels of genes used for sorting terminally-differentiated Мϕ across clusters (gated on alive, CD45+, CD3-, CD19-, CD103-, CD11b+, F4/80+, CD64+, Ly6C-, MHCII+). (C, top panel) Distribution of the log-normalized expression levels of fibroblast/myofibroblasts markers across clusters. (C, bottom panel). Distribution of the log-normalized expression level of epithelial cell markers across clusters. (D) Clusters 4 and 6 from Kang et al., consist of terminally differentiated (mature) Mф. Venn diagram of the set of cluster 4, 6 and 7 markers (top 50 upregulated genes, gene AF251705 is excluded because it is not associated to any official gene name, Kang et al.) and the terminally differentiated macrophage signature, defined as the genes showing log2(FC) 3 3 from P1 (monocytes) to P4 (mature Мϕ) by Schridde et al. (65 genes).
Figure 4
Figure 4
Intestinal Fungi Stimulate BLP Formation and Account for Epithelial Death in the Absence of Mфs (A) Number of BLPs, normalized per crypt in the distal colon of mice treated with antibiotic cocktail (AB) or anti-fungal agent (fluconazole, fluc). Dots represent average number per individual mouse; four independent experiments. Mean ± SEM, multiple comparison Kruskal-Wallis test, p < 0.05. (B) Number of BLPs, normalized per crypt in the distal colon of mice treated with anti-fungal agent (amphotericin B, AmphB). Dots represent average number per individual mouse; two independent experiments. Mean ± SEM, Mann-Whitney test, p < 0.05 (C) Number of BLPs, normalized per crypt in the distal colon of mice treated with antibiotic cocktail, fluconazole, amphotericin B, or in combinations of antibacterial and anti-fungal agents. Dots represent average number per individual mouse; two independent experiments. Mean ± SEM, multiple comparison Holm-Sidak’s test, p < 0.05, ∗∗∗p < 0.001. (D) Number of BLPs, normalized per crypt, in germ-free mice colonized with bacteria (Schaedler flora, ASF) or fungi (C. albicans). Dots represent average number per individual mouse; two independent experiments. Multiple comparison Kruskal-Wallis test, p < 0.05. In (A and D), Mфs (F4/80, cyan) and crypts (laminin, purple); maximum z-projections of 30 μm. Scale bars: 10 μm. (E) Number of apoptotic (cleaved caspase 3+) epithelial cells per crypt in the distal colon of germ-free mice colonized with bacteria (Schaedler flora, ASF) or fungi (C. albicans). Dots represent average number per individual mouse; two independent experiments. (F) CD64WT or CD64DTR littermates were treated with anti-fungal agents (fluconazole or amphotericin B in separate sets of experiments) or antibiotic cocktail before Mф depletion; 44 h after the first DT injection distal colons were processed for IHC staining. All mice received DT injections. (E and F) Apoptotic cells (cleaved caspase 3 staining, red); F-actin (green). Scale bars: 20 μm. Dots represent average number per individual mouse; data pooled from three (fluconazole and antibiotic cocktail treatment) and two (amphotericin B treatment) independent experiments. Mean ± SEM, multiple comparison Dunn’s test, p < 0.05, ∗∗p < 0.01. See also Figure S5.
Figure S5
Figure S5
Effect of Microbiota on Colonic Macrophages and Epithelium, Related to Figure 4 (A) Number of Mф in mice treated with anti-fungal agents (fluconazole and amphotericin B), and in germ-free mice, reconstituted with fungi (C. albicans) or bacteria (ASF), analyzed by flow cytometry and imaging. (B) Number of extensions normalized per number of Mф in mice treated with antibiotic cocktail or fluconazole. Dots represent average number per individual mouse, data pooled from 2 independent experiments. Results are presented as mean ± SEM, Mann-Whitney test, Kruskal-Wallis test was used in germ-free reconstitution experiments and in (B). (C) Dectin-1 and Dectin-2 staining of Mф isolated from the distal and proximal colon. Gated on Mф, gray histogram – negative control (FMO), orange – proximal colon Mф, blue – distal colon Мф. A representative example from 2 independent experiments, performed with 6 mice in total. (D) Number of BLPs analyzed by IHC staining and normalized per crypt of Dectin-1WT and Dectin-1KO mice. Dots represent average number per individual mouse, results are presented as mean ± SEM, Mann-Whitney test. (D) Number of BLPs normalized per crypt in mice pre-treated with anti-fungal agent (fluconazole, fluc) and infused with hypotonic solution. Pooled data from 5 independent experiments. (E) Number of Hydrazide+ epithelial cells normalized per crypt upon hypotonic solution infusion with hydrazide used as the water tracer. Pooled data from 5 independent experiments. Dots represent average number per individual mouse, results are presented as mean ± SEM, Dunn`s multiple comparison test, p < 0.05.
Figure S6
Figure S6
Spectral Unmixing Protocol, Related to STAR Methods (A) Combination of fluorophores and detection configuration used for 9-color imaging with 4 lasers. (B) Compensation coefficient matrix obtained with single-color labeled controls. (C) Example of spectral unmixing with APC and Alexa680 dyes, scale bar – 50 μm.
Figure 5
Figure 5
BLP Sample Fluids Absorbed through the Epithelium. (A–C) Number of BLPs normalized per crypt upon stimulation/inhibition of intestinal fluid absorption. (A) Mice (CD11c: Cre/R26mTmG) received an intra-rectal infusion of hypotonic solution and were sacrificed 5, 10, 20, or 30 min later. (B) Mice were injected with aldosterone and sacrificed 2, 4, 6, or 8 h later. (C) Mice (C57BL/6J) were force-fed with a laxative (bisacodyl) and sacrificed 5 h later. Indomethacin injection (IMC) 15 min before the gavage was used as an inhibitor of bisacodyl. Dots represent average number per individual mouse; data pooled from three (A and B) or two (C) independent experiments. Mean ± SEM, multiple comparison Kruskal-Wallis test, p < 0.05, ∗∗p < 0.01. (D) Maximal z-projection of distal colonic Mфs 5 min after intra-rectal infusion of hydrazide (a polar low molecular weight membrane-impermeant dye used as a water tracer) in hypotonic solution. mGFP (green), hydrazide (red); z-projection of 20 μm. Scale bar: 10 μm. (E) Number of BLPs normalized per crypt in C57BL/6J mice pre-treated with anti-fungal agent (fluconazole, fluc) and infused with hypotonic solution. Dots represent average number per individual mouse; five independent experiments. Mean ± SEM, multiple comparison Kruskal-Wallis test, p < 0.05. (F) Maximal z-projection of distal colonic Mфs forming BLPs, filled with hydrazide after intra-rectal infusion. CD11c: Cre/R26mTmG mouse, left: z-projection of 8 μm, scale bar: 2 μm; and individual optical planes at different depths of the same BLP, scale bar: 1 μm.
Figure 6
Figure 6
Mфs Protect Epithelial Cells from Death by Limiting Fungal Toxin Absorption (A) C57BL/6J littermates were treated with anti-fungal agent (fluconazole), received intra-rectal infusion of hypotonic solution (1:1 H2O/PBS) with or without gliotoxin, and were sacrificed 5 or 20 min later. Hydrazide was used as the water tracer. (B) Number of BLPs normalized per crypt in C57BL/6J mice pre-treated with anti-fungal agent and infused with hypotonic solution with or without gliotoxin. Control (non-infused) group is indicated as “NI.” (C) Number of hydrazide+ epithelial cells normalized per crypt in C57BL/6J mice pre-treated with anti-fungal agent and infused with hypotonic solution with or without gliotoxin. (D) Number of BLPs normalized per crypt in C57BL/6J mice pre-treated with anti-fungal agent (fluconazole, fluc) and infused with hypotonic solution containing DMSO (H2O-infused control group), Candidalysin or T-2 toxin. Non-infused control groups are indicated as “NI.” (E) CD64WT or CD64DTR littermates were treated with anti-fungal agent (fluconazole) before Mф depletion; 20 h after the first DT injection mice received intra-rectal infusion of gliotoxin (in hypotonic solution + hydrazide) and were killed 5 min, 20 min, or 6 h later. All mice were injected with DT. Mф depletion was confirmed by F4/80 staining, basement membrane (laminin, purple); maximum z-projections of 30 μm. Scale bars: 20 μm. (C) Maximum z-projection of distal colon sections of Mф-depleted animals 6 h after gliotoxin infusion. Apoptotic cells (cleaved caspase 3, red) staining, F-actin (green). All mice were injected with DT. In (A–F), dots represent average number per individual mouse; data pooled from three (B and C) or two (D–F) independent experiments. Mean ± SEM. In (B–E), multiple comparison Kruskal-Wallis test. In (F), Mann-Whitney test, p < 0.05, ∗∗p < 0.01.
Figure 7
Figure 7
CD74-dependent BLP Formation Protects Epithelial Cells from Death by Limiting Fungal Toxin Absorption (A) CD74WT or CD74KO littermates were treated with an anti-fungal agent (fluconazole) and infused intra-rectally with a hypotonic solution containing gliotoxin. Hydrazide was used as the water tracer. Mice were killed 5 min, 20 min, or 4 h after the infusion, and distal colon samples were processed for IHC staining. (B) Number of BLPs formed 5 min after gliotoxin infusion. Mфs (F4/80 staining, cyan), basement membrane (laminin, purple). Scale bar: 20 μm. (C) Efficiency of BLP-mediated hydrazide uptake upon gliotoxin infusion. Hydrazide (red), Mфs (F4/80 staining, green), basement membrane (laminin, white), and DNA (DAPI, blue). Scale bars: 5 μm. (D) Epithelial absorption of fluid upon gliotoxin infusion. Hydrazide (white), basement membrane (laminin, purple), maximal z-projections of 30 μm. Scale bars: 20 μm. (E) Distal colon sections 4 h after gliotoxin infusion. Apoptotic cells (cleaved caspase 3 staining, red), F-actin (green); z-projections of 30 μm. Scale bars: 50 μm. Three independent experiments; dots represent average number per individual mouse. In (B and D), dots represent average number per individual mouse; data pooled from five independent experiments. Mean ± SEM, multiple comparison Dunn’s test, p < 0.05, ∗∗p < 0.01, ∗∗∗p < 0.001. In (C and E), mean ± SEM, Mann-Whitney test, ∗∗p < 0.01, ∗∗∗∗p < 0.0001.

Comment in

References

    1. Al-Bahrani A.Z., Darwish A., Hamza N., Benson J., Eddleston J.M., Snider R.H., Nylén E.S., Becker K.L., Barclay G.R., Ammori B.J. Gut barrier dysfunction in critically ill surgical patients with abdominal compartment syndrome. Pancreas. 2010;39:1064–1069. - PubMed
    1. Anbazhagan A.N., Priyamvada S., Alrefai W.A., Dudeja P.K. Pathophysiology of IBD associated diarrhea. Tissue Barriers. 2018;6:e1463897. - PMC - PubMed
    1. Anderson T.M., Clay M.C., Cioffi A.G., Diaz K.A., Hisao G.S., Tuttle M.D., Nieuwkoop A.J., Comellas G., Maryum N., Wang S. Amphotericin forms an extramembranous and fungicidal sterol sponge. Nat. Chem. Biol. 2014;10:400–406. - PMC - PubMed
    1. Bain C.C., Scott C.L., Uronen-Hansson H., Gudjonsson S., Jansson O., Grip O., Guilliams M., Malissen B., Agace W.W., Mowat A.M.I. Resident and pro-inflammatory macrophages in the colon represent alternative context-dependent fates of the same Ly6Chi monocyte precursors. Mucosal Immunol. 2013;6:498–510. - PMC - PubMed
    1. Ballard S.T., Hunter J.H., Taylor A.E. Regulation of tight-junction permeability during nutrient absorption across the intestinal epithelium. Annu. Rev. Nutr. 1995;15:35–55. - PubMed

Publication types