. 2020 Dec;588(7838):466-472.
doi: 10.1038/s41586-020-2797-4. Epub 2020 Sep 24.

Cells of the adult human heart

Affiliations

Cells of the adult human heart

Monika Litviňuková et al. Nature. 2020 Dec.

Abstract

Cardiovascular disease is the leading cause of death worldwide. Advanced insights into disease mechanisms and therapeutic strategies require a deeper understanding of the molecular processes involved in the healthy heart. Knowledge of the full repertoire of cardiac cells and their gene expression profiles is a fundamental first step in this endeavour. Here, using state-of-the-art analyses of large-scale single-cell and single-nucleus transcriptomes, we characterize six anatomical adult heart regions. Our results highlight the cellular heterogeneity of cardiomyocytes, pericytes and fibroblasts, and reveal distinct atrial and ventricular subsets of cells with diverse developmental origins and specialized properties. We define the complexity of the cardiac vasculature and its changes along the arterio-venous axis. In the immune compartment, we identify cardiac-resident macrophages with inflammatory and protective transcriptional signatures. Furthermore, analyses of cell-to-cell interactions highlight different networks of macrophages, fibroblasts and cardiomyocytes between atria and ventricles that are distinct from those of skeletal muscle. Our human cardiac cell atlas improves our understanding of the human heart and provides a valuable reference for future studies.


Conflict of interest statement

The authors declare no competing interests.

Figures

Fig. 1
Fig. 1. Cell composition of the adult human heart.
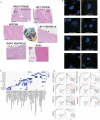
a, Transmural samples were obtained from left and right atrium, left and right ventricles, apex and interventricular septum from 14 individuals. Single nuclei (n = 14) and single cells (n = 7) were processed using Chromium 10x 3′DEG chemistry. b, Infographic shows donors (women, top; men, bottom), age, and contribution to cells and nuclei datasets (orange circle). Data are available in Supplementary Table 1. c, Uniform manifold approximation and projection (UMAP) embedding of 487,106 cells and nuclei delineate 11 cardiac cell types and marker genes. d, Distribution of cell populations, identified from nuclei within atria (left and right) and ventricles (left, right, apex and interventricular septum) after subclustering analysis. Colour code as in c. Data are available in Supplementary Table 2. Adip, adipocytes; Lym, lymphoid; Meso, mesothelial cells; Myel, myeloid; NC, neuronal cells; PC, pericytes. e, Multiplexed smFISH of cell type-specific transcripts in right ventricles (RV; left): TTN (green, cardiomyocytes) and CDH5 (red, EC) right atrium (RA; middle): NPPA (green, aCM) and DCN (red, FB) and left atrium (LA; right): MYH11 (green, SMCs) and KCNJ8 (red, pericytes). Nuclei are counterstained with DAPI (dark blue). Scale bars, 20 μm. For details on statistics and reproducibility, see Methods.
Fig. 2
Fig. 2. Cardiomyocytes.
a, UMAP embedding of five ventricular cardiomyocyte (vCM) populations. b, Regional distributions of ventricular cardiomyocyte populations. Data are available in Supplementary Table 5. AX, apex; LV, left ventricle; SP, interventricular septum; RV, right ventricle. c, d, Multiplexed smFISH of PRELID2 (red) enriched in vCM2 (c) and of FHL1 (red) enriched in vCM3 (d). e, UMAP embedding of five atrial cardiomyocytes (aCM) populations. f, Regional distributions of atrial cardiomyocyte populations. LA, left atrium; RA, right atrium. g, h, Multiplexed smFISH of HAMP (red) enriched in aCM2 (g) and of CNN1 (red) enriched in aCM3 (h). In c, d, g and h, nuclei are counterstained with DAPI (dark blue). Scale bars, 10 μm. For details on statistics and reproducibility, see Methods.
Fig. 3
Fig. 3. Vascular, stromal and mesothelial cells.
a, UMAP embedding of 17 vascular and mesothelial populations. EC1/2/3_cap, capillary ECs; EC4_immune, immune-related ECs; EC5_art, arterial ECs; EC6_ven, venous ECs; EC7_atrial, atria-enriched ECs; EC8_ln, lymphatic ECs; EC9_FB-like, ECs with FB features; EC10_CM-like, ECs with cardiomyocyte features; PC1_vent, ventricle-enriched pericytes; PC2_atrial, atria-enriched pericytes; PC3_str, stromal pericytes; PC4_CM-like, pericytes with cardiomyocyte features; SMC1_basic, basic SMCs; SMC2_art, arterial SMCs. b, Schematic of the vascular cells and their placement in the vasculature. c, Multiplexed smFISH of MYH11 (yellow) in SMC (thick in artery and very thin in small vein), CDH5 (red) in the endothelium, and SEMA3G (cyan) and ACKR1 (green) in EC5_art and EC6_ven, respectively in apex. Nuclei are counterstained with DAPI (dark blue). Scale bar, 20 μm. d, Predicted cell–cell interactions in arteries and veins. Data are available in Supplementary Table 10. e, f, Multiplexed smFISH of pan-FB DCN (cyan) and FAP (red) in FB4 in interventricular septum (SP) (e) and DCN (cyan) and LINC001133 (red) in FB5 in the apex (AX) (f). Nuclei are counterstained with DAPI (dark blue). Scale bars, 5 μm. g, UMAP embedding showing six FB populations and their respective marker genes. h, Multiplexed smFISH of C1QA+ macrophages (MP) and PTX3+ FB3, suggesting cross-talk between both cell types. Scale bar, 5 μm. For details on statistics and reproducibility, see Methods.
Fig. 4
Fig. 4. Cardiac immune populations and cell–cell interactions.
a, Manifold of 40,868 myeloid and lymphoid cardiac cells. NP, neutrophils; NK, natural killer; NKT, natural killer T cells; CD4+T_tem, effector-memory CD4+ T cells; CD4+T_cytox, CD4+ cytotoxic T cells; CD8+T_tem, CD8+ effector-memory T cells; CD8+T_cytox, CD8+ cytotoxic T cells; DC, dendritic cells; CD14+Mo, CD14+ monocytes; CD16+Mo, CD16+ monocytes; Mo_pi, pro-inflammatory monocytes; IL17RA+Mo, IL17RA+ monocytes; MP_AgP, HLA class II antigen-presenting macrophages; MP_mod, monocyte-derived macrophages; LYVE1+MP1–3, M2-like, LYVE1+ macrophages sets 1–3; DOCK4+MΦ1–2, DOCK4+ macrophage sets 1–2; B_cells, B cells; plasma, plasma B cells. b, BioRender infographic summarizes predicted cell–cell interaction circuits between atrial and ventricular cardiomyocytes, FB4 and immune cells involved in tissue repair in the heart and SKM. Data are available in Supplementary Table 17. c, Gene expression signature for cardiac-specific LYVE1+ macrophages compared against predicted matched populations in skeletal muscle and kidney.
Extended Data Fig. 1
Extended Data Fig. 1. Expression of the canonical markers.
a, UMAP embedding of selected canonical markers shown in Fig. 1c. b, Scaled expression (log2-transformed fold change, log2FC) of selected canonical markers shown in Fig. 1c. c, Expression (log2FC) of marker genes from Fig. 1c in each source highlighting that the same marker genes are used for identification of the same cell types in both cells and nuclei. d, Multiplexed smFISH staining of cell type-specific transcripts from Fig. 1e in right ventricles (top): TTN (green, cardiomyocytes) and CDH5 (red, EC) right atrium (middle): NPPA (green, aCM) and DCN (red, FB) and LA (bottom): MYH11 (green, SMC) and KCNJ8 (red, pericytes), nuclei are DAPI-stained (dark blue). Scale bars, 20 μm. For details on statistics and reproducibility, see Methods.
Extended Data Fig. 2
Extended Data Fig. 2. Source and region covariates of the global dataset.
a, UMAP embedding of the major cell types coloured by source. b, UMAP embedding highlighting the individual sources c, Distribution of cell types obtained by each source. Data are available in Supplementary Table 29. Further analyses and descriptions are available in the Methods and Supplementary Table 30. d, UMAP embedding of the major cell types coloured by region. e, UMAP embedding highlighting the individual regions f, Distribution of cell types across the six sampled regions (nuclei only). Data are available in Supplementary Table 2.
Extended Data Fig. 3
Extended Data Fig. 3. Ventricular and atrial cardiomyocytes.
a, Expression (log2FC) of selected marker genes in ventricular cardiomyocyte subpopulations. b, Expression (log2FC) of selected marker genes in atrial cardiomyocyte subpopulations c, Single channel multiplexed smFISH images of overlay shown in Fig. 2c, d, g, h. d, Expression (log2FC) of specific markers in cardiomyocyte subpopulations. I and II, PCDH7 expression in ventricular and atrial cardiomyocytes, respectively. III, PRELID2 expression is highest in vCM2 and is enriched in right ventricles. IV and V, CNN1 expression is enriched in both vCM3 and aCM3. VI and VII, HAMP expression is enriched in the right atrium. e, Multiplexed smFISH of transcripts enriched in cardiomyocyte subpopulations. Left, expression of TNNT2 (green) and PCDH7 (red) in left ventricles. Right, expression of TNNT2 (green) and CNN1 (red) in right ventricles, nuclei are DAPI-stained (dark blue). Scale bars, 10 μm. f, Gene Ontology analysis results for vCM4 showing significant terms related to energy metabolism and muscle contraction. Data are available in Supplementary Table 6. g, Multiplexed smFISH of positive and negative RNAscope control probes. Scale bars, 5 μm. For details on statistics and reproducibility, see Methods.
Extended Data Fig. 4
Extended Data Fig. 4. Vascular and mesothelial populations.
a, Scaled expression (log2FC) of selected marker genes for EC subpopulations. b, c, Distribution of the EC subpopulations across the sources (b) and the regions (c) (nuclei only). Data are available in Supplementary Table 9. d, Scaled expression (log2FC) of selected marker genes of pericytes and smooth muscle cell subpopulations. e, f, Distribution of the mural subpopulations across the sources (e) and the regions (f) (nuclei only). Data are available in Supplementary Table 9. g, Multiplexed smFISH in apex section shows MYH11 (yellow) expression in vascular SMC (thick in artery and very thin in nearby small calibre vein), CDH5 (red) in the endothelium, and SEMA3G (cyan) and ACKR1 (green) expression respectively in arterial and venous ECs, nuclei are DAPI-stained (dark blue). Scale bars, 20 μm. h, UMAP embedding of vascular and mesothelial cells with stochastic representation of the RNA velocity. i, Latent time of the vascular cells showing predicted directionalities of the cell populations based on the RNA splicing dynamics. The analysis uses only cells, nuclei are omitted. EC_cap, capillary ECs; EC_art, arterial ECs; EC_ven, venous ECs; EC atrial, atrial endothelial cells; EC_ln, lymphatic endothelial cells; PC, pericytes; PC_str, stromal pericytes; SMC_basic, smooth muscle cells; SMC_art, arterial smooth muscle cells. j, Predicted cell–cell interactions using the CellphoneDB statistical inference framework on 39,000 cells from 14 biologically independent individuals (n = 14). Selected ligand–receptor interactions show specificity of NOTCH ligands-receptors pairing in defined vasculature beds. Mean of combined gene expression of interacting pairs (log2FC). CellPhoneDB P value of the specificity of the interactions = 10 × 10−5. The red rectangles highlight the arterial interactions and the blue rectangle highlights venous interactions depicted in Fig. 3d. Notably, even though the EC6_ven and SMC2_art interaction is unexpected, we cannot exclude that those cell states are restricted to their respective vascular beds. Further validation is needed to determine the exact spatial distribution of EC6_ven and SMC2_art and subsequently verify whether the interaction is plausible in vivo. Data are available in Supplementary Table 10. k, Scaled expression (log2FC) of the ligands and receptors from g across the vascular populations described in Fig. 3a. l, Scaled expression (log2FC) of selected marker genes of mesothelial cells. m, Multiplexed smFISH localizes the mesothelial cells expressing BNC1 into the epicardium of the left atria. CDH5 shows endothelial cells in the tissue and is absent from the mesothelial cells, nuclei are DAPI-stained (dark blue). Scale bars, 20 μm. n, Distribution of the mural subpopulations across the sampled regions (nuclei only). Data are available in Supplementary Table 9. For details on statistics and reproducibility, see Methods.
Extended Data Fig. 5
Extended Data Fig. 5. Vascular markers visualized on 10X Genomics Visium data.
ad, Spatial expression (log2FC) of CDH5 (pan-EC marker), SEMA3G and GJA5 (arterial EC markers) (a), ACKR1 and PLVAP (venous EC markers) (b), MYH11 and ACTA2 (pan-SMC markers) (c), and JAG1 and NOTCH2 (d) on publicly available 10X Visium section of human left ventricle. JAG1 and NOTCH2 are the predicted interaction partners for arterial ECs and SMCs, respectively.
Extended Data Fig. 6
Extended Data Fig. 6. Fibroblasts.
a, Scaled expression (log2FC) of selected marker genes of identified FB populations. b, Enrichment for oncostatin M pathway for FB populations showing enriched activity in FB3. A list of genes with which the score was calculated is in Supplementary Table 12. c, Regional distribution per FB population. Some FB populations show enrichment in the atria (left and right), such as FB2 and FB3. FB1, FB4–FB6 are enriched in the ventricles (left, right, apex and interventricular septum). Data are available in Supplementary Table 35. df, Multiplexed smFISH for probes targeting FAP, LINC01133 and PTX3 confirming FB4, FB5 and FB3 subpopulations. FAP (red) is imaged in interventricular septum, LINC01133 (red) in apex and PTX3 (red) in right atrium tissue section. DCN (cyan) is used as a pan-FB marker, C1QA (green) as a pan-macrophage marker, nuclei are DAPI-stained (dark blue). Scale bars, 5 μm. g. Scaled expression (log2FC) of APOD and CFH genes, which represent differences between ventricular and atrial fibroblasts. h, Multiplexed smFISH of apex section representing DCN (cyan), APOD (red) and CFH (green), nuclei are DAPI-stained (dark blue). Although the APOD signal colocalized with DCN, expression of CFH was absent. Scale bars, 5 μm. i, UMAP embedding of the ventricular fibroblast cell-states. j, UMAP embedding of atrial fibroblasts cell types. k, Scaled expression (log2FC) of marker genes for ventricular fibroblast subpopulations. l, Scaled expression (log2FC) of marker genes for atrial fibroblast subpopulations. m, Scaled expression (log2FC) of ECM genes differentiating atrial (aFB1, aFB2) and ventricular (vFB2, vFB4) clusters which suggest different ECM mechanisms. For details on statistics and reproducibility, see Methods.
Extended Data Fig. 7
Extended Data Fig. 7. Covariates of immune cardiac populations.
aj, UMAP embedding of cell source (a), donor (b), gender (c), type (d), number of genes (e), number of counts (f), percentage of mitochondrial genes (g), percentage of ribosomal genes (h), scrublet score (i) and annotation of the cell populations of the immune cells (j).
Extended Data Fig. 8
Extended Data Fig. 8. Immune cardiac populations.
a, Visualization of transcriptional signatures from published studies. The score values represent the likelihood of the external transcriptional signature to be present when comparing it against the transcriptional background of a cardiac immune population. Bajpai_2018 = CCR2-MERTK+ tissue-resident macrophages from ref. . Dick_2019 = self-renewing tissue macrophages from ref. . Bian_2020 = yolk sac-derived macrophages from ref. . The complete signature can be found in Supplementary Table 19. b, Expression (log2FC) of LYVE1, FOLR2 and TIMD4 characteristic of the self-renewing tissue-resident murine macrophages previously described, as well as MERTK as previously described and the TREM2 expression associated to lipid-associated macrophages (LAM) previously described. Complete signatures can be found in Supplementary Table 19. c, Scaled expression (log2FC) of genes differentiating DOCK4+ MP1 from DOCK4+ MP2: IL4R, ITGAM, STAT3, DOCK1, HIF1A and RASA2. d, Predicted cell–cell interactions calculated for 69,295 cardiomyocytes, fibroblasts and myeloid cells from 14 donors (n = 14) and enriched for ‘extracellular matrix organization’. Mean of combined gene expression of interacting pairs (log2FC). Data are available in Supplementary Table 17. e, Spatial mapping of the CD74MIF interaction between LYVE1+MP and FB4 on a publicly available 10X Genomics Visium dataset for left ventricular myocardium. We identified four spots where we observe co-expression of FN1, LYVE1, CD74 and MIF, as predicted from the cell–cell interactions. The bar represents the log2FC. f, Confusion matrix for the logistic regression model trained on cardiac immune cells. This model reached an accuracy score of 0.6862, showing a stronger accuracy with lymphoid cells, compared with the myeloid ones.
Extended Data Fig. 9
Extended Data Fig. 9. Neuronal and adipocyte populations.
a, UMAP embedding identifies six neuronal subpopulations. b, Regional distribution of neuronal cell subpopulations identified in a. Data are available in Supplementary Table 20. c, Expression (log2FC) dot plot of selected marker genes in neuronal cell subpopulations. d, Multiplexed smFISH of NRXN1 (green) and PPP2R2B (red), nuclei were DAPI-stained (dark blue). Scale bars, 5 μm. For details on statistics and reproducibility, see Methods. e, UMAP embedding showing four adipocyte subpopulations. f, UMAP embedding of expression of gene markers associated with adipocytes (GPAM, FASN, ADIPOQ, LEP). g, Top five significantly enriched pathways for each adipocyte subpopulation, using differentially expressed genes calculated using the Wilcoxon rank sum test with Benjamini–Hochberg correction (logFC >0.5, P < 1.0 × 10−5) and tested using a hypergeometric distribution with Bonferroni correction as implemented in ToppFun. Data are available in Supplementary Table 21. h, Expression (log2FC) of adipocyte associated genes and select marker genes from the top enriched pathway for each adipocyte subpopulation.
Extended Data Fig. 10
Extended Data Fig. 10. Relevance for COVID-19 and GWAS studies.
a, Global expression (log2FC) of ACE2 in all cardiac cells. bd, Gene expression of ACE2, TMPRSS2, CTSB and CTSL in cardiomyocytes (b), FBs (c) and vascular cells (d). e, Multiplexed smFISH expression of DCN (cyan), KCNJ8 (green) and ACE2 (red), nuclei are DAPI-stained (dark blue) marking fibroblasts (#; expression of DCN) and pericytes (*; co-expression of DCN and KCNJ8) in right ventricular tissue section. Scale bars, 5 μm. For statistics and reproducibility, see Methods. f, The colour coding of the heat map shows the −log10(P value) of the MAGMA GWAS enrichment analysis for the association between cell type-specific expression (y axis) and GWAS signals (x axis). The cell types refer to the subcluster annotations and GWAS studies refer to Supplementary Table 27. AF, atrial fibrillation; CAD, coronary artery disease; HF, heart failure; HR, heart rate; HT, hypertension; LVD, left ventricular diameter; NICM, non-ischaemic cardiomyopathy; PR, PR interval; PWAVE, P-wave duration; T2D, type 2 diabetes; QRS, QRS complex duration; QT, QT interval. Dots mark significant associations (FDR < 10%). The colour of the dots indicates the type of association as determined by pairwise conditional analysis (green: independent association, blue: partially jointly explained with other cell types, grey: explained away by other cell types). Data are available in Supplementary Table 28.
Extended Data Fig. 11
Extended Data Fig. 11. Skeletal muscle populations.
a, UMAP embedding of transcriptional data from skeletal muscle using cells and nuclei. Mural, pericytes and smooth muscle cells. b, Scaled expression (log2FC) of selected markers for the major skeletal muscle populations. c, UMAP embedding of vascular and stromal populations of skeletal muscle. d, Scaled expression (log2FC) of marker genes used in Extended Data Fig. 3 for identification of vascular cell states. e, Predicted cell–cell interactions inferred using CellphoneDB statistical inference framework in skeletal muscle cells with 9,220 cells from five donors (n = 5) depicting cell states from c, Selected ligand–receptor interactions show specificity of NOTCH ligand–receptor pairing in defined vasculature beds. The interactions of EC_art-SMC are highlighted by a red rectangle and EC_ven-SMC are highlighted by a blue rectangle. Colour of the dots indicates the mean expression level of interacting molecule in partner 1 and interacting molecule partner 2. Mean of combined gene expression of interacting pairs (log2FC). CellPhoneDB P value of the specificity of the interactions = 10 × 10−5. Data are available in Supplementary Table 10. f, Scaled expression (log2FC) of the ligands and receptors from Extended Data Fig. 3 depicted on vascular populations of skeletal muscle.
Extended Data Fig. 12
Extended Data Fig. 12. Analysis technical information.
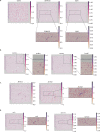
a, Locations and representative histology section of six cardiac regions sampled, including right and left atrium, right and left ventricular free wall and left ventricular apex and interventricular septum. H&E, magnification ×10; scale bars, 500 μm. b, Spatial visualization of positive and negative RNAscope control probes. Scale bars, 5 μm. For statistics and reproducibility, see Methods. c, Heat map of top five significantly enriched Gene Ontology Biological Processes term for each of the vascular subpopulations from Fig. 3a. Data are available in Supplementary Table 25. d, SCCAF scores for each batch aligned manifold. For each population, we plotted the true positive (TPR) versus false positive (FPR) learning ratios from the subpopulation in each manifold. Next, we plotted how accurately the manifold represents each learned subpopulation based on the test training set and the CV cross-validation set. The closer the CV value to the test value, the better the manifold is at representing the subpopulations.

Comment in

References

    1. Meilhac SM, Buckingham ME. The deployment of cell lineages that form the mammalian heart. Nat. Rev. Cardiol. 2018;15:705–724. - PubMed
    1. Svensson V, Vento-Tormo R, Teichmann SA. Exponential scaling of single-cell RNA-seq in the past decade. Nat. Protocols. 2018;13:599–604. - PubMed
    1. Wang L, et al. Single-cell reconstruction of the adult human heart during heart failure and recovery reveals the cellular landscape underlying cardiac function. Nat. Cell Biol. 2020;22:108–119. - PubMed
    1. Tucker NR, et al. Transcriptional and cellular diversity of the human heart. Circulation. 2020;142:466–482. - PMC - PubMed
    1. Chung AK, et al. Women have higher left ventricular ejection fractions than men independent of differences in left ventricular volume: the Dallas Heart Study. Circulation. 2006;113:1597–1604. - PubMed

Publication types

MeSH terms

Substances