. 2020 Sep 22;12(9):2715.
doi: 10.3390/cancers12092715.

Menin and Menin-Associated Proteins Coregulate Cancer Energy Metabolism

Affiliations

Menin and Menin-Associated Proteins Coregulate Cancer Energy Metabolism

Chih-Wei Chou et al. Cancers (Basel). .

Abstract

The interplay between glycolysis and mitochondrial oxidative phosphorylation (OXPHOS) is central to maintain energy homeostasis. It remains to be determined whether there is a mechanism governing metabolic fluxes based on substrate availability in microenvironments. Here we show that menin is a key transcription factor regulating the expression of OXPHOS and glycolytic genes in cancer cells and primary tumors with poor prognosis. A group of menin-associated proteins (MAPs), including KMT2A, MED12, WAPL, and GATA3, is found to restrain menin's full function in this transcription regulation. shRNA knockdowns of menin and MAPs result in reduced ATP production with proportional alterations of cellular energy generated through glycolysis and OXPHOS. When shRNA knockdown cells are exposed to metabolic stress, the dual functionality can clearly be distinguished among these metabolic regulators. A MAP can negatively counteract the regulatory mode of menin for OXPHOS while the same protein positively influences glycolysis. A close-proximity interaction between menin and MAPs allows transcriptional regulation for metabolic adjustment. This coordinate regulation by menin and MAPs is necessary for cells to rapidly adapt to fluctuating microenvironments and to maintain essential metabolic functions.

Keywords: circulating tumor cells; glycolysis; menin; menin-associated proteins; oxidative phosphorylation.


Conflict of interest statement

The authors declare that they have no conflict of interest.

Figures

Figure 1
Figure 1
Identification of MEN1-modulated genes in breast cancer cells. (A) RT-qPCR of MEN1 in T47D or MCF-7 cells treated with vehicle or MEN1 shRNA lentivirus (n = 3). (B) Quantitative Western immunoassays (WES) of menin expression in T47D or MCF-7 cells treated with vehicle or MEN1 shRNA lentivirus (n = 3). (C) Venn diagrams of differentially expressed genes (fold change ≥1.5 or ≤0.66) in T47D or MCF-7 cells after shMEN1 knockdown compared with vehicle controls (n = 2). (D) Pathway annotation analysis of MEN1-upregulated and MEN1-downregulated genes in T47D or MCF-7 cells using DAVID including cancer hallmark pathways. (E) Schematic illustration of five major metabolic pathways. (F) Expression heat maps of oxidative phosphorylation (OXPHOS) and glycolytic genes in both MEN1 knockdown T47D and MCF-7 cells (fold changes relative to vehicle controls). (G) Bar charts of the expression levels of representative OXPHOS and glycolytic genes affected by MEN1 knockdown in T47D or MCF-7 cells using RT-qPCR. Data are presented as mean ± S.D. Unpaired two-tailed Student’s t-test was used for statistics. * p < 0.05, ** p < 0.01, and *** p < 0.001.
Figure 2
Figure 2
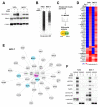
Identification of menin-associated proteins (MAPs) in breast cancer cells. (A) and (B) WES of BirA-Menin fusion proteins (A) and biotin-labeled proteins (B) in total lysates of BirA-MEN1 BioID engineered T47D or MCF-7 cells after incubating with or without doxycycline and biotin. (C) Schematic purification and proteomic identification of MAPs using LC–MS/MS. (D) Heatmap of the quantification of 35 MAPs commonly shared in T47D and MCF-7 cells. MAPs further verified by WES immunoassays were indicated by arrows. (E) Network analysis of 35 MAPs in MCF-7 cells. The distance between menin and MAPs represented the quantitative ratio of each MAP and menin. MAPs marked in blue were further assayed by WES. (F) Nuclear or cytoplasmic lysates of BirA-MEN1 BioID engineered T47D or MCF-7 cells after streptavidin beads pull-down were detected by WES with antibodies against menin, KMT2A, MED12, WAPL, GATA3, LaminA/C, or GAPDH. FL, full length; SP, spliced form.
Figure 3
Figure 3
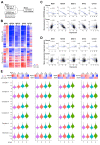
Expression correlation relationship of menin/MAPs genes and OXPHOS/glycolytic genes. (A) Workflow of the in silico correlation analysis of gene expression in The Cancer Genome Atlas (TCGA) breast cancer cohort. (B) Heatmaps of the expression correlation between MEN1/selected 4 MAP genes and OXPHOS genes (upper) or glycolytic genes (lower) in normal (N) and tumor (T) samples. The genes are arranged from the highest to the lowest according to gene expression correlation coefficients of MEN1–OXPHOS genes or MEN1–glycolytic genes in breast tumors. (C) and (D) Scatter plots and linear regression analyses of MEN1/selected MAPs expression and mean expression of OXPHOS genes (C) or glycolytic genes (D) in normal and tumor samples. (E) Violin plots (lower panel) shows the average expressions of the genes of OXPHOS complexes I-V and glycolysis in the samples of each of the corresponding 4 groups are shown as violin plots. Based on the median values (where ≥median is “high” and <median is “low”) of the expression of the corresponding individual genes (KMT2A, MEN12, WAPL, and GATA3) and MEN1, the TCGA breast tumor samples were divided into 4 groups—1: high-low, 2: high-high, 3: low-low, and 4: low-high (upper panel). Letters on top of the violin plot denote statistical significance, where two groups with different letters are significantly different (p < 0.05) and those with the same letter are not.
Figure 4
Figure 4
Bioenergetic dynamics are regulated by menin and MAPs in T47D and MCF-7 cells. (A) and (B) Glycolytic and OXPHOS ATP productions in T47D (A) or MCF-7 (B) cells infected with vehicle, shMEN1, shKMT2A, shMED12, shWAPL, or shGATA3 lentivirus. Statistics represented the difference of glycolytic or OXPHOS ATP production between shRNA knockdown and vehicle controls. (C) and (D) Bar charts representing mitochondrial functions in the single knockdown of MEN1, KMT2A, MED12, WAPL, or GATA3 and their vehicle control in T47D (C) or MCF-7 (D) cells. (E) Schematic summary of mitochondrial dynamics affected by the knockdown of MEN1 or MAPs. (F,G) Bar charts represented the glycolytic functions in T47D (F) or MCF-7 (G) cells subject to gene knockdown by shMEN1, shKMT2A, shMED12, shWAPL, or shGATA3 lentivirus. (H) Schematic summary of glycolytic functions affected by the knockdown of MEN1 or MAPs. Data are presented as mean ± S.D. (n = 15–20 technical-replicate wells). Statistical significance was performed by an unpaired two-tailed Student’s t-test between treated groups and corresponding controls. * p < 0.05, ** p < 0.01, and *** p < 0.001.
Figure 5
Figure 5
Integrity of the menin–KMT2A complex is required for OXPHOS functions. (A) WES of T47D or MCF-7 cells treated with DMSO or 1 μM MI-503 for 3 days (left). Relative protein expression normalized to the average of LaminA/C in WES (right). FL, full length; SP, spliced form. (B) Nuclear lysates of T47D or MCF-7 cells treated with DMSO or 1 μM of MI-503 for 3 days were immunoprecipitated with the menin antibody or IgG, and assayed by WES (upper). Relative protein expression in WES (lower). The protein expression in DMSO treated input was normalized as 1. FL, full length; SP, spliced form. (C) Glycolytic or OXPHOS ATP production in T47D or MCF-7 cells treated with 1 μM MI-503 for 0, 1, 3, 6, and 72 h, or DMSO control for 72 h. (D,E) Bar charts of the Seahorse mitochondrial stress test (D) and glycolytic stress test (E) on T47D or MCF-7 cells treated with 1 μM MI-503 for 0, 1, 3, 6, and 72 h, or DMSO for 72 h. Data are presented as mean ± S.D. (n = 10–15 technical-replicate wells). An unpaired two-tailed Student’s t-test was used to determine statistical significance for the difference between MI-503-treated groups and its controls. * p < 0.05, ** p < 0.01, and *** p < 0.001.
Figure 6
Figure 6
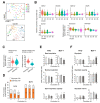
MEN1 and OXPHOS expression are increased in breast circulating tumor cells (CTCs). (A) t-SNE profile plots and cell clustering of 93 CTCs from 5 breast cancer patients based on the single cell RT-qPCR expression profiling of 11 OXPHOS genes (NDUFA7, NDUFA11, NDUFA13, NDUFB7, NDUFS7, NDUFS8, NDUFV1, SDHA, SDHB, SDHC, and SDHD). (B) Violin plots of MEN1 or selected MAPs expression, mean expression of 7 glycolytic genes (ALDOA, ALDOC, ENO1, PFKL, PFKP, PGK1, and TPI1) or mean expression of 11 OXPHOS genes (aforementioned) in the five cell clusters. Statistical significance among clusters was carried out using the Duncan multi-range test. (C) Mean expression of 7 glycolytic genes and 11 OXPHOS genes in these 93 breast CTCs or in the TCGA primary breast cancer cohort. (D) Glycolytic and OXPHOS ATP productions of T47D or MCF-7 cells after circulation (n = 6–10 technical replicates). (E,F) Mitochondrial (E) and glycolytic (F) functions of T47D or MCF-7 cells after circulation (n = 5–9 technical-replicate wells). Statistics represented the difference between no circulating control and each treatment. Data are presented as mean ± S.D. An unpaired two-tailed Student’s t-test was used for statistical significance determination. * p < 0.05, ** p < 0.01, and *** p < 0.001.

References

    1. Matkar S., Thiel A., Hua X. Menin: A scaffold protein that controls gene expression and cell signaling. Trends Biochem. Sci. 2013;38:394–402. doi: 10.1016/j.tibs.2013.05.005. - DOI - PMC - PubMed
    1. Thakker R.V., Newey P.J., Walls G.V., Bilezikian J., Dralle H., Ebeling P.R., Melmed S., Sakurai A., Tonelli F., Brandi M.L. Clinical practice guidelines for multiple endocrine neoplasia type 1 (MEN1) J. Clin. Endocrinol. Metab. 2012;97:2990–3011. doi: 10.1210/jc.2012-1230. - DOI - PubMed
    1. Qiu H., Jin B.-M., Wang Z.-F., Xu B., Zheng Q.-F., Zhang L., Zhu L.-Y., Shi S., Yuan J.-B., Lin X., et al. MEN1 deficiency leads to neuroendocrine differentiation of lung cancer and disrupts the DNA damage response. Nat. Commun. 2020;11:1–12. doi: 10.1038/s41467-020-14614-4. - DOI - PMC - PubMed
    1. Dreijerink K.M., Goudet P., Burgess J., Valk G.D. International Breast Cancer in MEN1 Study Group Breast-cancer predisposition in multiple endocrine neoplasia type. N. Engl. J. Med. 2014;371:583–584. - PMC - PubMed
    1. Pantaleo M.A., Urbini M., Indio V., Ravegnini G., Nannini M., De Luca M., Tarantino G., Angelini S., Gronchi A., Vincenzi B., et al. Genome-wide analysis identifies MEN1 and MAX mutations and a neuroendocrine-like oolecular heterogeneity in quadruple WT GIST. Mol. Cancer Res. 2017;15:553–562. doi: 10.1158/1541-7786.MCR-16-0376. - DOI - PubMed