. 2020 Sep 22;20(18):5446.
doi: 10.3390/s20185446.

Sensing Systems for Respiration Monitoring: A Technical Systematic Review

Affiliations

Sensing Systems for Respiration Monitoring: A Technical Systematic Review

Erik Vanegas et al. Sensors (Basel). .

Abstract

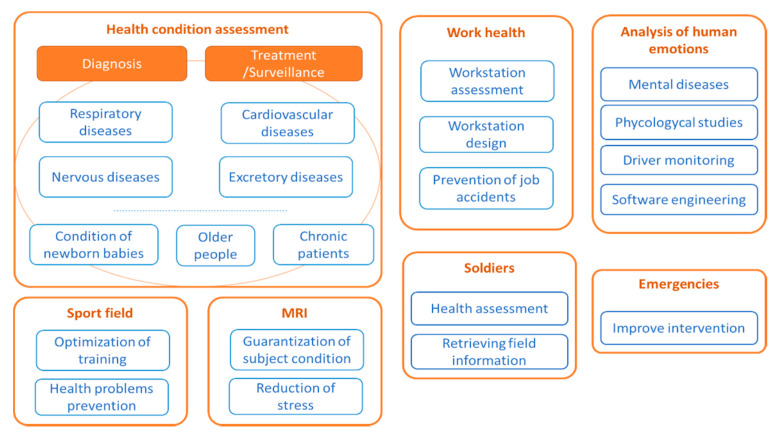
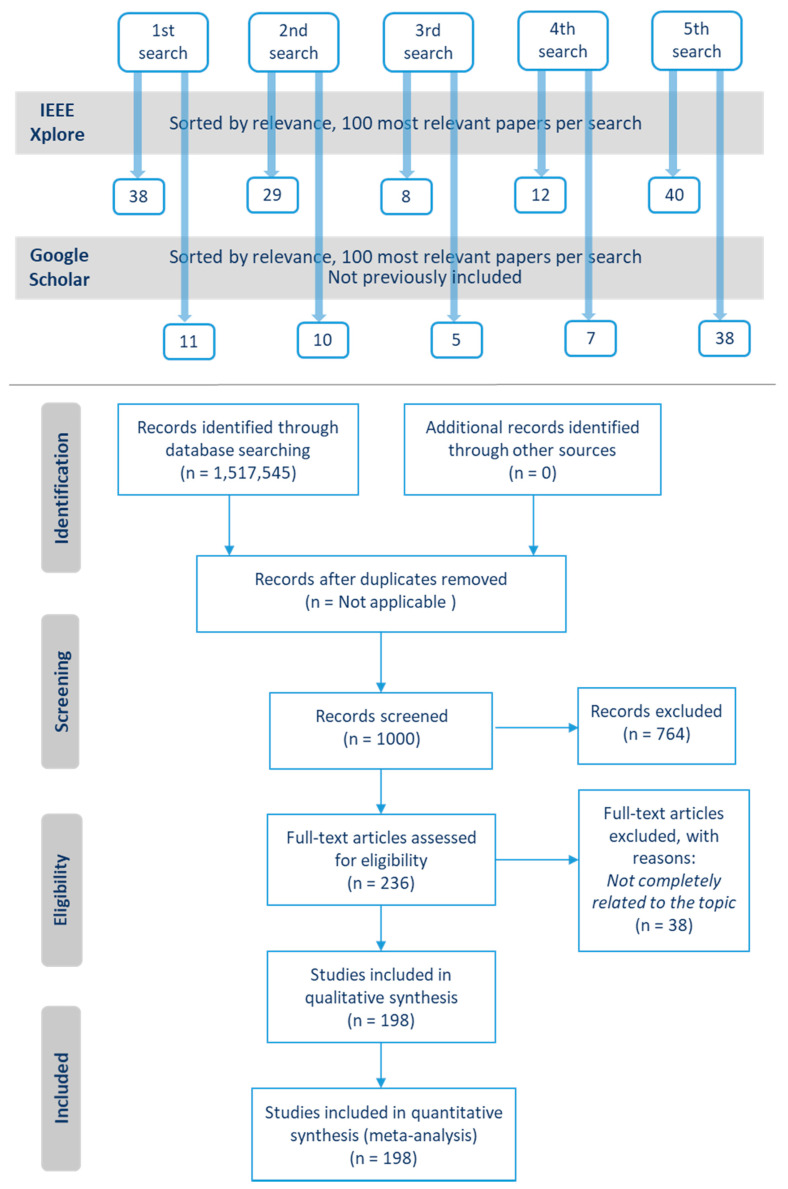
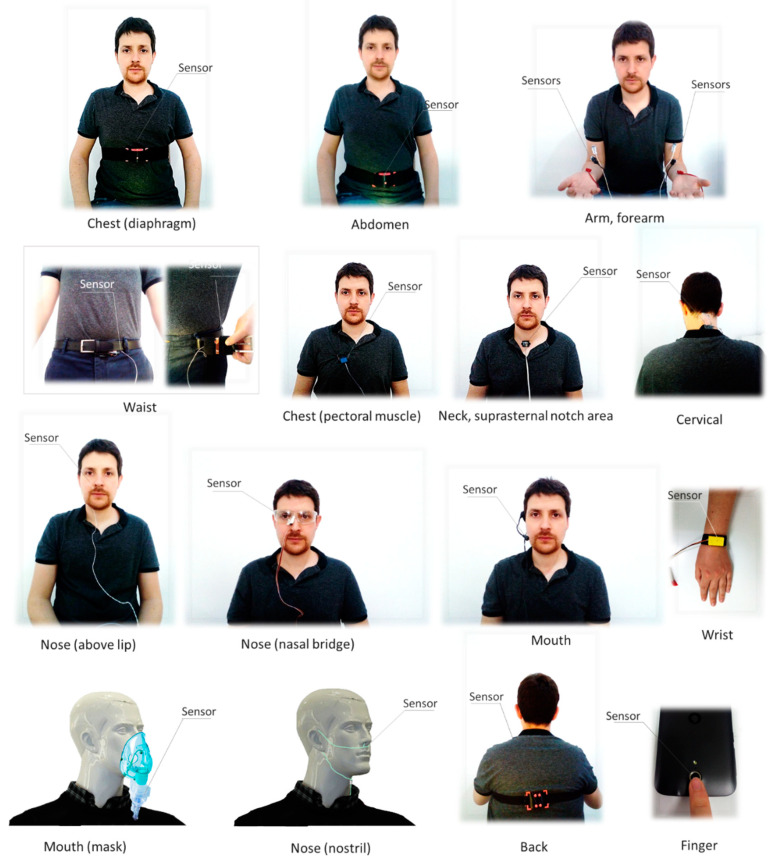
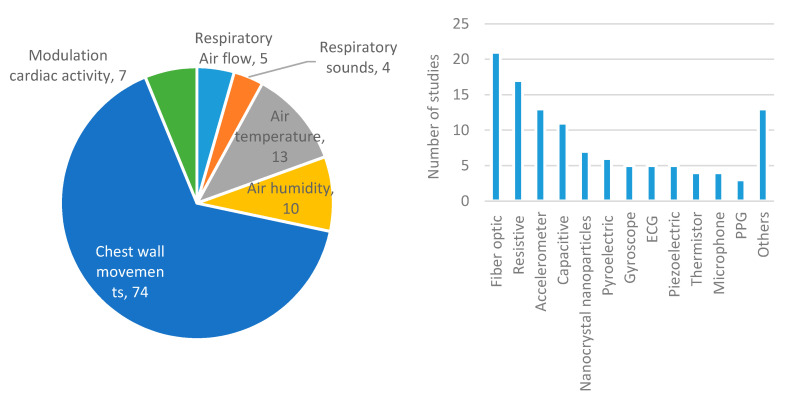
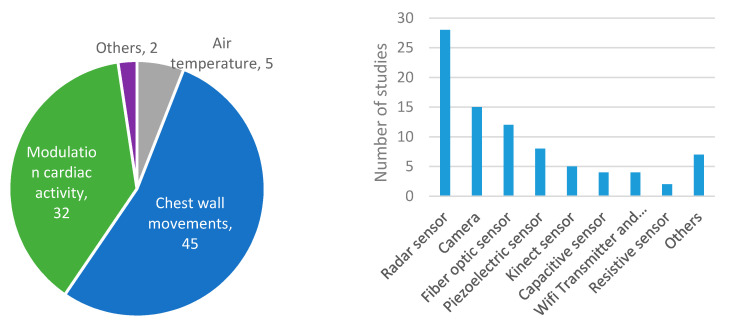
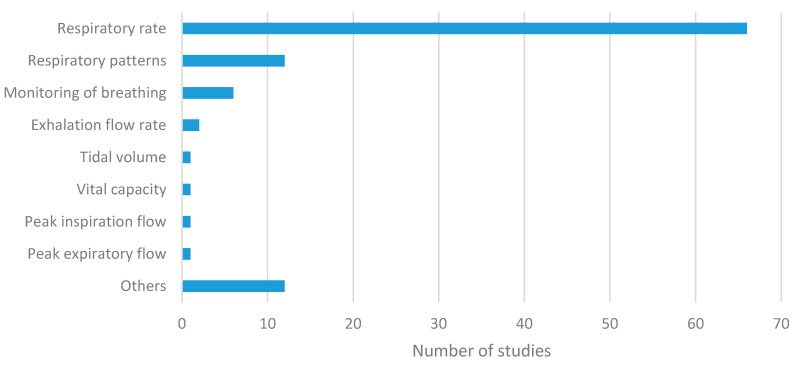
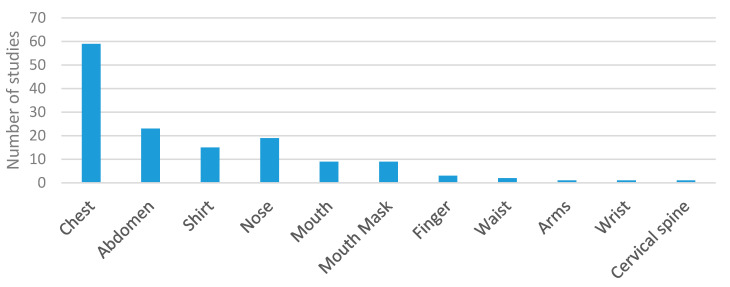
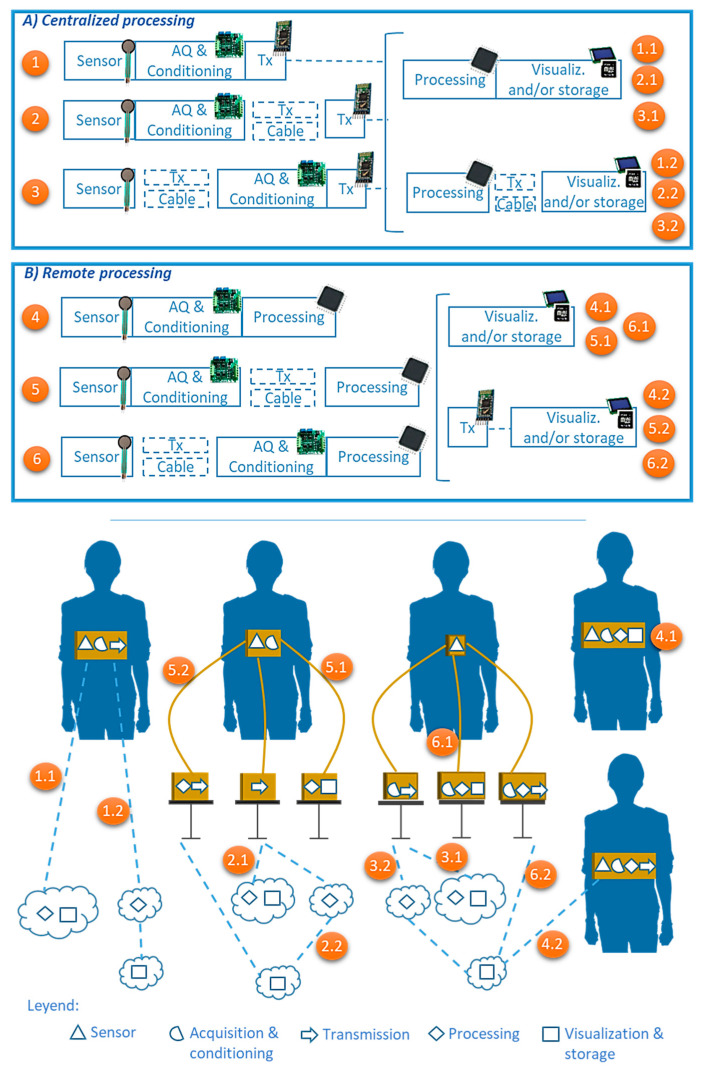
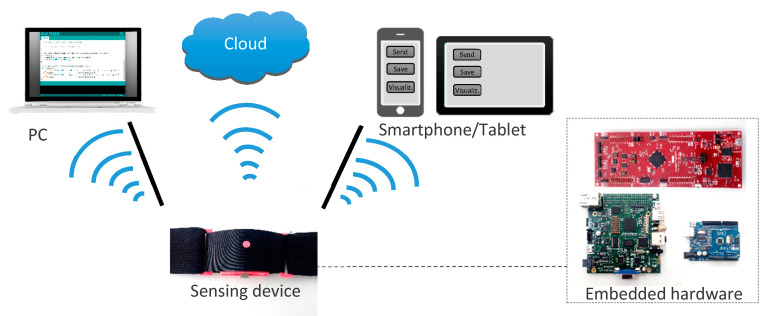
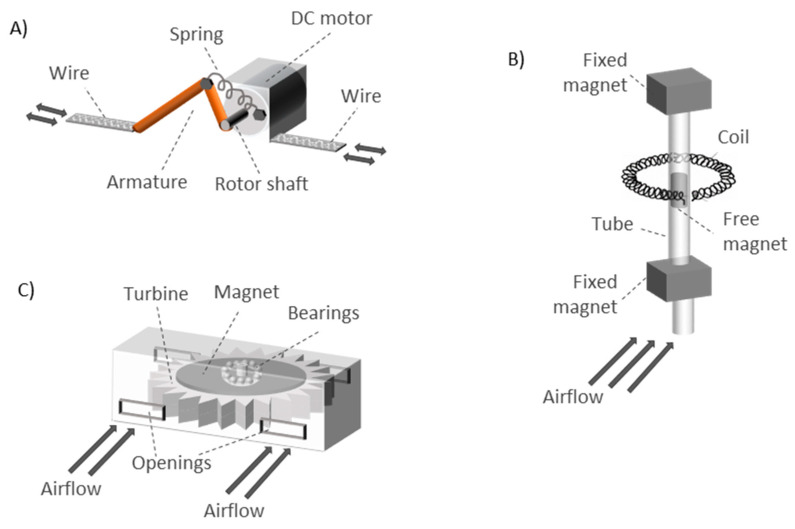
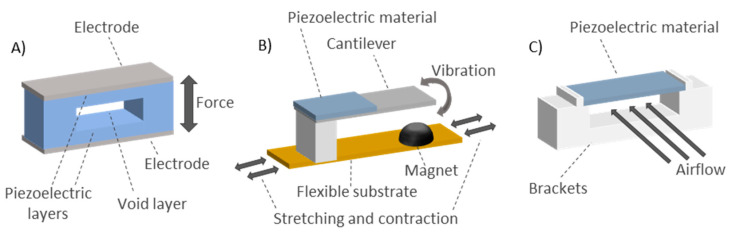
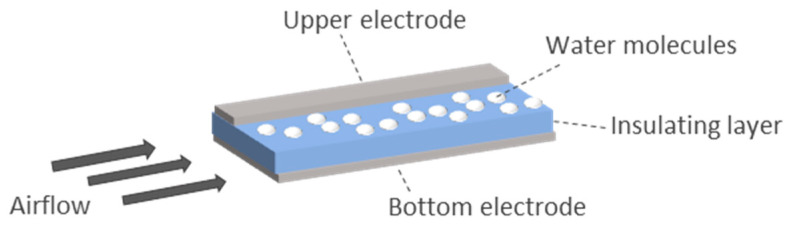
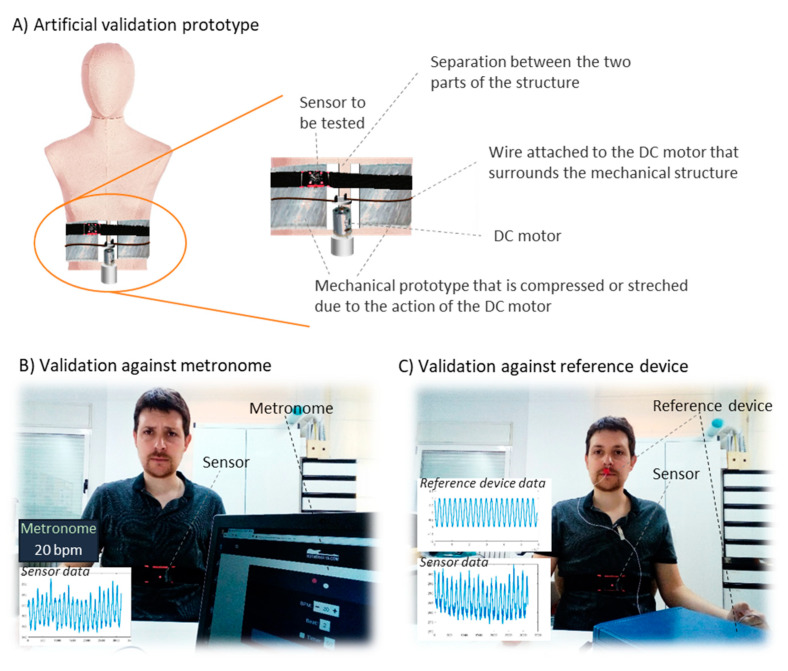
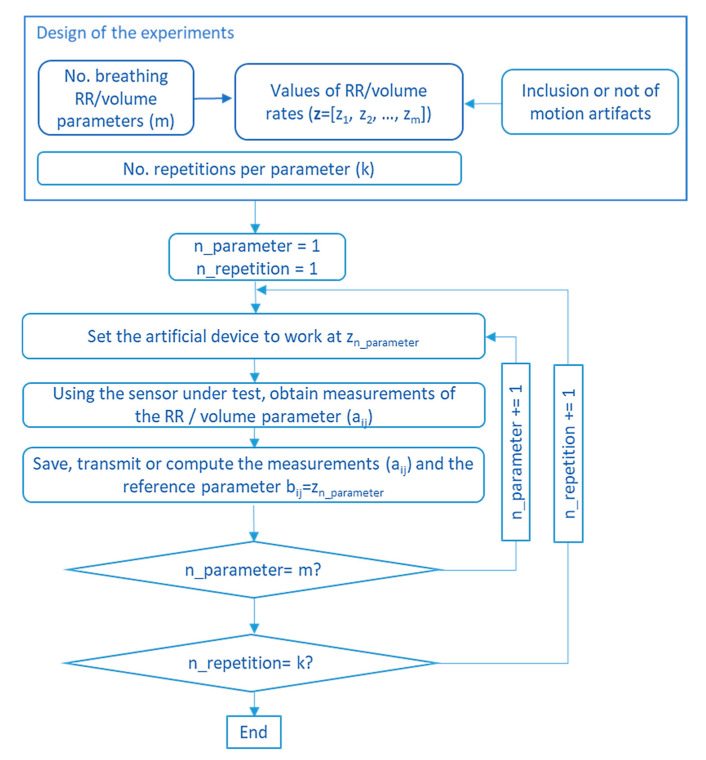
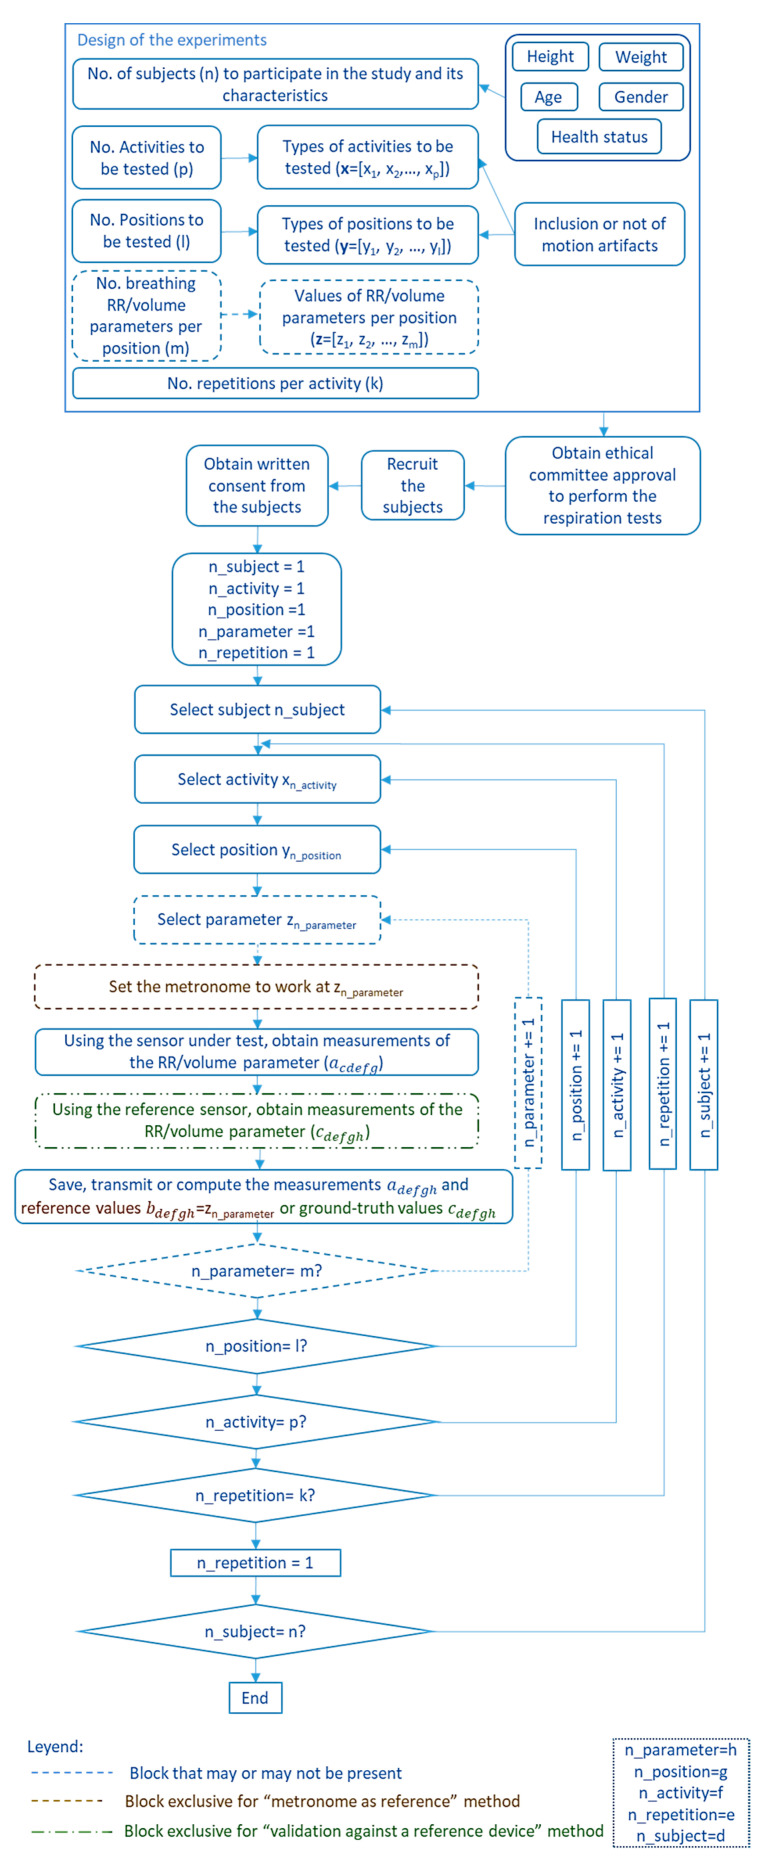
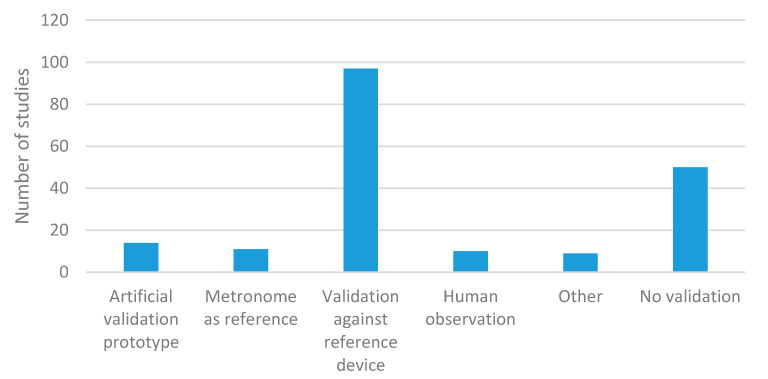
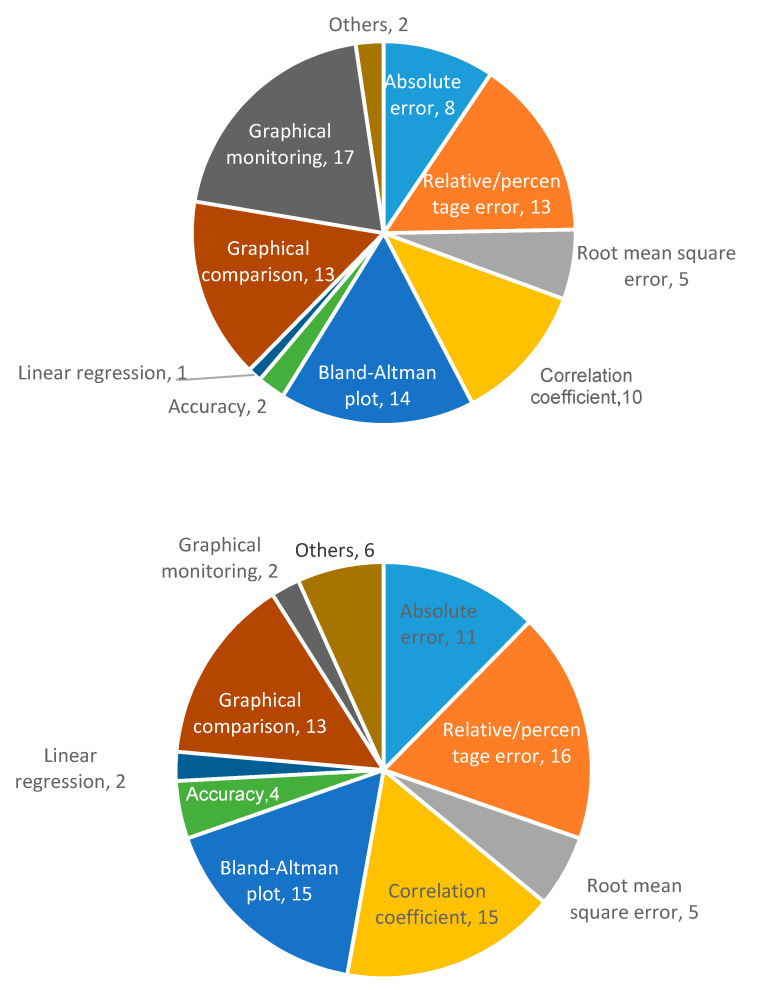
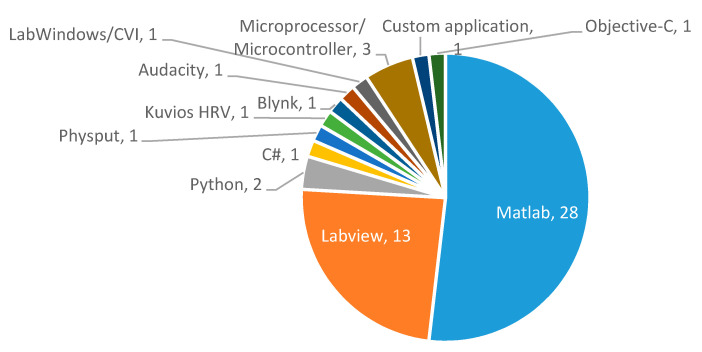
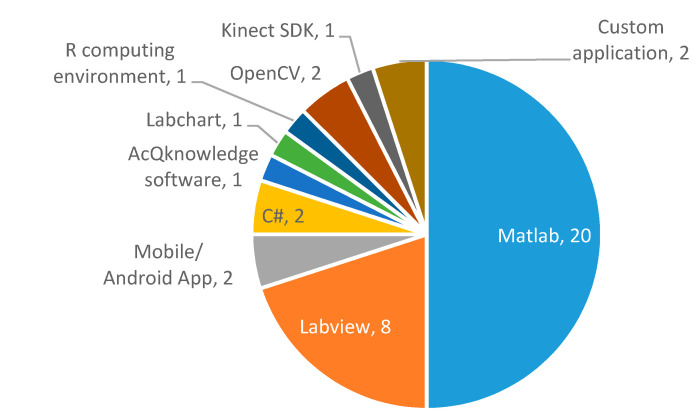
Respiratory monitoring is essential in sleep studies, sport training, patient monitoring, or health at work, among other applications. This paper presents a comprehensive systematic review of respiration sensing systems. After several systematic searches in scientific repositories, the 198 most relevant papers in this field were analyzed in detail. Different items were examined: sensing technique and sensor, respiration parameter, sensor location and size, general system setup, communication protocol, processing station, energy autonomy and power consumption, sensor validation, processing algorithm, performance evaluation, and analysis software. As a result, several trends and the remaining research challenges of respiration sensors were identified. Long-term evaluations and usability tests should be performed. Researchers designed custom experiments to validate the sensing systems, making it difficult to compare results. Therefore, another challenge is to have a common validation framework to fairly compare sensor performance. The implementation of energy-saving strategies, the incorporation of energy harvesting techniques, the calculation of volume parameters of breathing, or the effective integration of respiration sensors into clothing are other remaining research efforts. Addressing these and other challenges outlined in the paper is a required step to obtain a feasible, robust, affordable, and unobtrusive respiration sensing system.

Keywords: breathing sensor; comprehensive review; respiration sensor; respiratory monitoring; sensor comparison; systematic review; technical review.


Conflict of interest statement

The authors declare no conflict of interest.

Figures

Figure 1
Figure 1
Most common application fields of sensing systems to monitor breathing.
Figure 2
Figure 2
Literature search results and selection procedure (top). PRISMA diagram (bottom).
Figure 3
Figure 3
Analysis structure.
Figure 4
Figure 4
Graphical explanation of the different breathing parameters. Signal (A) could come directly from the ADC (analog-to-digital converter) of the sensing system, although it is also possible that it represents physical respiration magnitudes. This figure shows a general representation that is not contextualized to a specific sensing system. The same goes for signal (B).
Figure 5
Figure 5
Most common sensor locations for respiration monitoring. The sensors shown are for contextualization purposes.
Figure 6
Figure 6
Distribution of sensing techniques (left) and sensors (right) used in the studies of the wearable category.
Figure 7
Figure 7
Distribution of sensing techniques (left) and sensors (right) used in the studies of the environmental category.
Figure 8
Figure 8
Number of studies obtaining the different respiratory parameters for the wearable (top) and environmental (bottom) categories.
Figure 8
Figure 8
Number of studies obtaining the different respiratory parameters for the wearable (top) and environmental (bottom) categories.
Figure 9
Figure 9
Distribution of sensor location for the wearable studies.
Figure 10
Figure 10
Distribution of sensor location for the environmental studies.
Figure 11
Figure 11
Representation of possible setups of respiratory sensing systems. (A) perform data processing on a centralized processing platform and (B) perform data processing near the remote sensing unit.
Figure 12
Figure 12
Representation of possible setups of respiratory sensing systems.
Figure 13
Figure 13
Schemes of energy harvesting using magnetic induction generation: (A) DC generator activated by chest movements (figure inspired by Reference [135]), (B) tube with fixed and free magnets moved by airflow (figure inspired by Reference [240]), and (C) turbine moved by airflow (figure inspired by Reference [241]).
Figure 14
Figure 14
Piezoelectric energy harvesters. Three possible configurations are shown: (A) power generation based on compression or stretching movements associated with breathing (figure inspired by Reference [244]), (B) energy harvesting based on vibration amplified by a magnet (figure inspired by Reference [243]), and (C) technique using low speed airflow (figure inspired by Reference [245]).
Figure 15
Figure 15
Setups for triboelectric energy harvesting. Three possible configurations are shown: (A) flat belt-attached setup (figure inspired by Reference [246]), (B) Z-shaped connector (figure inspired by Reference [77]), and (C) movable and fixed supports (figure inspired by Reference [247]).
Figure 16
Figure 16
Electrostatic energy harvesting based on the variation of the area of the upper electrode owing to humidity of the exhaled air (figure inspired by Reference [248]).
Figure 17
Figure 17
Schematic of a pyroelectric energy harvester using a mask-mounted breathing prototype (figure inspired by Reference [253]).
Figure 18
Figure 18
Example of a solar-powered system composed of a solar module, a charge regulator and a microcontroller. The voltage regulator receives an input voltage from the solar cell in the range of 0.3 V to 6 V. The charge regulator manages the charge of the battery (at constant voltage and current). The battery is connected in parallel to the internal voltage regulator of the microcontroller of the system.
Figure 19
Figure 19
Charge regulator and battery (low capacity, 150 mAh) integrated into the sensing prototype developed by Vanegas et al. [254], slightly modified. The sensor used in that prototype (a force-sensitive resistor) is included separately for size comparison. Units: cm.
Figure 20
Figure 20
Number of studies adopting wired or wireless data transmission in respiration sensing systems.
Figure 21
Figure 21
Number of respiratory monitoring studies that considered different types of communication technologies.
Figure 22
Figure 22
Number of studies adopting the different processing units.
Figure 23
Figure 23
Distribution of battery lives reported in the respiratory monitoring studies.
Figure 24
Figure 24
Common positions/activities to validate the breathing sensors (sitting, standing, lying down, walking, running, and sleeping). Chest sensor used as an example.
Figure 25
Figure 25
Representation of different validation approaches: (A) use of artificial validation prototypes, (B) validation using a metronome, and (C) validation using a reference device.
Figure 26
Figure 26
Flow diagram of a typical validation procedure using artificial prototypes.
Figure 27
Figure 27
Flow chart for the validation of a respiration sensor using the methods “metronome as reference” and “validation against a reference device”.
Figure 28
Figure 28
Number of studies that adopted the different validation approaches.
Figure 29
Figure 29
Peak detection of a sample respiration signal obtained from the public breathing dataset published in Reference [254]. (A) Peak detection of a noisy signal without filtering. (B) Peak detection imposing a restriction of p surrounding number of samples (in green the peak accepted). (C) Example of a peak accepted (left, green peak) and a peak discarded (right, red peak) when applying the slope restriction. (D) Example of a peak reaching (green) and not reaching (red) the minimum prominence level PP to be considered a valid peak. (E) Example of two peaks (red) not fulfilling the minimum horizontal distance restriction TD. (F) Example of a peak (red) not fulfilling the vertical minimum level restriction and two peaks that surpass level TL (green peaks). (G) Example of two peaks discarded (red) for not differing the imposed tidal volume (TV) level from a detected peak (green).
Figure 30
Figure 30
Zero-crossings method exemplified in a real signal obtain from the public breathing dataset of Vanegas et al. [254]. (A) Effect of the presence of outliers in the signals in the calculation of the “zero level”. (B) Example of a signal with trends and results of applying a de-trend processing. (C) Example of using different “zero levels” in a signal with trends. (D) Example of a noisy signal with several zero-crossings detected when only one of them (green) should have been considered.
Figure 31
Figure 31
Frequency analysis of sample real respiratory signals obtained from a public dataset [254]. (A) Effect of the time window (4 s, 8 s, and 16 s) on the frequency calculation. The true frequency is 0.33 Hz (3 s period) and the sampling frequency is 50 Hz. Results for the 16-s time window (Table A3, 0.3125–0.344 Hz) are closer to the true value. (B) Effect of noise on frequency detection (noisy signal and its spectrum -B.1-, filtered signal and its spectrum -B.2-). (C) Example of a breathing signal with low frequency fluctuations. (D) Example of a breathing signal with fluctuations due to movements of the subject and its spectrum.
Figure 32
Figure 32
Wavelet transform. (A) 2D representation of the continuous wavelet transform (CWT) (right) of an example signal (left) taken from a dataset of real respiration signals [254] (RR of 20 bpm −0.33 Hz-, and sampling frequency of 50 Hz). (B) Multiresolution analysis (MRA) decomposition process (top). The lower part shows an example of the MRA analysis applied to the signal above ((A), left). Six-level decomposition was applied using the ‘Haar’ wavelet. Two detail levels and the sixth approximation level are represented. The spectrum of the approximation coefficients (level 6) was obtained.
Figure 33
Figure 33
Kalman filter algorithm for the fusion of different respiration sensors.
Figure 34
Figure 34
Number of studies using different processing algorithms for the wearable (left) and environmental (right) categories.
Figure 35
Figure 35
Number of studies using the different figures of merit to determine sensor performance for the wearable (top) and environmental (bottom) categories.
Figure 36
Figure 36
Number of studies using the different processing tools for the wearable (top) and environmental (bottom) categories.
Figure 36
Figure 36
Number of studies using the different processing tools for the wearable (top) and environmental (bottom) categories.

Similar articles

Cited by

References

    1. Milenković A., Otto C., Jovanov E. Wireless sensor networks for personal health monitoring: Issues and an implementation. Comput. Commun. 2006;29:2521–2533. doi: 10.1016/j.comcom.2006.02.011. - DOI
    1. Cao Z., Zhu R., Que R.-Y. A wireless portable system with microsensors for monitoring respiratory diseases. IEEE Trans. Biomed. Eng. 2012;59:3110–3116. - PubMed
    1. Yang X., Chen Z., Elvin C.S.M., Janice L.H.Y., Ng S.H., Teo J.T., Wu R. Textile Fiber Optic Microbend Sensor Used for Heartbeat and Respiration Monitoring. IEEE Sens. J. 2015;15:757–761. doi: 10.1109/JSEN.2014.2353640. - DOI
    1. Subbe C.P., Kinsella S. Continuous monitoring of respiratory rate in emergency admissions: Evaluation of the RespiraSenseTM sensor in acute care compared to the industry standard and gold standard. Sensors. 2018;18:2700. doi: 10.3390/s18082700. - DOI - PMC - PubMed
    1. Heldt G.P., Ward R.J., III Evaluation of Ultrasound-Based Sensor to Monitor Respiratory and Nonrespiratory Movement and Timing in Infants. IEEE Trans. Biomed. Eng. 2016;63:619–629. doi: 10.1109/TBME.2015.2466633. - DOI - PMC - PubMed

Publication types