. 2020 Nov 10;142(19):1831-1847.
doi: 10.1161/CIRCULATIONAHA.119.044557. Epub 2020 Sep 25.

Single-Cell RNA Sequencing Analysis Reveals a Crucial Role for CTHRC1 (Collagen Triple Helix Repeat Containing 1) Cardiac Fibroblasts After Myocardial Infarction

Affiliations

Single-Cell RNA Sequencing Analysis Reveals a Crucial Role for CTHRC1 (Collagen Triple Helix Repeat Containing 1) Cardiac Fibroblasts After Myocardial Infarction

Adrián Ruiz-Villalba et al. Circulation. .

Abstract

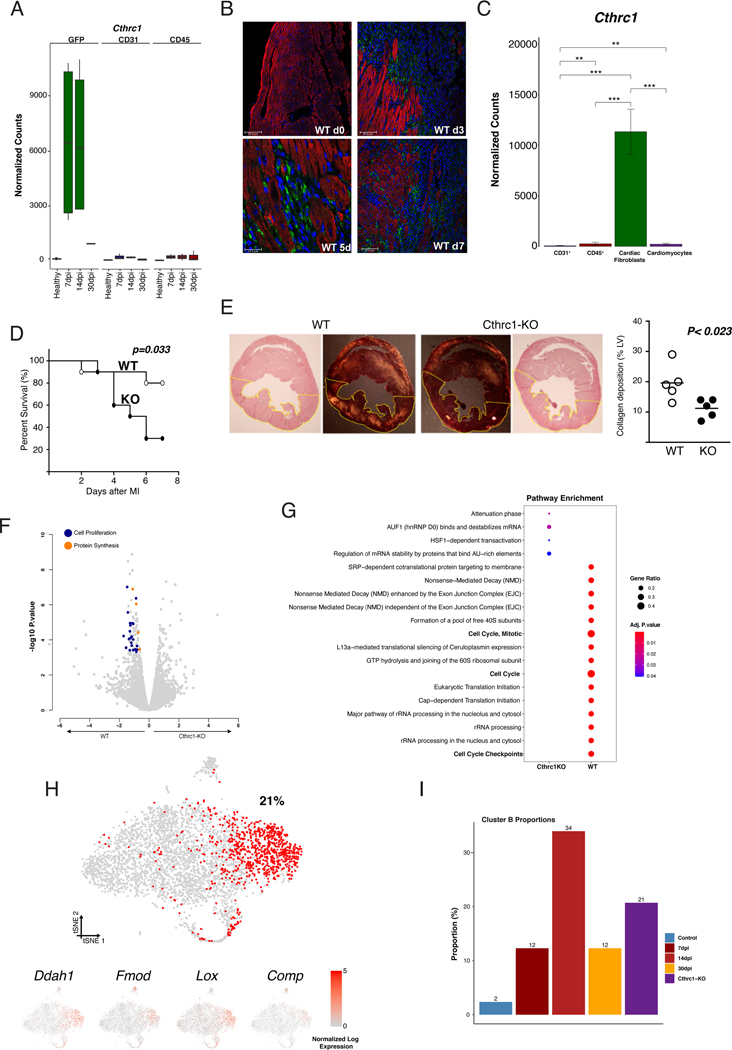
Background: Cardiac fibroblasts (CFs) have a central role in the ventricular remodeling process associated with different types of fibrosis. Recent studies have shown that fibroblasts do not respond homogeneously to heart injury. Because of the limited set of bona fide fibroblast markers, a proper characterization of fibroblast population heterogeneity in response to cardiac damage is lacking. The purpose of this study was to define CF heterogeneity during ventricular remodeling and the underlying mechanisms that regulate CF function.

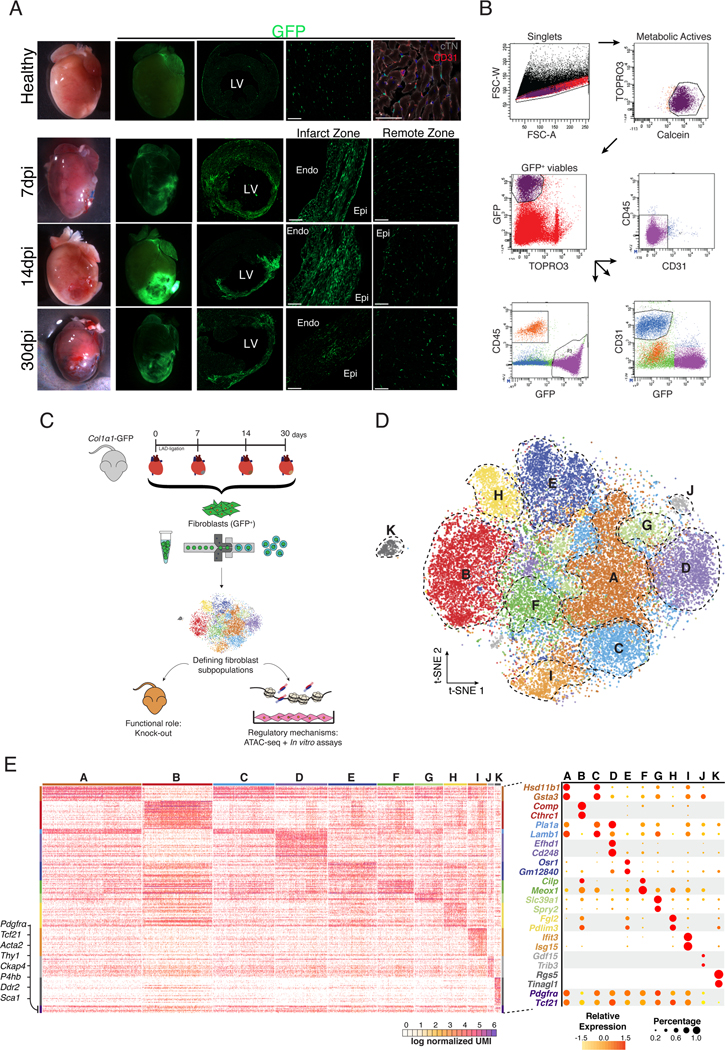
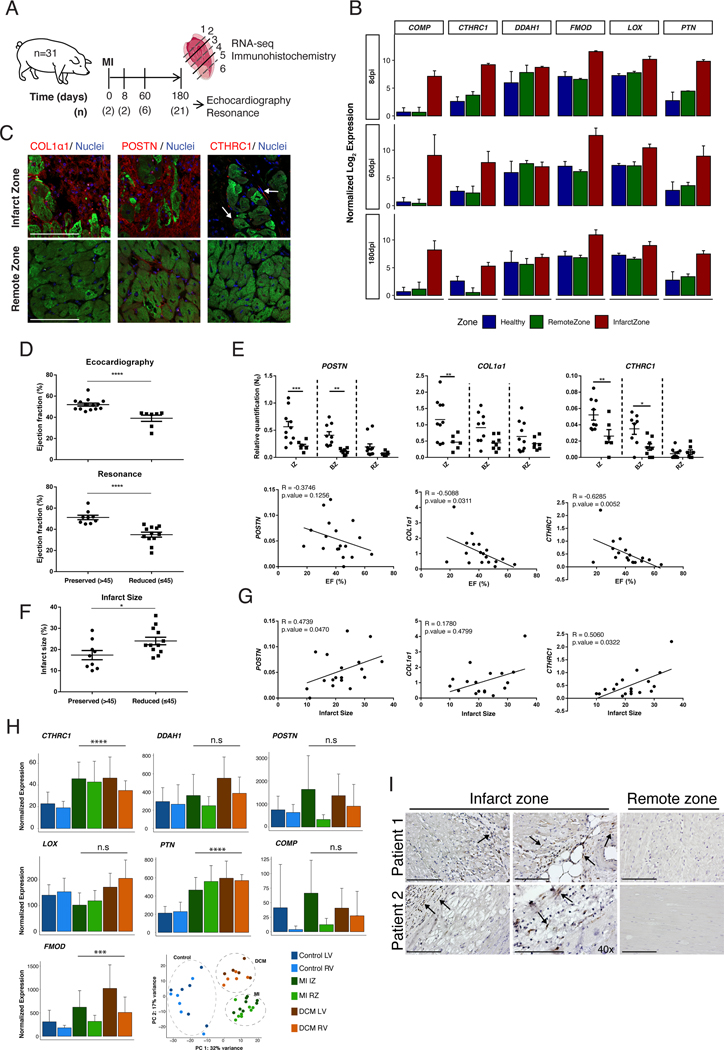
Methods: Collagen1α1-GFP (green fluorescent protein)-positive CFs were characterized after myocardial infarction (MI) by single-cell and bulk RNA sequencing, assay for transposase-accessible chromatin sequencing, and functional assays. Swine and patient samples were studied using bulk RNA sequencing.

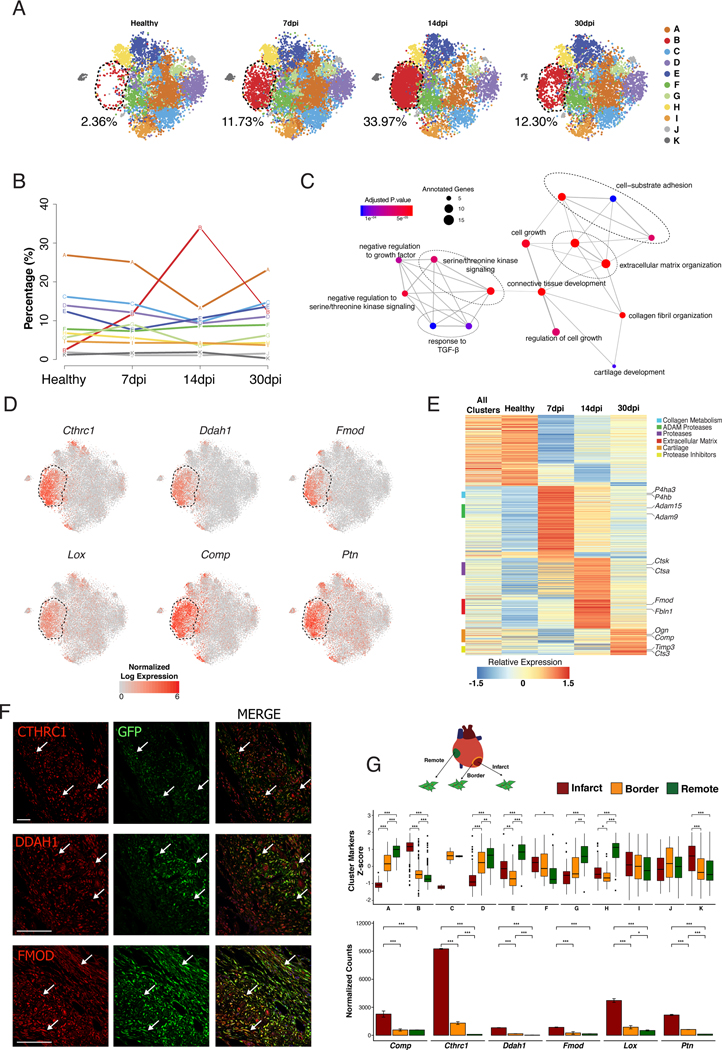
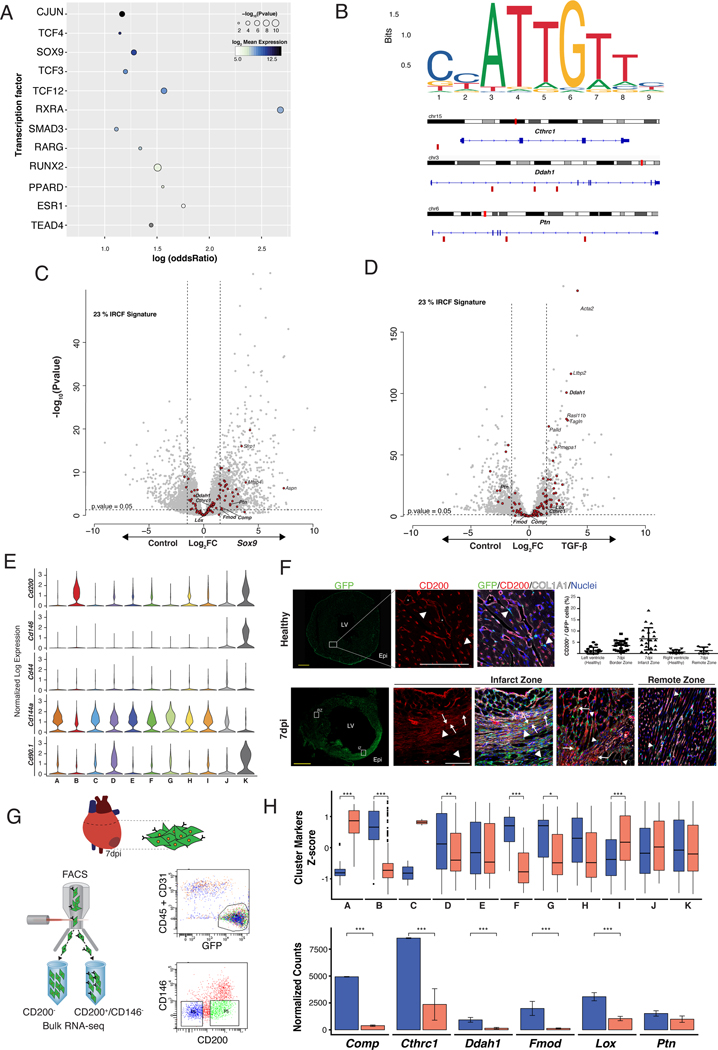
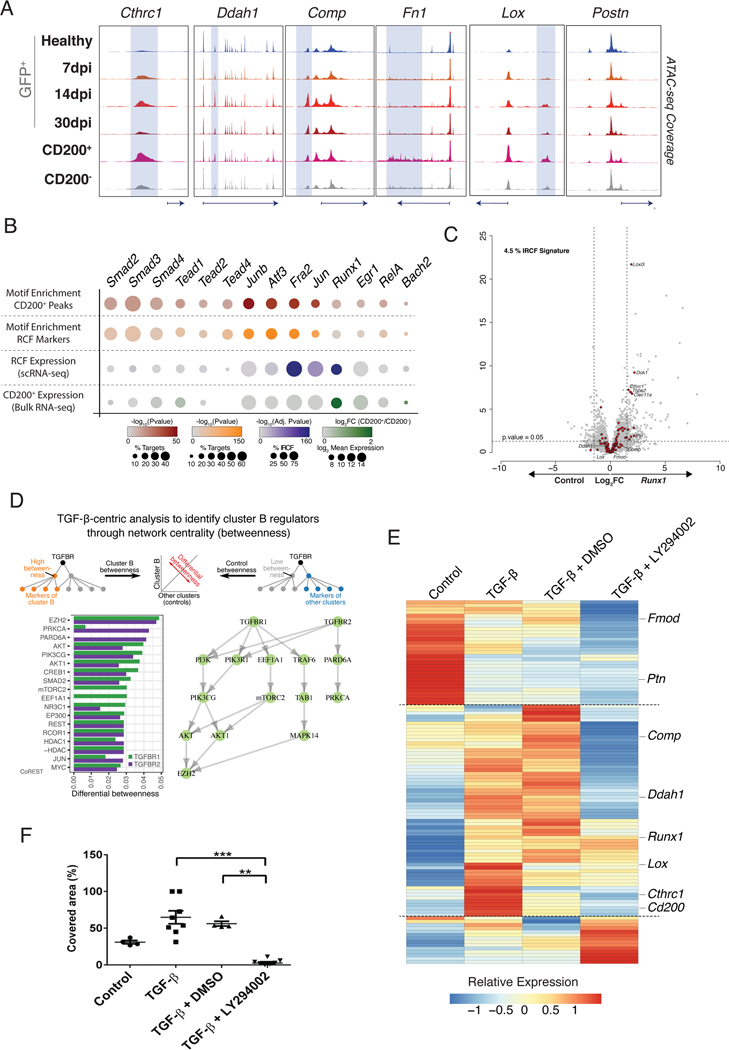
Results: We identified and characterized a unique CF subpopulation that emerges after MI in mice. These activated fibroblasts exhibit a clear profibrotic signature, express high levels of Cthrc1 (collagen triple helix repeat containing 1), and localize into the scar. Noncanonical transforming growth factor-β signaling and different transcription factors including SOX9 are important regulators mediating their response to cardiac injury. Absence of CTHRC1 results in pronounced lethality attributable to ventricular rupture. A population of CFs with a similar transcriptome was identified in a swine model of MI and in heart tissue from patients with MI and dilated cardiomyopathy.

Conclusions: We report CF heterogeneity and their dynamics during the course of MI and redefine the CFs that respond to cardiac injury and participate in myocardial remodeling. Our study identifies CTHRC1 as a novel regulator of the healing scar process and a target for future translational studies.

Keywords: fibroblasts; myocardial infarction; sequence analysis, RNA.


Conflict of interest statement

Conflict of interest: None declared.

Figures

Figure 1:
Figure 1:. CF are a heterogeneous population of cells.
(A) Overview of healthy hearts and infarcted ones at 7, 14 and 30 dpi using bright field and fluorescence microscopy. Overview and detail of transverse sections showing GFP+ cell distribution in the free wall of the LV in healthy and 7, 14 and 30 dpi in the infarct and remote zones. Detail of GFP+ cardiac interstitial cells. Cardiac Troponin-I+ (cTN) cardiomyocytes (grey), CD31+ endothelial cells (red), nuclei (DAPI, blue). (B) Representative gating for isolation of GFP+/CD31/CD45 CIC as performed in healthy and at 7, 14 and 30 dpi hearts. From left to right: gating for singlets, metabolically active (Calcein+/TOPRO3), viable cells (GFP+/TOPRO3), and GFP+ cells that are negative for CD45 and CD31. (C) Schematic representation of the experimental design. Col1α1-GFP mice were subjected to MI and GFP+ CF were isolated at different time-points (healthy, 7, 14 and 30 dpi). These cells were used for scRNA-seq. The functional role of CF was analyzed with a mouse knock-out model and their regulatory mechanisms with ATAC-seq and in vitro assays to validate the hypothesis generated. (D) t-distributed stochastic neighbor embedding (t-SNE) plot of the global CF population (29,176 cells) comprising the four different times. Plot is color coded by clusters (A-K) identified through unsupervised analysis. Dashed lines delimit clusters. (E) Heatmap showing log normalized UMIs for scRNA-seq analyses cells. Top and side bars indicate clusters. Traditional marker genes for CF are indicated (left). Dot plot of expression and specificity of top markers (two) for identified clusters. Dot size represents percentage of cells per cluster expressing the given marker and color represents the relative expression. CIC = cardiac interstitial cells; Endo = endocardium; Epi = epicardium; LV = left ventricle. Scale bars: 100 μm (37 μm in top right picture in A).
Figure 2:
Figure 2:. Dynamics of CF heterogeneity reveals a unique subpopulation that responds to MI.
(A) t-SNE plot showing CF heterogeneity at different time-points. Number indicates percentage of cells in cluster B. (B) Representation showing the dynamics of the percentages of cells by cluster along infarction. Line color-coded by clusters (A-K). (C) Network representation of enriched pathways based on cluster B markers. Dot sizes represent number of cluster B markers annotated for each pathway and color scale statistical significance for each function. (D) t-SNE representation of normalized expression of Cthrc1, Ddah1, Lox, Comp, Fmod and Ptn comprising the four time-points. Dashed lines delimit cluster B. (E) Scaled gene expression heatmap showing transcriptional dynamics of cluster B along time-points. (F) Representative immunohistochemistries of Col1α1-GFP infarcted hearts at 14dpi showing the spatial location of CTHRC1, DDAH1, or FMOD (red) in the infarct zone. GFP+ (green), Nuclei (DAPI, blue). Co-localizations in yellow (arrows). Scale bars: 100 μm. (G) Experimental design: CF (GFP+/CD31/CD45) from remote, border and infarct zones were sorted for bulk RNA-seq (above). Boxplot showing the Z-score distribution of cluster markers in the three zones at 7dpi, Wilcoxon signed-rank test, n=2 (middle). Bar plot showing normalized expression values for top cluster B markers (below), linear model differential expression, n=2. Data, mean ± SD. Scale bars: 100 μm. * p≤0.05, ** p≤0.01, *** p≤0.001.
Figure 3:
Figure 3:. CD200+/CD146 CF provides the most specific characterization of RCF.
(A) TF target gene enrichments. Dot size represents enrichment p-value of TF and color represents log2 transformed expression in CD200+ bulk RNA-seq. (B) SOX9 DNA binding motif sequence logo and its location in some of the top markers for cluster B. Small red rectangles below the gene sequence show confirmed SOX9 binding sites, as determined by JASPAR. (C and D) Volcano plots showing differential gene expression of in vitro grown CF overexpressing Sox9 (left) or treated with TGF-β (right). Genes with Log Fold Change of ±1.5 and p-value <0.05 were considered differentially expressed. Red dots represent RCF markers. (E) Violin plots showing single-cell normalized expression of selected surface markers in the pooled CF population (healthy, 7, 14 and 30 dpi). (F) Transverse sections of Col1α1-GFP hearts at 7dpi. Scale bars: 1 mm. Immunofluorescence analysis of GFP+ (green), CD200+ (red), COL1α1 (grey) and DAPI/nuclei (blue) in healthy LV, and IZ (left) and RZ (right) at 7dpi. Co-localization of GFP+ and CD200+ in yellow (arrows) in IZ (and co-localize with COL1α1 in light yellow). Arrowheads indicate GFP+/CD200 cells and asterisks indicate GFP/CD200+. Scale bars: 100 μm. Quantification of GFP+/CD200+ cells in healthy and at 7dpi (right, top). (G) Gating strategy for isolation of GFP+/CD31/CD45/CD200+/CD146 (CD200+) and GFP+/CD31/CD45/CD200/CD146 (CD200) CIC at 7dpi. (H) Boxplot representation of Z-score distributions for cluster markers in CD200+ and CD200 CF (above), Wilcoxon signed-rank test, n=2. Normalized expression bar plots (mean ± SD) for top RCF markers in both subpopulations (below), linear model differential expression, n=2. Data, mean ± SD. * p≤0.05, ** p≤0.01, *** p≤0.001. IZ = infarct zone; RZ = remote zone. Other of abbreviations as in Figure 1.
Figure 4:
Figure 4:. Molecular regulation of RCF identity.
(A) Genome browser snapshots showing accessibility profiles of representative loci in global CF population at different time-points and in CD200+ and CD200 CF subpopulations at 7dpi. Shadowed areas mark distal regulatory elements displaying increased accessibility in CD200+ subpopulation. (B) Dot plot representing motif enrichment and expression specificity of potential TF mediating RCF response (cluster B/CD200+ CF). First row, analysis of CD200+ specific accessible distal regulatory elements (+/− 1.5 Kb from TSS). Second row, analysis of distal regulatory elements found within RCF specific loci. Third row, expression values of TF in scRNA-seq. Fourth row, expression values for TF in CD200+ bulk RNA-seq. (C) Volcano plot showing differential gene expression of in vitro grown CF overexpressing Runx1. Genes with Log Fold Change of ±1.5 and p-value <0.05 were considered differentially expressed. Red dots represent RCF markers. (D) TGF-β network centrality analysis revealed non-canonical PI3K-Akt pathway related with RCF markers. (E) Heatmap showing relative expression of RCF markers in non-treated (Control), TGF-β, TGF-β + Vehicle (DMSO) and TGF-β + LY294002 cultured CF. Linear model differential expression, n=4 per group. (F) Quantification of area covered by cultured CF after 23 hours of treatment in wound healing experiment. One-way analysis of variance, Kruskal-Wallis post-hoc test, n=4–8. ** p≤0.01, *** p≤0.001.
Figure 5:
Figure 5:. CTHRC1 is an essential effector of RCF for the healing repair process.
(A) Normalized expression bar plots (mean ± SD) of Cthrc1 in CF (GFP+/CD31/CD45), endothelial (CD31+), and bone marrow-derived cells (CD45+) at different time-points. (B) Localization of CTHRC1 (green) in the left ventricle of healthy wild type (WT) mice, and at 3, 5 and 7 dpi. Cardiac Troponin-I+ (cTN) cardiomyocytes (red), Nuclei (DAPI, blue). (C) Normalized expression bar plots (mean ± SD) of Cthrc1 in endothelial (CD31+), bone marrow-derived cells (CD45+), CF (mEFSK4+/CD31/CD45) and cardiomyocytes from WT hearts at 5dpi, linear model with normalized counts. (D) Kaplan-Meier survival curves after MI in WT and Cthrc1 knockout (KO) mice. Log-rank Mantel-Cox test, n=10 per group. (E) Representative images of collagen deposition in left ventricle of WT (left) and KO (right) mice. Quantification of collagen deposition in the LV in both genotypes at 3dpi (WT, open circle; KO, closed circle), unpaired t-test (right). (F) Volcano plots showing differential gene expression between WT and KO CF at 5dpi. (G) Dot plot comparison of enriched pathways in the bulk RNA-seq analysis between Cthrc1-KO (left column) and WT (right column) at 7dpi. (H) t-SNE representation of 4,189 CF from one KO heart at 7dpi. Red dots represent RCF-like fibroblasts, and the number the percentage of them in relation to the total isolated CF. t-SNE representation for RCF markers (below). (I) Proportion of cluster B CF in each of the datasets. ** p≤0.01, *** p≤0.001. KO = knockout; WT = wild type.
Figure 6:
Figure 6:. RCF markers expression correlates with cardiac function in infarcted pigs and is conserved in humans.
(A) Twenty-nine pigs were submitted to Ischemia/Reperfusion surgery and 2 animals were used as controls. Cardiac function was determined in 21 pigs after 6 months using echocardiography and MRI. (B) Normalized expression bar plots (mean ± SD) for a zonal transcriptomic profiling at 8dpi (above) (n=2), 60dpi (middle) (n=6) and 180dpi (below) (n=9). Normalized expression bar plots (mean ± SD) for top RCF markers for healthy (blue) and at 8, 60 and 180 dpi in RZ (green) and IZ (red). (C) Immunohistochemistry of COL1α1, POSTN and CTHRC1 in IZ and RZ at 8dpi. (D) Distribution of pigs with reduced (≤45%, circles) (n=9) or preserved (>45%, squares) (n=12) ejection fraction (EF) at 180dpi by echocardiography or MRI. Two-tailed t-test with a Mann-Whitney post-hoc test. (E) Comparison of POSTN, COL1a1 and CTHRC1 expression levels in different anatomical regions between infarcted pigs with reduced or preserved EF. Two-ways ANOVA, n=8–10 (above). Correlation between EF and expression level of POSTN, COL1a1 and CTHRC1 in IZ. Spearman correlation coefficient (below). (F) Distribution of pigs with reduced (≤45%, circles) or preserved (>45%, squares) infarct area at 180dpi by MRI. Two-tailed t-test with a Mann-Whitney post-hoc test, n=21. (G) Correlations between infarct area and expression level of POSTN, COL1a1 and CTHRC1 in IZ. Spearman correlation coefficient. (H) Normalized expression bar plots for top RCF markers (CTHRC1, DDAH1, POSTN, FMOD, LOX, PTN and COMP) in human samples from healthy (LV and RV) (n=6), infarcted (IZ and RZ) (n=8), and dilated cardiomyopathy (DCM) (LV and RV) (n=5). Likelihood ratio test patients. PCA scatter plot of human samples subjected to transcriptomic profiling. (I) Representative images of the immunohistochemistry analysis of CTHRC1+ CF (in brown, arrows) performed on sections of the infarct and the remote zones obtained from the LV of two different patients that suffered MI. BZ = border zone; IZ = infarct zone; LV = left ventricle; RV = right ventricle; RZ = remote zone. * p≤0.05, ** p≤0.01, *** p≤0.001, **** p≤0.0001. Scale bars: 100 μm.

References

    1. Pinto AR, Ilinykh A, Ivey MJ, Kuwabara JT, D’Antoni ML, Debuque R, Chandran A, Wang L, Arora K, Rosenthal NA, et al. Revisiting Cardiac Cellular Composition. Circ Res. 2016;118:400–9. doi: 10.1161/CIRCRESAHA.115.307778 - DOI - PMC - PubMed
    1. Frangogiannis NG. Pathophysiology of Myocardial Infarction. Compr Physiol. 2015;5:1841–75. doi: 10.1002/cphy.c150006 - DOI - PubMed
    1. Shinde AV, Frangogiannis NG. Mechanisms of Fibroblast Activation in the Remodeling Myocardium. Curr Pathobiol Rep. 2017;5:145–152. doi: 10.1007/s40139-017-0132-z - DOI - PMC - PubMed
    1. Tallquist MD, Molkentin JD. Redefining the identity of cardiac fibroblasts. Nat Rev Cardiol. 2017;14:484–491. doi: 10.1038/nrcardio.2017.57 - DOI - PMC - PubMed
    1. Ruiz-Villalba A, Simon AM, Pogontke C, Castillo MI, Abizanda G, Pelacho B, Sanchez-Dominguez R, Segovia JC, Prosper F, Perez-Pomares JM. Interacting resident epicardium-derived fibroblasts and recruited bone marrow cells form myocardial infarction scar. J Am Coll Cardiol. 2015;65:2057–66. doi: 10.1016/j.jacc.2015.03.520 - DOI - PubMed

Publication types

Substances