. 2021 Oct;17(10):3175-3195.
doi: 10.1080/15548627.2020.1826689. Epub 2020 Oct 22.

TSPAN1 promotes autophagy flux and mediates cooperation between WNT-CTNNB1 signaling and autophagy via the MIR454-FAM83A-TSPAN1 axis in pancreatic cancer

Affiliations

TSPAN1 promotes autophagy flux and mediates cooperation between WNT-CTNNB1 signaling and autophagy via the MIR454-FAM83A-TSPAN1 axis in pancreatic cancer

Cefan Zhou et al. Autophagy. 2021 Oct.

Abstract

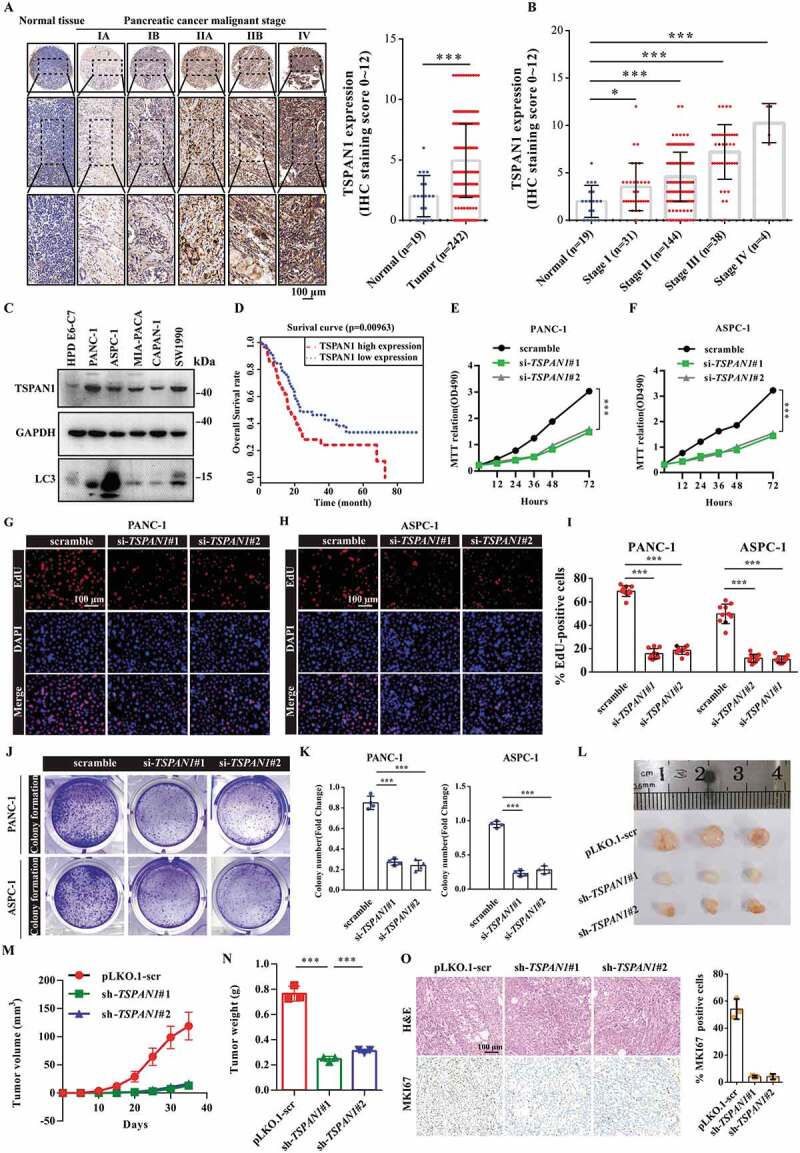
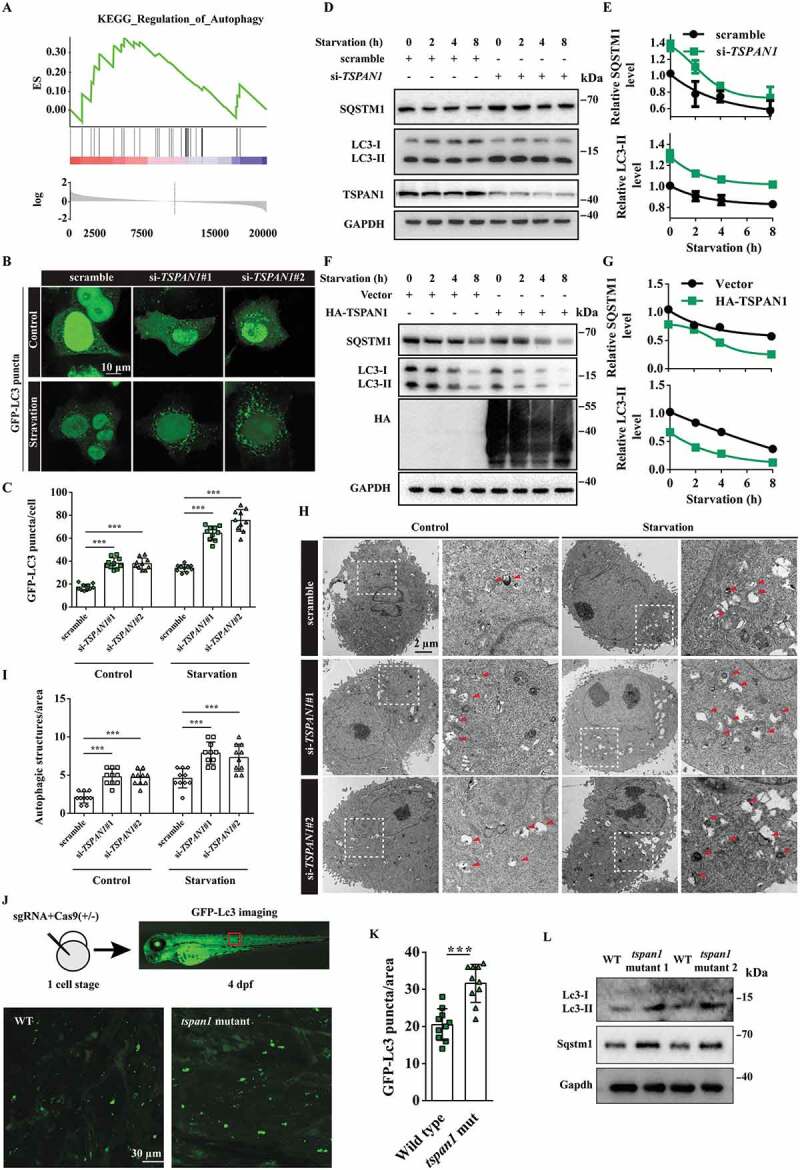
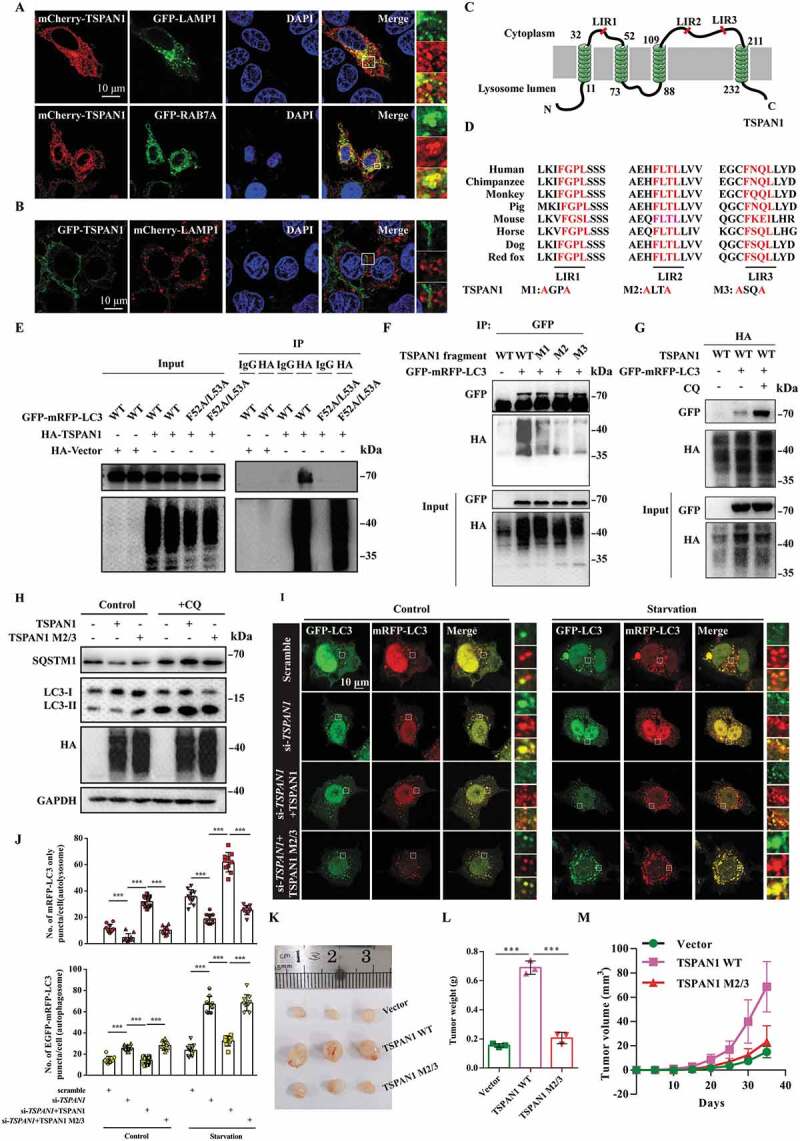
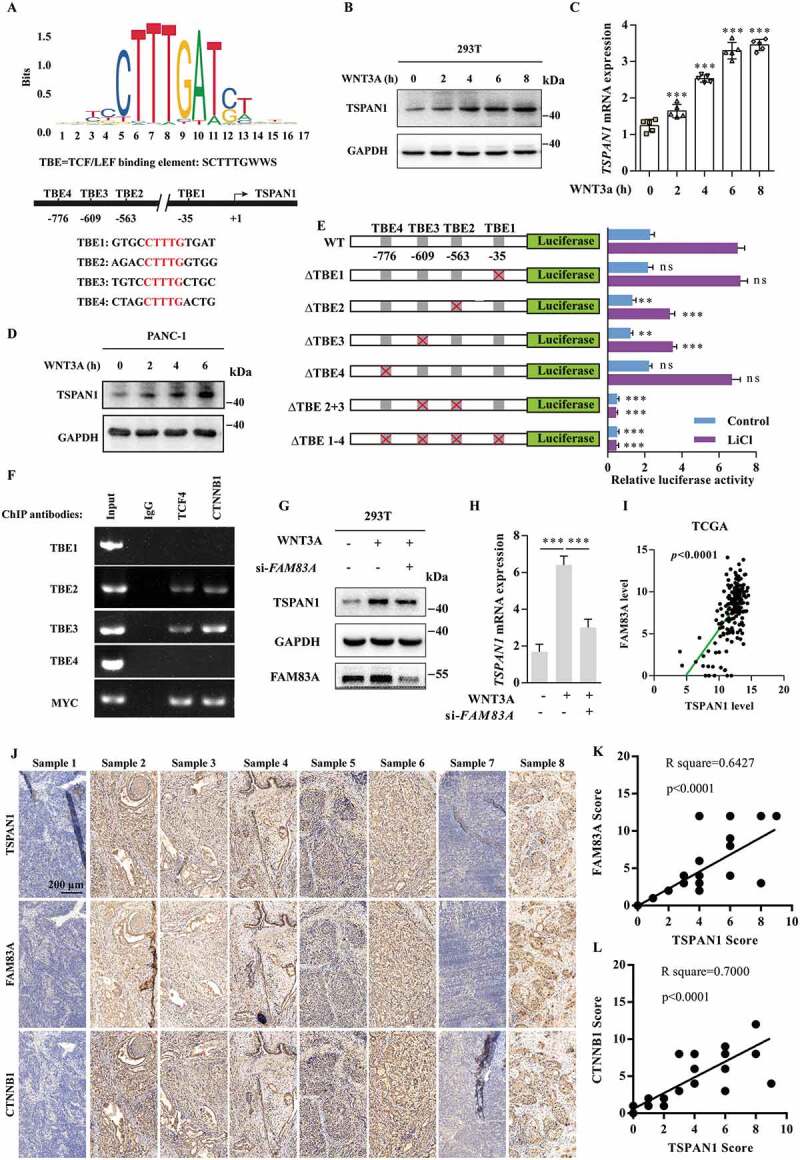
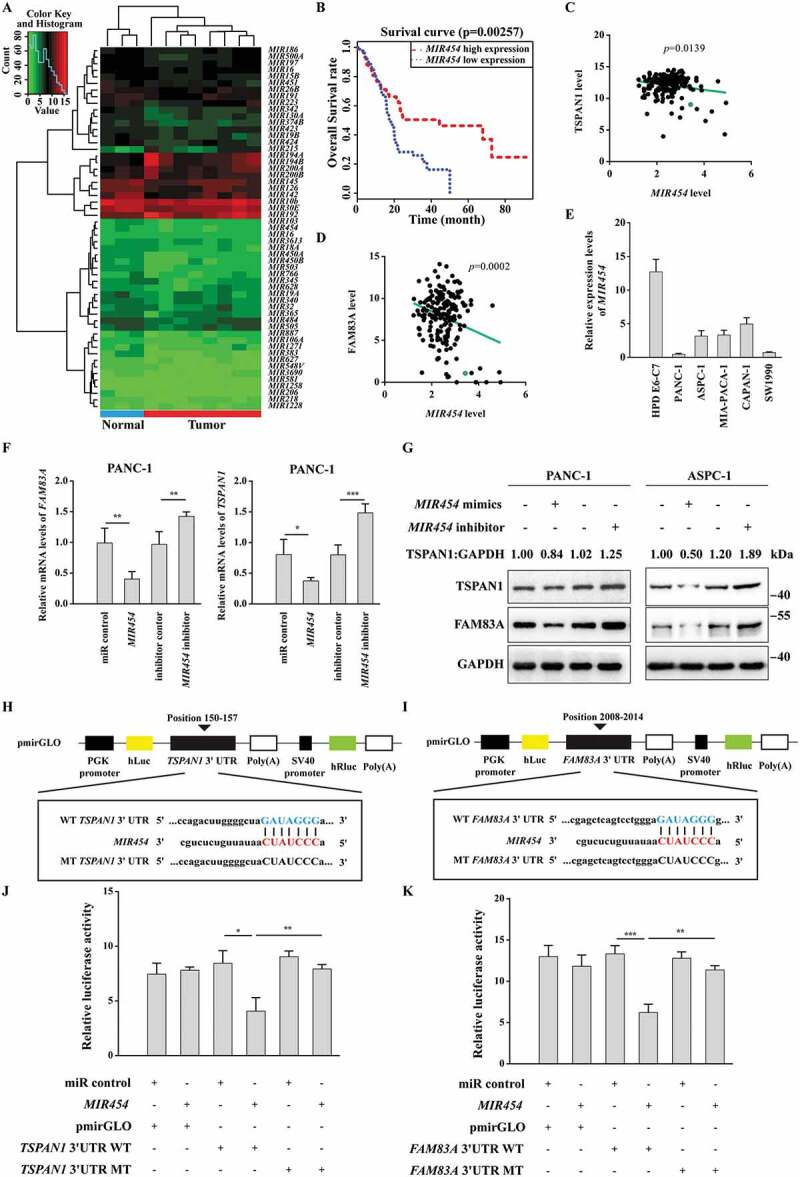
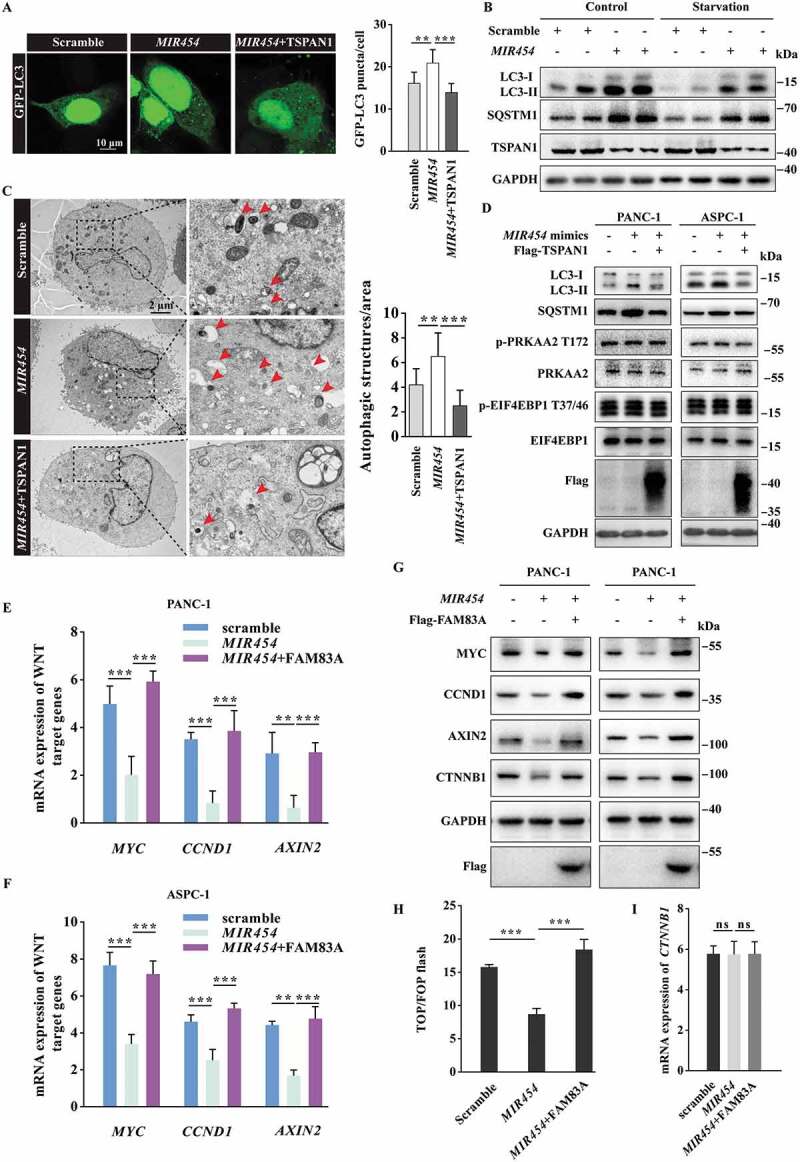
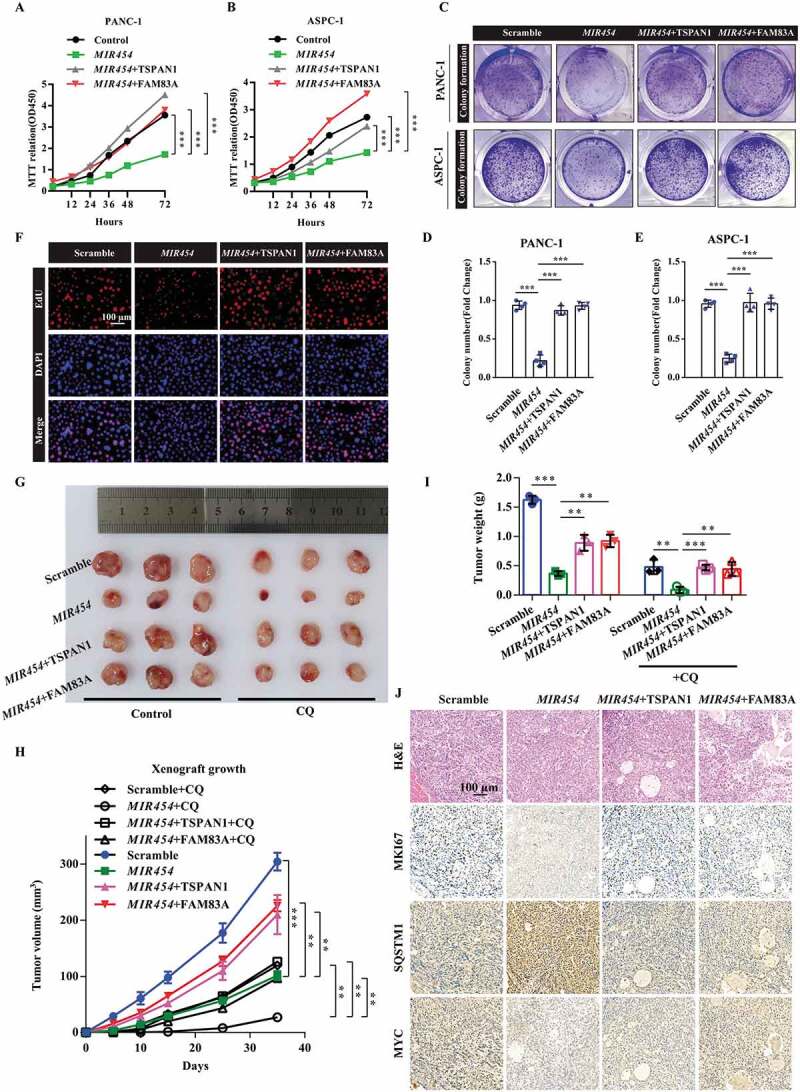
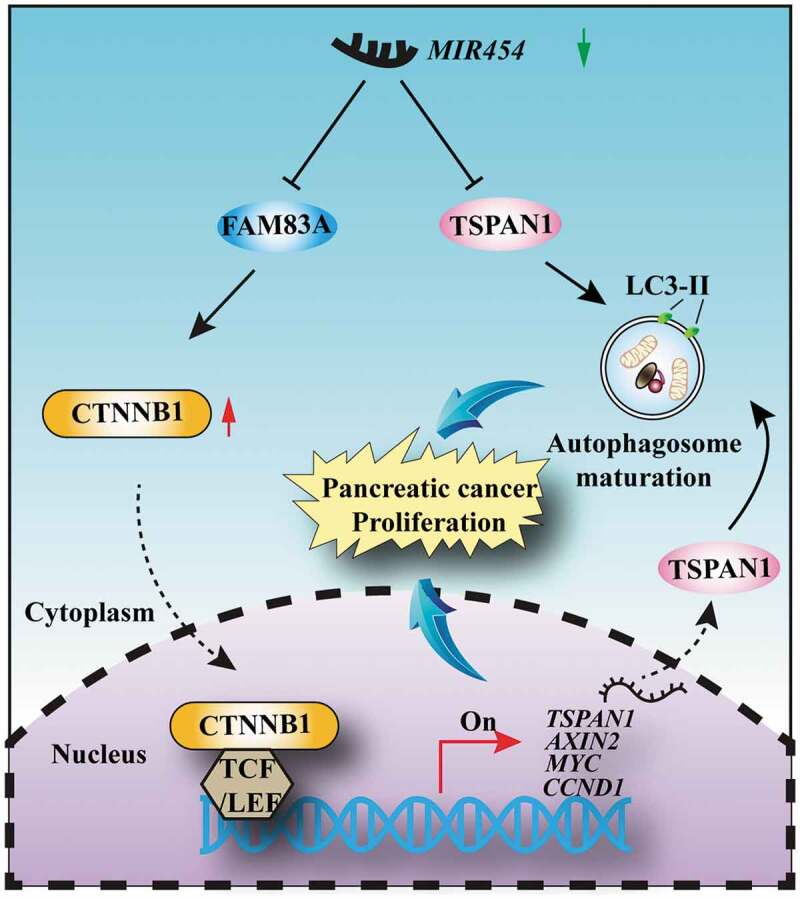
Pancreatic cancer is one of the most aggressive tumors associated with a poor clinical prognosis, weakly effective therapeutic options. Therefore, there is a strong impetus to discover new therapeutic targets in pancreatic cancer. In the present study, we first demonstrated that TSPAN1 is upregulated in pancreatic cancer and that TSPAN1 depletion decreases pancreatic cancer cell proliferation in vitro and in vivo. TSPAN1 expression was correlated with poor overall survival of pancreatic cancer patients. Moreover, we demonstrated that TSPAN1 is a novel positive regulator of macroautophagy/autophagy characterized by decreased LC3-II and SQSTM1/p62 expressions, inhibited puncta formation of GFP-LC3 and autophagic vacuoles. We also demonstrated that tspan1 mutation impaired autophagy in the zebrafish model. Furthermore, we showed that TSPAN1 promoted autophagy maturation via direct binding to LC3 by two conserved LIR motifs. Mutations in the LIR motifs of TSPAN1 resulted in a loss of the ability to induce autophagy and promote pancreatic cancer proliferation. Second, we discovered two conservative TCF/LEF binding elements present in the promoter region of the TSPAN1 gene, which was further verified through luciferase activity and ChIP assays. Furthermore, TSPAN1 was upregulated by FAM83A through the canonical WNT-CTNNB1 signaling pathway. We further demonstrated that both TSPAN1 and FAM83A are both direct targets of MIR454 (microRNA 454). Additionally, we revealed the role of MIR454-FAM83A-TSPAN1 in the proliferation of pancreatic cancer cells in vitro and in vivo. Our findings suggest that components of the MIR454-FAM83A-TSPAN1 axis may be valuable prognosis markers or therapeutic targets for pancreatic cancer.Abbreviations: AMPK: adenosine 5'-monophosphate (AMP)-activated protein kinase; APC: APC regulator of WNT signaling pathway; ATG: autophagy related; AXIN2: axin 2; BECN1: beclin 1; CCND1: cyclin D1; CSNK1A1/CK1α: casein kinase 1 alpha 1; CTNNB1/β-catenin: catenin beta 1; DAPI: 4'6-diamino-2-phenylindole; EBSS: Earle's balanced salt solution; EdU: 5-ethynyl-20-deoxyuridine; FAM83A: family with sequence similarity 83 member A; GAPDH: glyceraldehyde-3-phosphate dehydrogenase; GFP: green fluorescent protein; GSEA: gene set enrichment analysis; GSK3B: glycogen synthase kinase 3 beta; IHC: immunohistochemical; LAMP1: lysosomal associated membrane protein 1; LIR: LC3-interacting region; MAP1LC3/LC3, microtubule associated protein 1 light chain 3; MIR454: microRNA 454; miRNA: microRNA; MKI67: antigen identified by monoclonal antibody Ki 67; MTOR: mechanistic target of rapamycin kinase; MTT: 3-(4,5-dimethylthiazol-2-yl)-2, 5-diphenyltetrazolium bromide; MYC: MYC proto-oncogene, bHLH transcription factor; OS: overall survival; PDAC: pancreatic ductal adenocarcinoma; RAB7A: RAB7A, member RAS oncogene family; shRNA: short hairpin RNA; SQSTM1: sequestosome 1; TBE: TCF/LEF binding element; TCGA: The Cancer Genome Atlas; TCF/LEF: transcription factor/lymphoid enhancer binding factor; TCF4: transcription factor 4; TSPAN1: tetraspanin 1; TUNEL: terminal deoxynucleotidyl transferase mediated dUTP nick end labeling; UTR: untranslated region; WT: wild type.

Keywords: Autophagy; FAM83A; MIR454; WNT-CTNNB1; pancreatic cancer; tetraspanin 1.


Conflict of interest statement

No potential conflict of interest was reported by the authors.

Figures

Figure 1.
Figure 1.
TSPAN1 is upregulated and TSPAN1 depletion decreases cell proliferation in human pancreatic cancer. (A) Representative immunohistochemical images of TSPAN1 expression in human pancreatic cancer tissues and normal pancreatic tissues and the quantification of TSPAN1 intensity. (B) Quantification of TSPAN1 expression in different stages of pancreatic cancer and normal pancreatic tissue samples. (C) Relative protein levels of TSPAN1 and LC3 in human normal pancreatic duct epithelial HPD E6-C7 cells and human pancreatic cancer PANC-1, ASPC-1, MIA-PACA-2, CAPAN-1 and SW1990 cells. (D) Kaplan-Meier overall survival curves for TSPAN1 in pancreatic cancer patients. (E and F) MTT assays were performed to examine the effect of TSPAN1 small interfering RNAs (#1, targeting CDS and #2, targeting 3ʹUTR) on cell viability. (G-I) DNA synthesis ability of the cells transfected with or without TSPAN1 siRNAs were assessed by EdU assays. (J and K) Colony formation assays were performed to assess the proliferation of cells transfected with or without TSPAN1 siRNAs. (L) Excised tumors in different groups were shown. (M) Growth curves showing the changes in the tumor volume in mice in different groups every 5 d from the injection. (N) Weight of the excised tumors in each group. (O) Representative H&E staining images and immunohistochemical images of MKI67 in excised tumors tissues. Data were represented as mean ± SD, *P < 0.05; **P < 0.01; ***P < 0.001
Figure 2.
Figure 2.
TSPAN1 depletion impairs autophagy flux in vitro and in vivo. (A) Gene set enrichment analysis (GSEA) using the TCGA database revealed many genes that correlated with autophagy were enriched in pancreatic cancer patients with high TSPAN1 expression. (B and C) Representative confocal images of GFP-LC3 distribution in ASPC-1 cells transfected with TSPAN1 siRNAs. The number of LC3 puncta was quantified (n =10). Scale bars, 10 µm. (D) Western blotting analysis of LC3 and SQSTM1 in ASPC-1 cells transfected with TSPAN1 siRNA, with or without EBSS starvation. (E) The relative levels of SQSTM1 and LC3-II were normalized to GAPDH and quantified. (F) Western blotting analysis of LC3 and SQSTM1 in HEK293T cells transfected with TSPAN1 overexpression vector, with or without EBSS starvation. (G) The relative levels of SQSTM1 and LC3-II were normalized to GAPDH and quantified. (H and I) Representative images of autophagosomes or autolysosomes of the PANC-1 cells transfected with TSPAN1 siRNAs in nutrient-rich or EBSS starvation conditions. Both low- and high-power (zoom) images are displayed. Red arrows indicate autophagic structures. The puncta number of autophagic structures per area were quantified (n =10). (J and K) Representative confocal images of GFP-Lc3 puncta present in the indicated region from 4 dpf WT and tspan1 mutant larvae. The puncta number of Lc3 was quantified (n =10). (L) Level of Lc3 and SQSTM1 were detected in WT and tspan1 mutant embryos at 4 dpf. Protein samples were extracted from 4 dpf WT and tspan1 mutant larvae (>10 embryos/sample). Data were represented as mean ± SD, *P < 0.05; **P < 0.01; ***P < 0.001
Figure 3.
Figure 3.
TSPAN1 interacts with LC3 through conserved LIRs and promotes autophagosome maturation. (A) Co-localization between GFP-LAMP1, GFP-RAB7A and mCherry-TSPAN1 in HeLa cells. (B) Co-localization between GFP-TSPAN1 and mCherry-LAMP1 in HeLa cells. (C) Schematic illustration of TSPAN1 protein and the LIR motifs of TSPAN1 protein localized in the lysosome membrane. (D) Sequences alignment of the predicted LIR motifs and its mutations in the TSPAN1 protein. “M” represents mutation. (E) The interaction between TSPAN1 and wild-type or F52A/L53A mutant LC3. (F) The interaction between LC3 and TSPAN1 was abolished by replacing the phenylalanine and leucine with alanine residues in LIR2 or LIR3. (G) The interaction between LC3 and TSPAN1 was enhanced by CQ (10 μM) treatment. (H) Western blotting analysis of LC3 and SQSTM1 in HEK293T cells transfected with TSPAN1 and its mutants with or without CQ (10 μM) treatment. (I and J) Representative confocal microscopy images of the red-only puncta and the yellow puncta in ASPC-1 cells after co-transfection with TSPAN1 siRNA#2 (targeting the 3ʹUTR of TSPAN1 mRNA) with or without the wild-type TSPAN1 or TSPAN1 M2/3 mutant under nutrient-rich and EBSS starvation conditions. The numbers of the red-only puncta and yellow puncta were quantified (n=10). Scale bars, 10 µm. (K) Excised tumors in different groups were shown. (L) Weights of the excised tumors in each group. (M) Growth curve showing the changes in the tumor volume in mice in different groups every 5 d from the injection. Data were represented as mean ± SD, *P < 0.05; **P < 0.01; ***P < 0.001
Figure 4.
Figure 4.
TSPAN1 is upregulated by the canonical WNT-CTNNB1 signaling pathway and correlated with FAM83A in human pancreatic cancer. (A) Schematic diagram of the TCF/LEF binding element (TBE1-4) in the promoter region of TSPAN1. (B and C) The protein and mRNA levels of TSPAN1 after treatment with WNT3A (100 ng/ml) for 0, 2, 4, 6, 8 h in 293T cells indicated by western blotting and q-RT PCR assays. (D) The protein level of TSPAN1 after treatment with WNT3A for indicated time in PANC-1 cells were analyzed by western blotting assay. (E) Schematic diagram of the generated luciferase report plasmids and the relative luciferase activity after transfection with the plasmids in 293T cells with or without LiCl (50 mM) treatment. (F) A ChIP experiment was used to detect binding between the CTNNB1-TCF4 complex and the predicted TCF/LEF binding element in the TSPAN1 promoter. The promoter of MYC was used as a positive control. (G and H) The protein and mRNA levels of TSPAN1 after FAM83A siRNA transfection in ASPC-1 cells with or without WNT3A treatment. (I) The correlation between mRNA expression of TSPAN1 and FAM83A in the TCGA database. (J) Representative IHC images of TSPAN1 and FAM83A in 44 human pancreatic cancer patient tissues. (K and L) The correlation between the level of FAM83A, CTNNB1 and TSPAN1 in 44 human pancreatic cancer patient tissues
Figure 5.
Figure 5.
MIR454 directly targets TSPAN1 and FAM83A. (A) Clustered heatmap of differentially expressed miRNAs. Each column indicates a tissue sample and each row indicates an individual gene. Red and green strips represent high and low miRNA expression, respectively. (B) Kaplan-Meier overall survival curves for MIR454 in pancreatic cancer patients. (C and D) MIR454 levels were inversely correlated with the levels of TSPAN1 (C) and FAM83A (D). (E) The relative mRNA level of MIR454 was detected in human normal pancreatic duct epithelial HPD E6-C7 cells and human pancreatic cancer PANC-1, ASPC-1, MIA-PACA-2, CAPAN-1 and SW1990 cells. (F) Relative mRNA levels of TSPAN1 and FAM83A after transfected with miR control, MIR454 mimics, inhibitor control and MIR454 inhibitor in PANC-1 cells. (G) Relative protein levels of TSPAN1 and FAM83A after transfected with miR control, MIR454 mimics, inhibitor control and MIR454 inhibitor in PANC-1 and ASPC-1 cells. (H) Schematic illustration of predicted miRNA binding sites within the 3′-UTR of TSPAN1 mRNA (position 150 to 157) and generation of the WT-TSPAN1 3′UTR and MT-TSPAN1 3′UTR luciferase reporter vectors. (I) Schematic illustration of predicted miRNA binding sites within the 3′-UTR of FAM83A mRNA (position 2008 to 2014), and generation of the WT-FAM83A 3ʹUTR and MT-FAM83A 3ʹUTR luciferase reporter vectors. (J) Luciferase activity was measured in lysates of HEK293T cells transfected with the wild-type 3′-UTR and mutant 3′-UTR of TSPAN1 luciferase constructs and a MIR454 mimic or a scrambled miRNA control. The luciferase activity was normalized to renilla luciferase activity. (K) Luciferase activity was measured in lysates of HEK293T cells transfected with the wild-type 3′-UTR and mutant 3′-UTR of FAM83A luciferase constructs and a MIR454 mimic or a scrambled miRNA control. The luciferase activity was normalized to renilla luciferase activity. Data were represented as mean ± SD, *P < 0.05; **P < 0.01; ***P < 0.001
Figure 6.
Figure 6.
Role of MIR454 in regulating autophagy flux and the WNT-CTNNB1 signaling pathway. (A) Representative confocal images of GFP-LC3 distribution in ASPC-1 cells transfected with MIR454 mimics and the TSPAN1 expression vector. The puncta number of LC3 was quantified (n =10). Scale bars, 10 µm. (B) Western blotting analysis of LC3 and SQSTM1 in ASPC-1 cells transfected with MIR454 mimics with or without EBSS starvation. (C) Representative transmission electron microscope images of autophagosomes or autolysosomes of the PANC-1 cells transfected with MIR454 mimics and TSPAN1 expression vector. Both low- and high-power (zoom) images are displayed. Red arrows indicate autophagic structures. The puncta number of autophagic structures per area were quantified (n =10). (D) Western blotting analysis of PANC-1 and ASPC-1 cells transfected with MIR454 mimics and TSPAN1 expression vector using the indicated antibodies. (E and F) Relative mRNA levels of the WNT-CTNNB1 target genes CCND1, MYC and AXIN2 after transfection with miR control, MIR454 mimic and MIR454 inhibitor in PANC-1 (E) and ASPC-1 (F) cells. (G) Relative protein levels of CCND1, MYC, AXIN2 and CTNNB1 in PANC-1 and ASPC-1 cells transfected with miR control, MIR454 mimic and MIR454 inhibitor. (H) Effects of MIR454 and FAM83A overexpression on TOP/FOP flash luciferase activity in human pancreatic cancer ASPC-1 cells. (I) MIR454 and FAM83A overexpression had no effect on CTNNB1 mRNA expression in human pancreatic cancer ASPC-1 cells. The quantification data were showed as mean ± SD, **P< 0.01, ***P< 0.001
Figure 7.
Figure 7.
Role of the MIR454-FAM83A-TSPAN1 axis in pancreatic cancer cell proliferation in vitro and in vivo. (A and B) MTT assays were performed to examine the effect of MIR454, TSPAN1 and FAM83A overexpression on cell viability. (C-E) Colony formation assays were performed to assess the proliferation of cells transfected with MIR454, TSPAN1 and FAM83A overexpression vectors. (F) DNA synthesis in the cells transfected with MIR454, TSPAN1, FAM83A overexpression vectors were assessed by EdU assays. (G) Representative images of excised tumors in different groups of nude mice were shown. (H) Growth curve showing the changes in the tumor volume in mice in different groups from the injection. (I) Weight of the excised tumors in each group. (J) Representative H&E staining images and immunohistochemical images of MKI67, SQSTM1 and MYC expression in excised tumors tissues. The quantification data were showed as mean ± SD, **P< 0.01, ***P< 0.001
Figure 8.
Figure 8.
Schematic diagram of the biological role of the MIR454-TSPAN1-FAM83A axis in pancreatic cancer proliferation

References

    1. Siegel RL, Miller KD, Jemal A.. Cancer statistics, 2016. CA Cancer J Clin. 2016;66(1):7–30. - PubMed
    1. Zeitouni D, Pylayeva-Gupta Y, Der CJ, et al. KRAS Mutant Pancreatic Cancer: No Lone Path to an Effective Treatment. Cancers (Basel). 2016;8(4):45. DOI:10.3390/cancers8040045. - DOI - PMC - PubMed
    1. Bardeesy N, DePinho RA. Pancreatic cancer biology and genetics. Nat Rev Cancer. 2002;2(12):897–909. - PubMed
    1. Galluzzi L, Pietrocola F, Levine B, et al. Metabolic control of autophagy. Cell. 2014;159(6):1263–1276. - PMC - PubMed
    1. Hosokawa N, Hara T, Kaizuka T, et al. Nutrient-dependent mTORC1 association with the ULK1-Atg13-FIP200 complex required for autophagy. Mol Biol Cell. 2009;20(7):1981–1991. DOI:10.1091/mbc.e08-12-1248. - DOI - PMC - PubMed

Publication types