

Modeling between-population variation in COVID-19 dynamics in Hubei, Lombardy, and New York City
- PMID: 32973089
- PMCID: PMC7568285
- DOI: 10.1073/pnas.2010651117
Modeling between-population variation in COVID-19 dynamics in Hubei, Lombardy, and New York City
Abstract
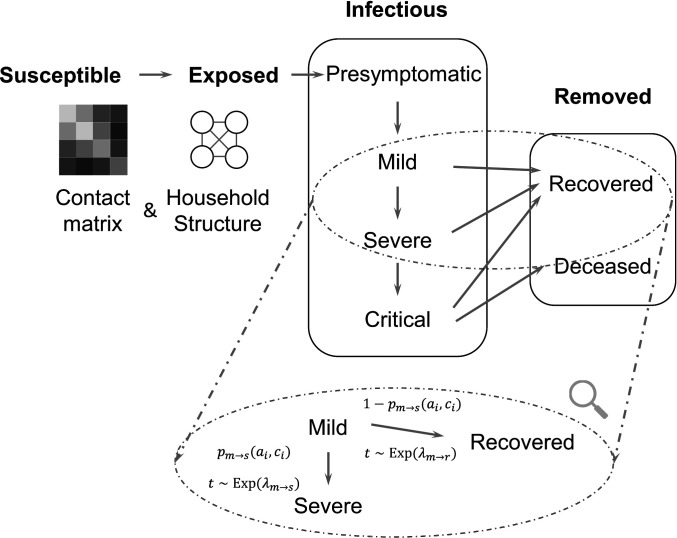
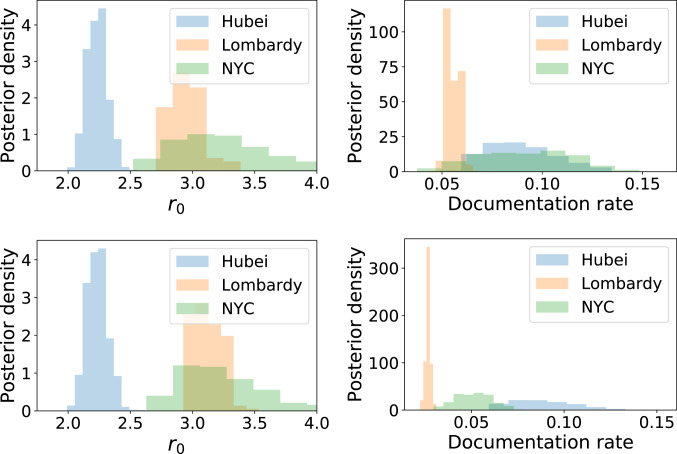
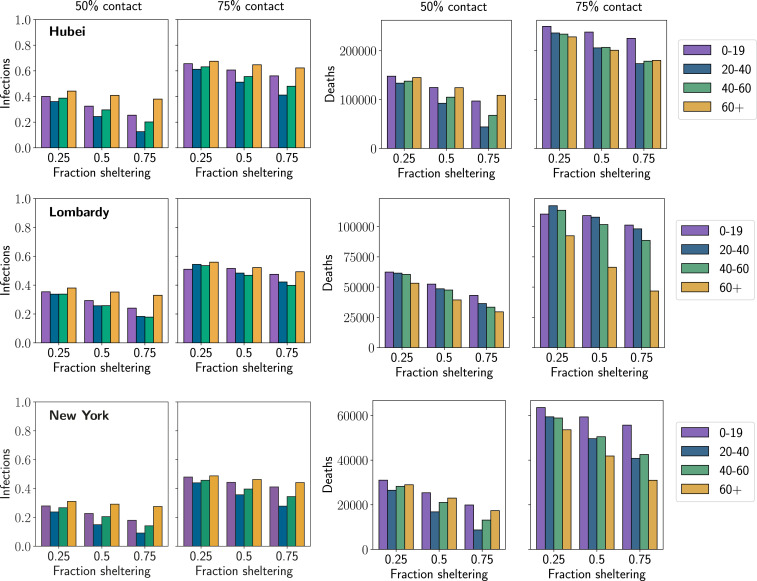
As the COVID-19 pandemic continues, formulating targeted policy interventions that are informed by differential severe acute respiratory syndrome coronavirus 2 (SARS-CoV-2) transmission dynamics will be of vital importance to national and regional governments. We develop an individual-level model for SARS-CoV-2 transmission that accounts for location-dependent distributions of age, household structure, and comorbidities. We use these distributions together with age-stratified contact matrices to instantiate specific models for Hubei, China; Lombardy, Italy; and New York City, United States. Using data on reported deaths to obtain a posterior distribution over unknown parameters, we infer differences in the progression of the epidemic in the three locations. We also examine the role of transmission due to particular age groups on total infections and deaths. The effect of limiting contacts by a particular age group varies by location, indicating that strategies to reduce transmission should be tailored based on population-specific demography and social structure. These findings highlight the role of between-population variation in formulating policy interventions. Across the three populations, though, we find that targeted "salutary sheltering" by 50% of a single age group may substantially curtail transmission when combined with the adoption of physical distancing measures by the rest of the population.
Keywords: COVID-19; SARS-CoV-2; modeling; nonpharmaceutical intervention.
Copyright © 2020 the Author(s). Published by PNAS.
Conflict of interest statement
The authors declare no competing interest.
Figures

Similar articles
-
Transmission patterns of COVID-19 in the mainland of China and the efficacy of different control strategies: a data- and model-driven study.Infect Dis Poverty. 2020 Jul 6;9(1):83. doi: 10.1186/s40249-020-00709-z. Infect Dis Poverty. 2020. PMID: 32631426 Free PMC article.
-
Changes in contact patterns shape the dynamics of the COVID-19 outbreak in China.Science. 2020 Jun 26;368(6498):1481-1486. doi: 10.1126/science.abb8001. Epub 2020 Apr 29. Science. 2020. PMID: 32350060 Free PMC article.
-
Revealing regional disparities in the transmission potential of SARS-CoV-2 from interventions in Southeast Asia.Proc Biol Sci. 2020 Aug 26;287(1933):20201173. doi: 10.1098/rspb.2020.1173. Epub 2020 Aug 26. Proc Biol Sci. 2020. PMID: 32842911 Free PMC article.
-
[The outbreak of COVID-19 in China].Internist (Berl). 2020 Aug;61(8):776-781. doi: 10.1007/s00108-020-00833-w. Internist (Berl). 2020. PMID: 32548651 Free PMC article. Review. German.
-
SARS-CoV-2 infection in China-Before the pandemic.PLoS Negl Trop Dis. 2020 Aug 6;14(8):e0008472. doi: 10.1371/journal.pntd.0008472. eCollection 2020 Aug. PLoS Negl Trop Dis. 2020. PMID: 32760070 Free PMC article. Review.
Cited by
-
Risk-aware temporal cascade reconstruction to detect asymptomatic cases.Knowl Inf Syst. 2022;64(12):3373-3399. doi: 10.1007/s10115-022-01748-8. Epub 2022 Sep 15. Knowl Inf Syst. 2022. PMID: 36124337 Free PMC article.
-
Socioeconomic factors analysis for COVID-19 US reopening sentiment with Twitter and census data.Heliyon. 2021 Feb;7(2):e06200. doi: 10.1016/j.heliyon.2021.e06200. Epub 2021 Feb 6. Heliyon. 2021. PMID: 33585707 Free PMC article.
-
An Epidemic Model with Infection Age and Vaccination Age Structure.Infect Dis Rep. 2024 Jan 10;16(1):35-64. doi: 10.3390/idr16010004. Infect Dis Rep. 2024. PMID: 38247976 Free PMC article.
-
The trade-off between COVID-19 and mental diseases burden during a lockdown: Mathematical modeling of control measures.Infect Dis Model. 2023 Jun;8(2):403-414. doi: 10.1016/j.idm.2023.04.003. Epub 2023 Apr 10. Infect Dis Model. 2023. PMID: 37064013 Free PMC article.
-
The effect of eviction moratoria on the transmission of SARS-CoV-2.medRxiv [Preprint]. 2021 Jan 19:2020.10.27.20220897. doi: 10.1101/2020.10.27.20220897. medRxiv. 2021. Update in: Nat Commun. 2021 Apr 15;12(1):2274. doi: 10.1038/s41467-021-22521-5. PMID: 33140067 Free PMC article. Updated. Preprint.
References
-
- Center for Systems Science and Engineering at Johns Hopkins University , Coronavirus COVID-19 global cases. https://coronavirus.jhu.edu/map.html. Accessed 5 August 2020.
Publication types
MeSH terms
Grants and funding
LinkOut - more resources
Full Text Sources
Research Materials
Miscellaneous
