. 2020 Sep 24;11(1):4830.
doi: 10.1038/s41467-020-18376-x.

Raman-guided subcellular pharmaco-metabolomics for metastatic melanoma cells

Affiliations

Raman-guided subcellular pharmaco-metabolomics for metastatic melanoma cells

Jiajun Du et al. Nat Commun. .

Abstract

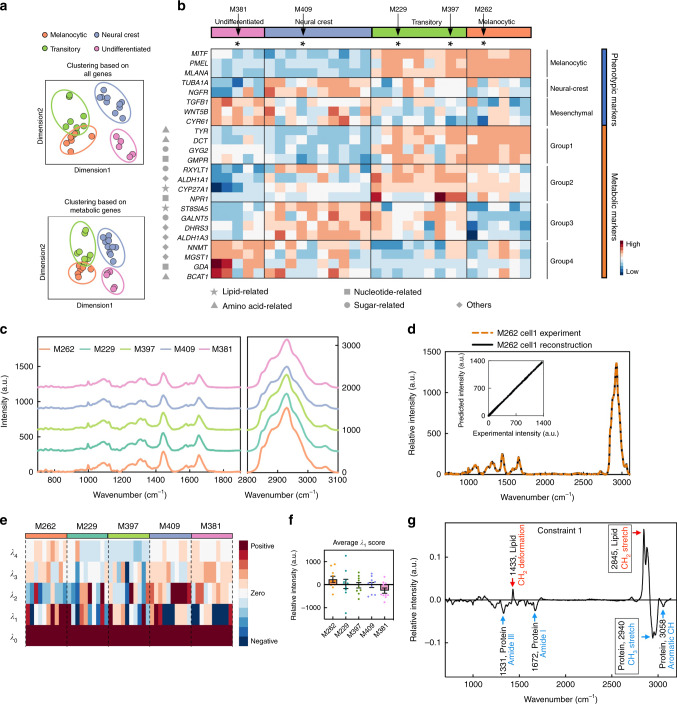
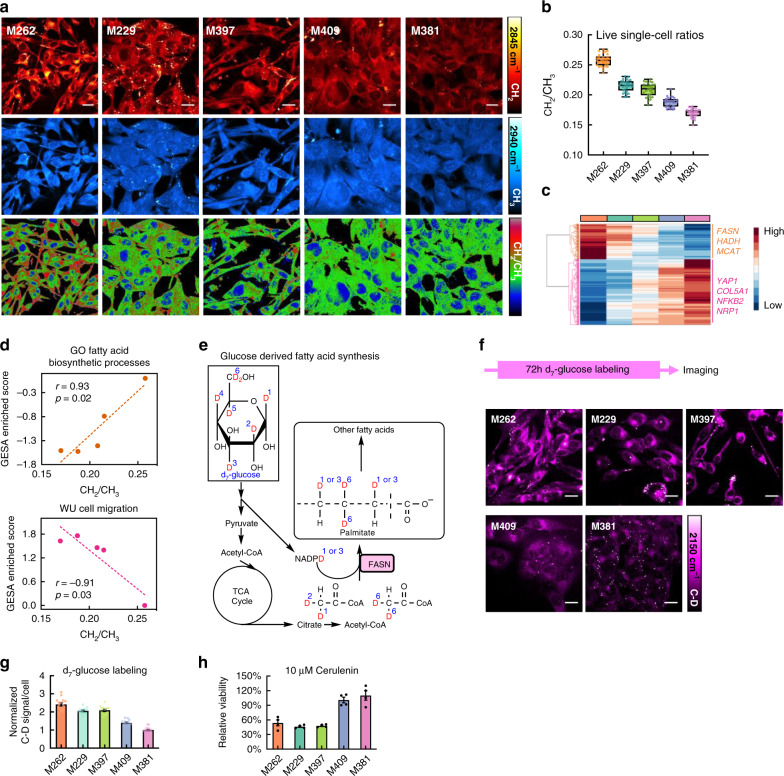
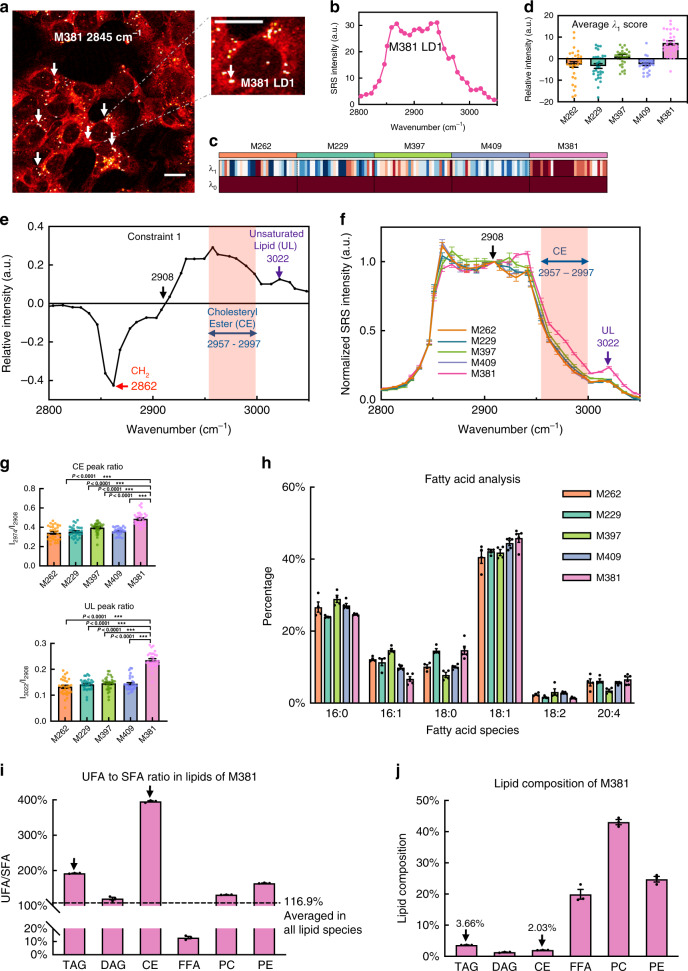
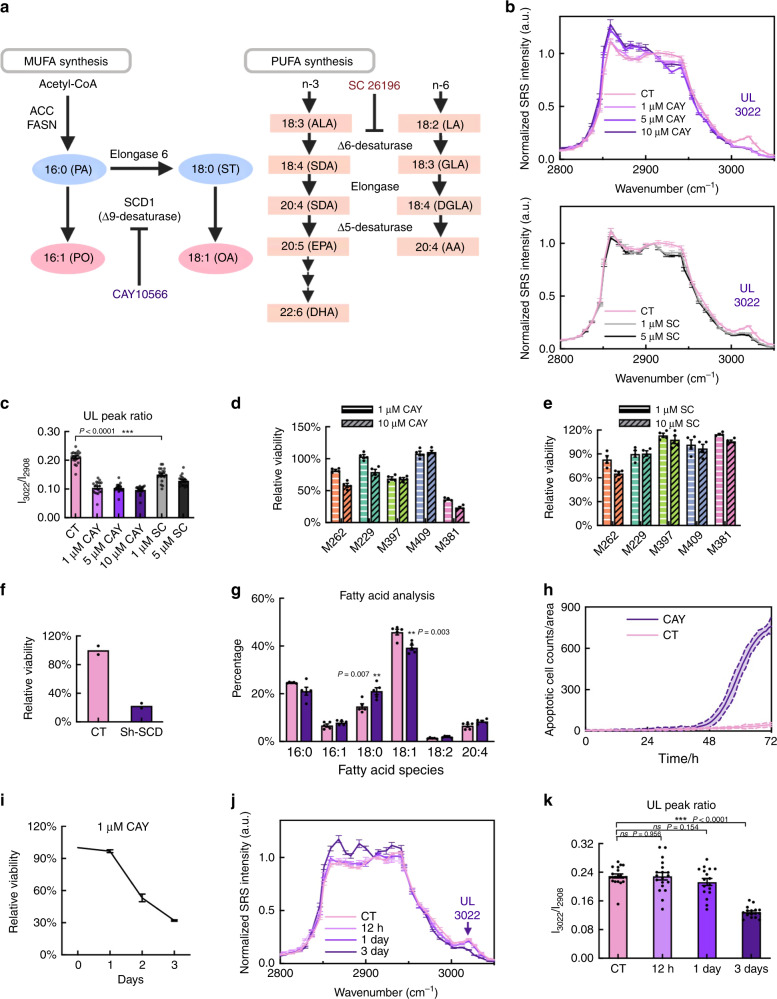
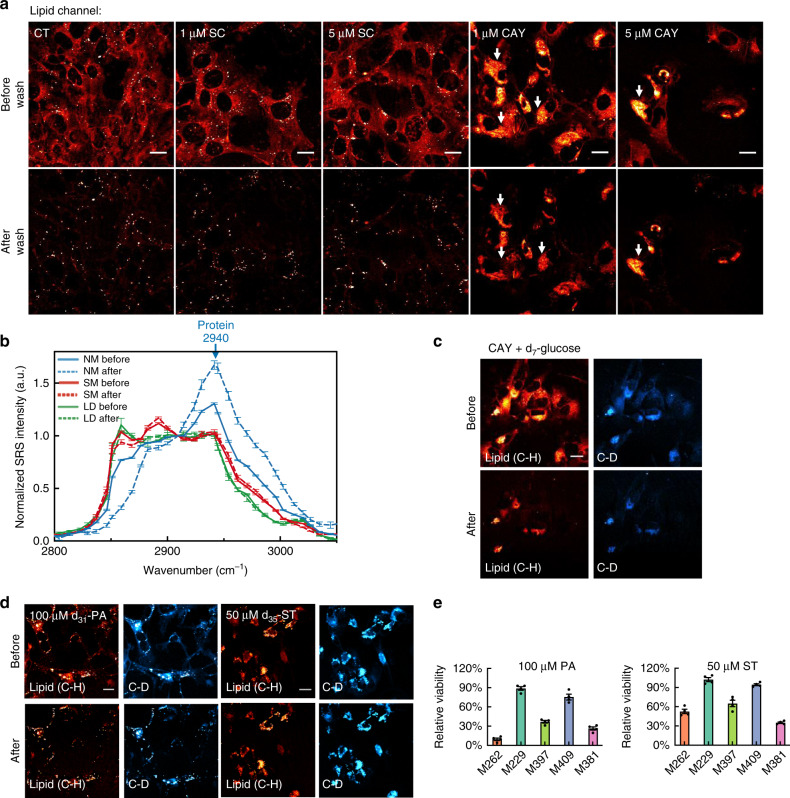
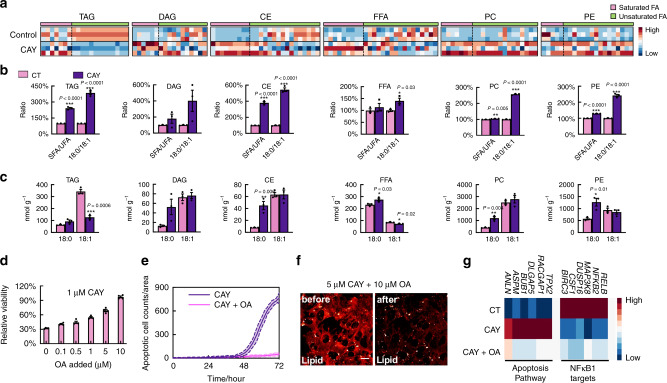
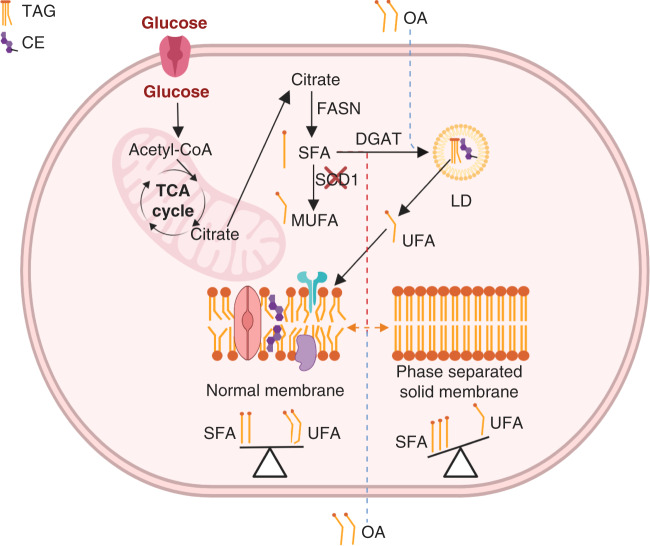
Non-invasively probing metabolites within single live cells is highly desired but challenging. Here we utilize Raman spectro-microscopy for spatial mapping of metabolites within single cells, with the specific goal of identifying druggable metabolic susceptibilities from a series of patient-derived melanoma cell lines. Each cell line represents a different characteristic level of cancer cell de-differentiation. First, with Raman spectroscopy, followed by stimulated Raman scattering (SRS) microscopy and transcriptomics analysis, we identify the fatty acid synthesis pathway as a druggable susceptibility for differentiated melanocytic cells. We then utilize hyperspectral-SRS imaging of intracellular lipid droplets to identify a previously unknown susceptibility of lipid mono-unsaturation within de-differentiated mesenchymal cells with innate resistance to BRAF inhibition. Drugging this target leads to cellular apoptosis accompanied by the formation of phase-separated intracellular membrane domains. The integration of subcellular Raman spectro-microscopy with lipidomics and transcriptomics suggests possible lipid regulatory mechanisms underlying this pharmacological treatment. Our method should provide a general approach in spatially-resolved single cell metabolomics studies.


Conflict of interest statement

The authors declare no competing interests.

Figures

Fig. 1
Fig. 1. Transcriptomics and spontaneous Raman spectra analysis of metastatic melanoma cell lines.
a Dimensional reduction of bulk transcriptomics data of 30 melanoma cell lines yields a clear separation of four different melanoma phenotypes, based on either the expression of all genes (top panel) or ~1600 metabolic genes (bottom panel). b A heatmap of gene expression levels for representative genes involved in defining the cellular and metabolic phenotypes shown in a. The black-font row labels are well-reported phenotypic marker genes for defining different subtypes. The gray-font row labels are top 4 ranked metabolic markers within each phenotype representing different processes, as identified by matching the symbol with the key at the bottom of the heatmap. The color-coded bars at the top of the heat map indicate the different cellular phenotypes for each cell line, while the arrows point to the five representative cell lines selected for Raman analysis. c Spontaneous Raman spectra of five selected cell lines (averaged over 50 spectra from 10 cells per cell line examined over three independent experiments). Each spectrum is offset apart in y-axis with no changes of absolute intensities. d A representative Raman spectrum of M262 cells reconstructed by summing the constraints λ0λ4 identified using surprisal analysis (SA). The inset plot shows the high correlation between the reconstructed and the measured spectrum. e Heatmap for scores of the top five constraints (λ0λ4) calculated by SA of the Raman spectra across the five cell lines (10 cells from each cell line). Each column represents SA scores across λ0–λ4 from an individual cell. Each row represents the score of a given constraint across multiple single cells. f The average score of constraint 1 (λ1) of 10 cells across all 5 cell lines. Data shown as mean ± SEM. g The spectrum of λ1, with Raman peak assignments. The most negative feature is from CH3 vibration at 2940 cm−1 arising mainly from proteins (blue, boxed). The most positive feature is a CH2 vibration at 2845 cm−1 mainly from lipids (red, boxed). Source data are provided as a Source data file.
Fig. 2
Fig. 2. Live-cell SRS imaging and transcriptomics analysis reveal a differentiated-cell-specific susceptibility.
a Representative live-cell SRS images targeted on the CH2 (top, 2845 cm−1) and CH3 (middle, 2940 cm−1) channels and the corresponding CH2 to CH3 ratio (bottom, CH2/CH3) images. b Average live single-cell CH2/CH3 values from the SRS ratio images for each cell line (n = 30 cells per cell line examined over five independent experiments). Data are plotted as boxplots: center line indicates median; box limits indicate upper and lower quartiles; whiskers indicate minimum and maximum. c Heatmap of genes with strong correlations or anticorrelations to the CH2/CH3 trends shown in b. Representative genes involved in fatty acid metabolism (orange, positive correlation) and mesenchymal signature (purple, negative correlation) are indicated. d Two representative top biological functional processes from Gene Set Enrichment Analysis (GSEA) with GSEA scores that exhibit positive (top panel) or negative (bottom panel) correlations with the phenotype-dependent CH2/CH3 trends across different cell lines. e Illustration of the pathway for deuterium transfer from deuterated glucose (d7-glucose) to de novo synthesized fatty acids through the major lipid biosynthetic pathways. f SRS imaging at the C-D channel (2150 cm−1) for newly synthesized fatty acids in all 5 selected cell lines cultured with d7-glucose medium for 3 days. Labeling and imaging scheme shown on top. g Single-cell quantification of relative C-D signals in d7-glucose labeled cells (n = 15 cells examined over three independent experiments, the C-D signals of M381 cells are normalized to one). h Relative viability of melanoma cells after treatment of FASN inhibitor cerulenin (10 μM, 3 days, n = 4 independent experiments). Scale bars, 20 μm. Data shown as mean ± SEM. Source data are provided as a Source data file.
Fig. 3
Fig. 3. Accumulation of unsaturated lipids and cholesteryl esters in lipid droplets (LDs) of de-differentiated M381 cells.
a A representative SRS image of M381 cells imaged in the CH2 (2845 cm−1) channel. LDs are indicated. A zoomed-in image at right highlights a single LD. b The hSRS spectrum of the zoomed-in LD in a at the C–H stretch region (2800–3050 cm−1). c Heatmap for scores of the top two constraints (λ0λ1) by surprisal analysis of hSRS spectra on LDs across five cell lines (n = 30 LDs per cell line examined over three independent experiments). Each column represents an individual LD and each row represents the constraint scores. d The average score of λ1 across five cell lines (n = 30 LDs). e Raman peak assignments for constraint 1 (λ1). The pink shadowed range from 2957 to 2997 cm−1 is assigned to cholesteryl esters (CE), and the 3022 cm−1 peak (violet arrow) is assigned to unsaturated lipids (=C–H, UL). f hSRS spectra (normalized at 2908 cm−1, the zero point revealed in e) of LDs across each cell line (n = 30). g Quantification of relative CE (2974 cm−1/2908 cm−1, top panel) and UL (3022 cm−1/2908 cm−1, bottom panel) enrichment in LDs across cell lines from f (n = 30). h GC-MS measurement of fatty acids extracted from bulk melanoma cells. The percentages of 16:0, 16:1, 18:0, 18:1, 18:2, and 20:4 are normalized to all extracted fatty acids (n = 4 independent experiments for M262, M229, M397; n = 5 independent experiments for M409 and M381). i Average ratio of unsaturated fatty acids (UFA) to saturated fatty acids (SFA) in each lipid class from lipidomics of M381 cells (n = 3 independent experiments). j Percentage of major lipid classes from lipidomics of M381 cells (n = 3). ***p < 0.001 from two-tailed unpaired t-tests. Scale bars, 20 μm. Data shown as mean ± SEM. Lipidomics data are provided as Supplementary Data 1. Source data are provided as a Source data file.
Fig. 4
Fig. 4. SCD1-dependent viability for the mesenchymal M381 cells.
a (Left) De novo synthesis pathway of monounsaturated fatty acids (MUFA) and (right) polyunsaturated fatty acids (PUFA) in mammalian cells. CAY10566 and SC 26196 are SCD1 (Δ9-desaturase) and Δ6-desaturase inhibitor, respectively. b Normalized (to 2908 cm−1) hSRS spectra of LDs in M381 cells without (CT) and with treatment of (top) 1, 5 and 10 μM CAY (n = 16, 18, 19, 19 for CT, 1, 5 and 10 μM CAY, respectively), and (bottom) 1 μM and 5 μM SC (n = 16, 19, 19 for CT, 1 μM and 5 μM SC, respectively) for 3 days. c Quantification of unsaturated lipid (UL) by intensity ratios of 3022 cm−1/2908 cm−1 from b. Relative viability of all five cell lines after treatment of 1 μM and 10 μM CAY for 3 days (n = 4 independent experiments) (d) or 1 μM and 10 μM SC for 3 days (n = 4 independent experiments) (e). f Relative viability of M381 cells after shRNA knockdown of SCD1 gene compared to scrambled control (CT) (n = 2 independent experiments). g GC-MS measurements of fatty acids extracted from bulk M381 cells with (CAY, purple) and without (CT, pink) treatment of 1 μM CAY for 3 days. The percentages of 16:0, 16:1, 18:0, 18:1, 18:2, and 20:4 fatty acids are normalized to total extracted fatty acids (n = 5 independent experiments). h Time-lapse apoptotic cell counts of M381 cells with (purple, CAY) and without (pink, CT) treatment of 1 μM CAY (n = 3 independent experiments, data shown as mean ± error with 95% CI). i Time-dependent relative viability of M381 cells after treatment of 1 μM CAY for 0, 1, 2, and 3 days (n = 4 independent experiments). j Normalized (to 2908 cm−1) hSRS spectra of LDs in M381 cells without (CT) and with 1 μM CAY treatment for 12 h, 1 day and 3 days (n = 20, 19, 17, 14 for CT, 12 h, 1 day and 3 days, respectively). k Quantification of UL from intensity ratios of 3022 cm−1/2908 cm−1 in j. **p < 0.01, ***p < 0.001, ns: not significant (p > 0.05) from two-tailed unpaired t-tests. Data shown as mean ± SEM. Source data are provided as a Source data file.
Fig. 5
Fig. 5. Formation of intracellular phase-separated solid membrane (SM) domains induced by mono-unsaturation inhibition.
a Representative lipid-channel SRS images from the same set of M381 cells before (top) and after (bottom) detergent wash in control (CT), with SC or CAY treatment. Detergent-resistant SM structures are arrow indicated. b Normalized (to 2908 cm−1) hSRS spectra on the same NM (normal membrane, blue), SM (red), and LDs (green) structures in M381 cells from before (solid-lined) and after (dash-lined) detergent wash. (n = 7, 12, 6 for NM, SM, LD, respectively, blue arrow indicates the protein peak at 2940 cm−1). c SRS images at the lipid (C-H) and the C-D channels on the same set of M381 cells growing in d7-glucose medium with 1-day 5 μM CAY before (top) and after (bottom) detergent wash. d SRS images at the lipid (C-H) and the C-D channels on the same set of M381 cells with 3-day d31-palmitic acid (d31-PA) or d35-stearic acid (d35-ST) treatment before (top) and after (bottom) detergent wash. e Relative cellular viability with 3-day PA or ST treatment (n = 4 independent experiments). Scale bars, 20 μm. Data shown as mean ± SEM. Source data are provided as a Source data file.
Fig. 6
Fig. 6. Lipid regulation upon mono-unsaturation inhibition and cellular rescue with oleic acid (OA) supplementation.
a Heatmap for the relative fatty acid abundances in designated classes of lipids from lipidomics of bulk M381 cells with (CAY) and without (CT) CAY (1 μM, 3 days) treatment. Each row represents a sample replicate and each column represents fatty acyl chains with increasing length and increasing double-bond numbers. SFA and UFA are categorized by pink and green, respectively. The abundance of FA of different chain length is normalized as a Z-score across all six samples within each column. TAG Triacylglycerol, DAG Diacylglycerol, CE Cholesteryl Ester, FFA Free Fatty Acids, PC Phosphatidylcholine, PE Phosphatidylethanolamine. b Overall concentration ratios between SFA to UFA (SFA/UFA), and between ST to OA (18:0/18:1) with CAY (purple) and without CAY (CT, pink, each value is shown as 100% reference) treatment from lipidomics of M381 cells in a (n = 3). c Concentration changes of 18:0 and 18:1 with CAY (purple) and without CAY (CT, pink) from lipidomics in a (n = 3 independent experiments). d Relative viability of M381 cells treated with 1 μM CAY with supplement of OA (18:1) at indicated concentration for 3 days (n = 4 independent experiments). e, Time-lapse apoptotic cell counts of M381 cells after treatment of 1 μM CAY with (pink) or without (purple) 10 μM OA (n = 3 independent experiments, data shown as mean ± error with 95% CI). f SRS imaging at the lipid channel before (left) and after (right) detergent wash on the same set of M381 cells treated with CAY and OA for 3 days. g Ranked pathways from analysis of gene expression trends on control (CT), CAY-treated (middle row, CAY) and CAY plus OA (CAY + OA) M381 cells. Scale bars, 20 μm. Data shown as mean ± SEM. *p < 0.05, **p < 0.01, ***p < 0.001 from two-tailed unpaired t-tests. Lipidomics data are provided as Supplementary Data 1. Source data are provided as a Source data file.
Fig. 7
Fig. 7. Schematic of the proposed cellular metabolic processes for M381 cells under SCD1 inhibition.
SCD1 inhibition blocks de novo MUFA synthesis from SFA, which leads to an imbalance of intracellular SFA and UFA. This imbalance drives the release of UFAs stored in M381 lipid droplets, which act as reservoirs of unsaturated lipids, to restore the balance between SFA and UFA. Prolonged SCD1 inhibition eventually depletes the stored UFA. The resulting imbalance between SFA and UFA transforms fluid normal membrane domains into phase-separated solid membranes. The accompanied loss of membrane fluidity and exclusion of membrane-residing proteins are associated with an induced apoptosis—a cell fate that can be rescued by supplying excess UFA in the culture medium.

Similar articles

Cited by

References

    1. Camp JG, Platt R, Treutlein B. Mapping human cell phenotypes to genotypes with single-cell genomics. Science. 2019;365:1401–1405. doi: 10.1126/science.aax6648. - DOI - PubMed
    1. Tang F, Lao K, Surani MA. Development and applications of single-cell transcriptome analysis. Nat. Methods. 2011;8:S6–S11. doi: 10.1038/nmeth.1557. - DOI - PMC - PubMed
    1. Tirosh I, et al. Dissecting the multicellular ecosystem of metastatic melanoma by single-cell RNA-seq. Science. 2016;352:189–196. doi: 10.1126/science.aad0501. - DOI - PMC - PubMed
    1. Patel AP, et al. Single-cell RNA-seq highlights intratumoral heterogeneity in primary glioblastoma. Science. 2014;344:1396–1401. doi: 10.1126/science.1254257. - DOI - PMC - PubMed
    1. Budnik B, Levy E, Harmange G, Slavov N. SCoPE-MS: mass spectrometry of single mammalian cells quantifies proteome heterogeneity during cell differentiation. Genome Biol. 2018;19:1–12. doi: 10.1186/s13059-018-1547-5. - DOI - PMC - PubMed

Publication types