. 2020 Sep 24;11(1):4828.
doi: 10.1038/s41467-020-18580-9.

ATR is essential for preservation of cell mechanics and nuclear integrity during interstitial migration

Affiliations

ATR is essential for preservation of cell mechanics and nuclear integrity during interstitial migration

Gururaj Rao Kidiyoor et al. Nat Commun. .

Abstract

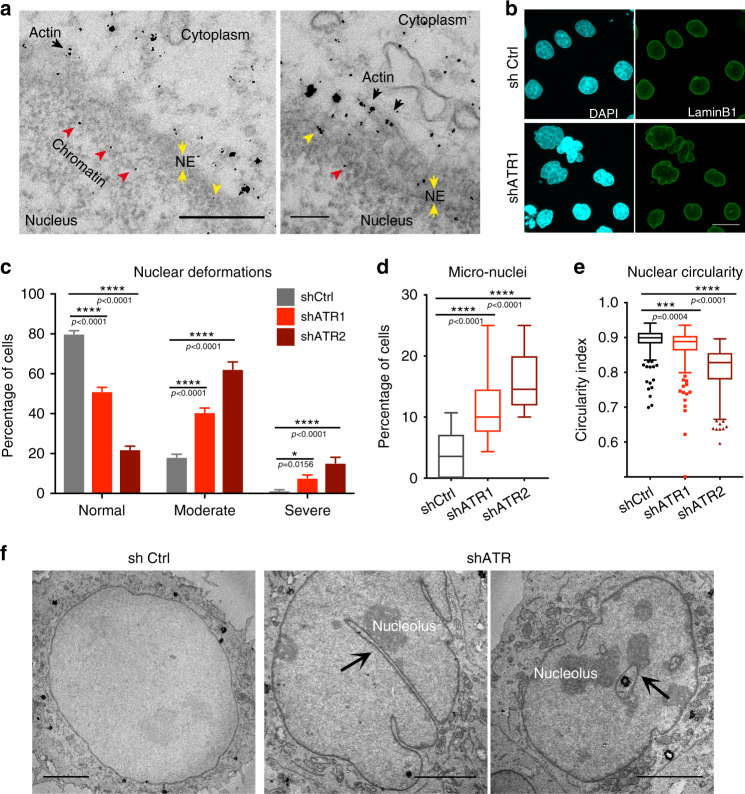
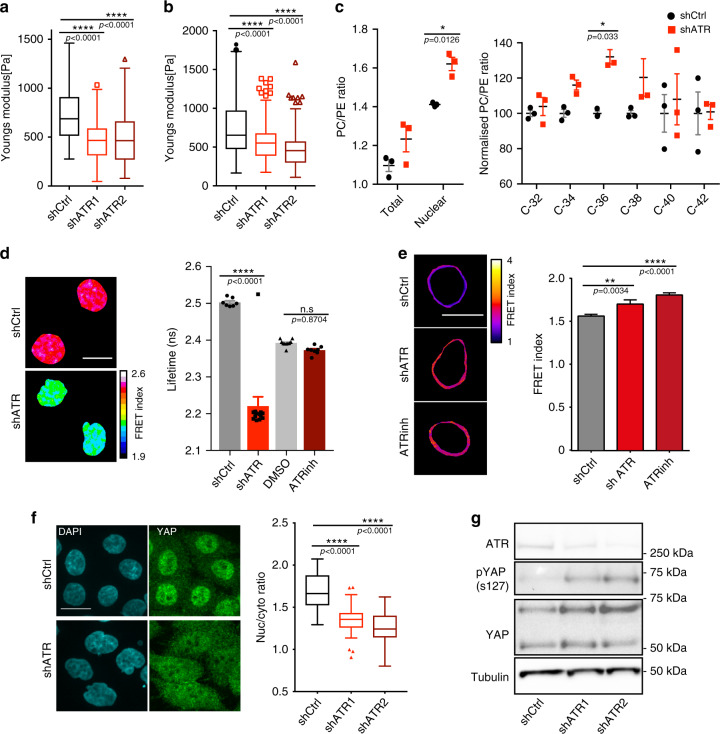
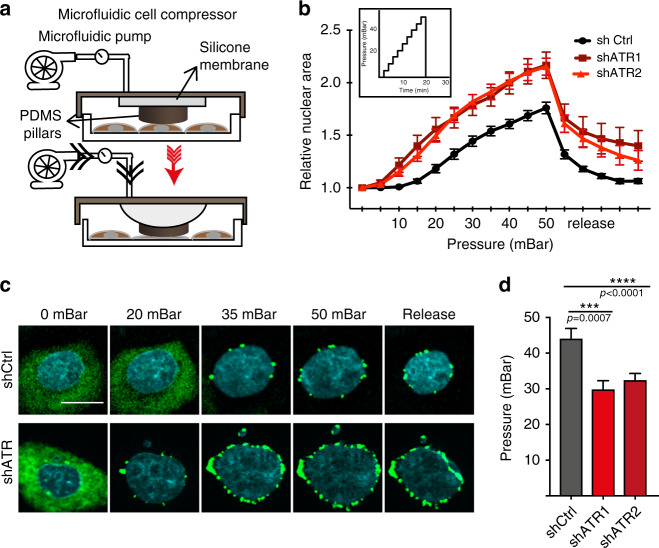
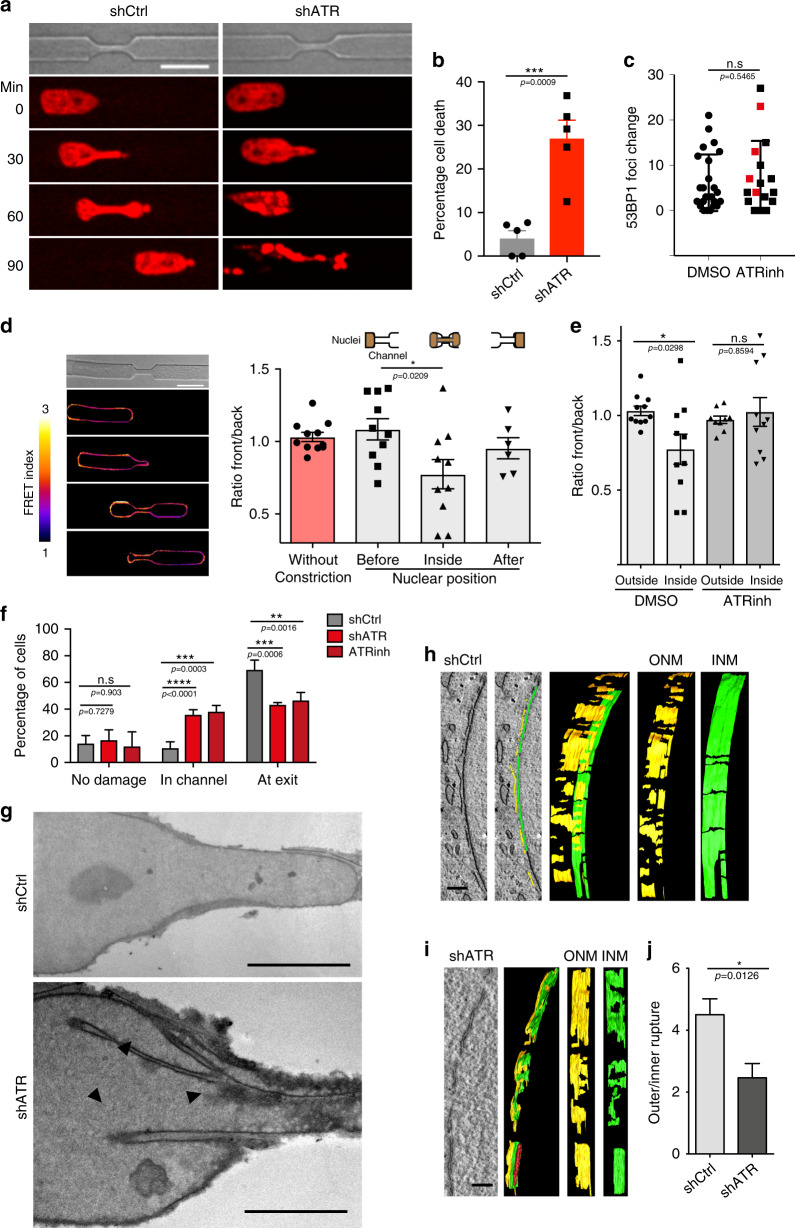
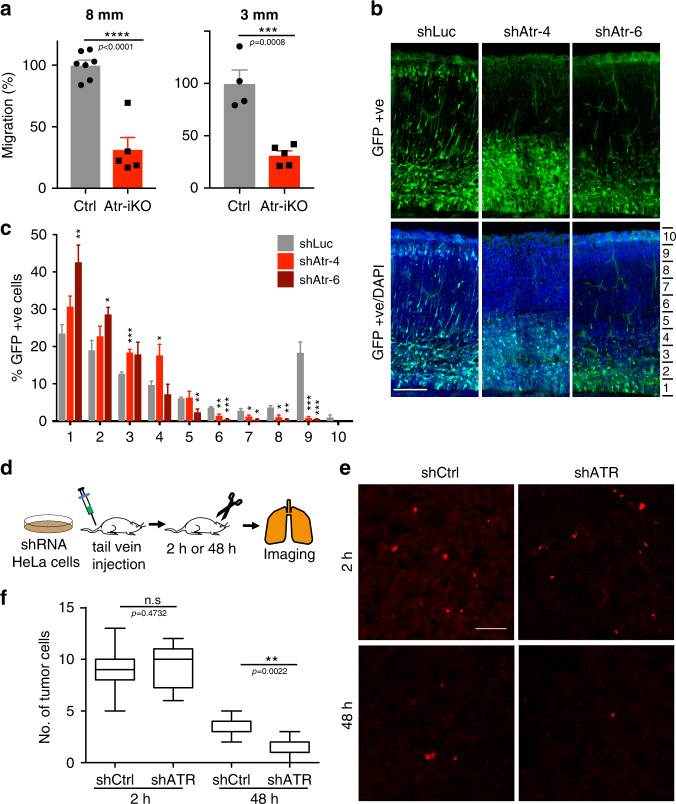
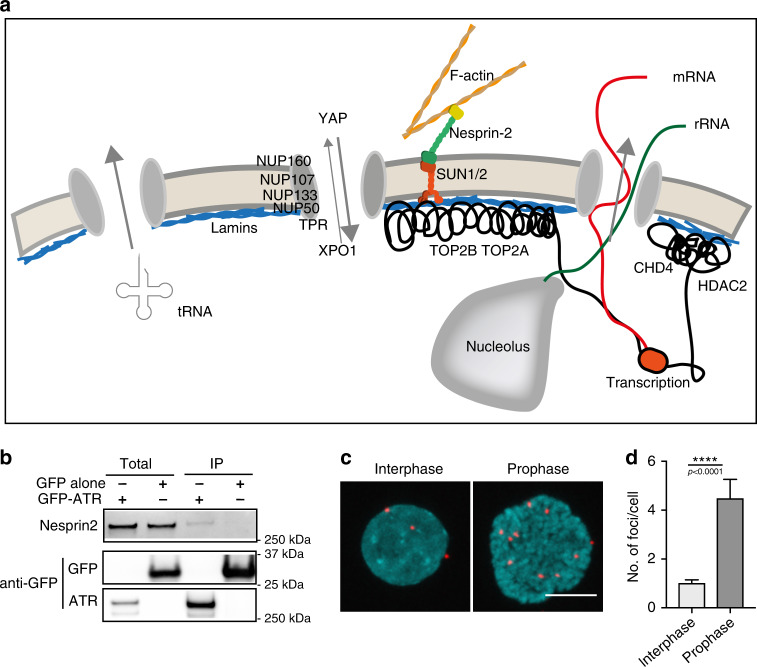
ATR responds to mechanical stress at the nuclear envelope and mediates envelope-associated repair of aberrant topological DNA states. By combining microscopy, electron microscopic analysis, biophysical and in vivo models, we report that ATR-defective cells exhibit altered nuclear plasticity and YAP delocalization. When subjected to mechanical stress or undergoing interstitial migration, ATR-defective nuclei collapse accumulating nuclear envelope ruptures and perinuclear cGAS, which indicate loss of nuclear envelope integrity, and aberrant perinuclear chromatin status. ATR-defective cells also are defective in neuronal migration during development and in metastatic dissemination from circulating tumor cells. Our findings indicate that ATR ensures mechanical coupling of the cytoskeleton to the nuclear envelope and accompanying regulation of envelope-chromosome association. Thus the repertoire of ATR-regulated biological processes extends well beyond its canonical role in triggering biochemical implementation of the DNA damage response.


Conflict of interest statement

The authors declare no competing interests.

Figures

Fig. 1
Fig. 1. ATR interacts with membranes and preserves nuclear morphology.
a Images from routine 60 nm EM section with enrichment of nano-gold-labeled ATR in the perinuclear region. Colored arrowheads indicate actin-associated (black), chromatin-associated (red), and membrane-associated ATR (yellow), respectively (scale bar 500 ηm for the right and 200 ηm for the left panel). b Defective nuclear morphology of ATR-depleted HeLa cells visualized with immunofluorescence of Lamin B1 (NE) and DAPI (DNA) (scale bar = 50 μm). c Quantification of nuclear deformations by manual sorting based on their degree of deformation: Normal, mildly deformed and severely deformed (n = 515, 525, 229 cells for shCtrl, shATR1, and ShATR2, respectively). Quantifications of d micronuclei (n = 515, 525, and 229 cells for shCtrl, shATR1, and ShATR2, respectively) and e nuclear circularity index (n = 288, 253, and 215 cells for shCtrl, shATR1, and ShATR2, respectively; N = 3 independent experiments). f EM images of the nucleus from control and ATR-depleted HeLa cells. Arrowheads indicate invaginations with nucleoli attachment (scale bar 5 μm). Bar graphs presented as mean ± SEM and box plot whiskers and outliers plotted with Tukey’s method. p-values calculated using two-way ANOVA test for c or for d. e Ordinary one-way ANOVA test with Dunnett’s multiple comparisons test (****P < 0.0001, ***P < 0.001, **P < 0.01, *P < 0.05; NS, not significant). Source Data file contains source data and all additional details of statistical analysis.
Fig. 2
Fig. 2. ATR preserves nuclear mechanics.
a, b Elastic modulus measurements using AFM. a Cellular stiffness (n = 171, 161, and 179 measurements for shCtrl, shATR1, and ShATR2, respectively) and b stiffness of isolated nuclei from control and ATR-depleted cells (n = 144, 110, and 98 measurements; N = 2 independent experiments). c Membrane phospholipid composition analysis; total cell and nuclear membrane PC/PE ratio, nuclear PC/PE ratio of individual species (from three biological and two technical replicates; two-way ANOVA test; Bonferroni’s multiple comparisons test; N = 2 independent experiments). d FLIM-FRET analysis of cells expressing H2B-GFP and H2B-mCherry; sample images of Fluorescent lifetime (FLIM-FRET index) and overall Lifetime in Hela cells infected with shATR (n = 13) or control (n = 7), or treated with DMSO (n = 10) or ATR inhibitor for 4 h (n = 8). e Examples of FRET signals at the NE as measured by Nesprin-2 FRET sensor in control, shATR, and control cells in the presence of ATR inhibitor (3 h), and quantification of FRET signals (n = 112, 88, and 96 measurements for shCtrl, shATR1, and ShATR2 respectively; data pooled from two or three independent experiments). f Immunofluorescent images of YAP cellular distribution in control and shATR cells, (below) quantifications of nuclear to cytoplasmic YAP signal ratio (n = 69, 66, and 58 shCtrl, shATR1, and ShATR2, respectively). g Western blotting of ser127-phosphorylated YAP (N = 2 independent experiments. Uncropped images available in Source Data file). Scale bar is 20 μm in all images. Bar graphs presented as mean ± SEM and box plot whiskers and outliers plotted using Tukey’s method in prism7 software. p-values calculated using one-way ANOVA test with Tukey’s multiple comparisons test (for d) or Dunnett’s multiple comparisons test (for a, b, e, f). (****P < 0.0001; ***P < 0.001; **P < 0.01; *P < 0.05; n.s., not significant).
Fig. 3
Fig. 3. ATR-defective cells undergo nuclear collapse upon mechanical compression.
Mechanical compression using a microfluidic compression device. a Design and b graph of compression-induced nuclear deformation with respect to the pressure applied, represented as ratio of its initial uncompressed area. In inlet, graph representing step-wise increase of pressure used for the experiment. c Time-lapse images of perinuclear cGAS foci formation in control and ATR-depleted cells under compression. d Amount of pressure applied through the microfluidic pump during the time of NE rupture (formation of first foci of cGAS) (n = 19, 24, and 21 shCtrl, shATR1, and ShATR2, respectively; data pooled from N = 2 independent replicates). All graphs presented as mean ± SEM. p-values are calculated using two-way ANOVA test and Tukey’s multiple comparisons test for b and one-way ANOVA test with Dunnett’s multiple comparisons test for d (**** if P < 0.0001, *** if P < 0.001).
Fig. 4
Fig. 4. ATR-defective nuclei are inefficient in migrating through narrow pores.
a Snapshots of H2B-mCherry labeled control and shATR nuclei passing through constriction. b Cell death measured as the percentage of engaged cells that burst at the constriction (n = 122 and 88 cells for shCtrl and shATR1; data pooled from three independent experiments). c Quantification of 53BP1-GFP foci generated due to constriction in HeLa cells expressing 53BP1-GFP in the presence of DMSO or ATR inhibitor, VE-821 (n = 24 and 17 for DMSO and ATRinh; pooled from two independent experiments). Cells that undergo cell death in the constriction are highlighted in red (for ATRinh). d, e FRET signal measurements of cells engaged in constrictions. d Images of FRET signal at various stages of migration through the constriction and measurement of signal ratio between front (leading half of the nucleus) and back (lagging half of the nucleus) of a nuclei at various stages of migration (n = 11, 10, 10, and 6, respectively). e Ratio of front to back FRET signal in migrating cells (inside or outside the constriction) in the presence DMSO or ATRinh (n = 11, 10, 9, and 10; data from 2 to 3 experiments). f Quantification of nuclear position in the constriction during the first cGAS foci formation (n = 47, 43, and 28; numbers pooled from 3 experiments). g EM images of control and shATR nuclei in constriction (routine 200 nm EM sections). Arrowheads indicate invaginations and NE attached chromatin or nucleoli. h 3D reconstruction of NE at the leading edge from control nucleus in constriction. Green color indicates inner nuclear membrane (INM) and yellow indicates outer nuclear membrane (ONM). i 3D reconstruction of NE section from leading edge of shATR nucleus in constriction. j Quantification of ratio between number of inner nuclear membrane breaks to that of the outer membrane (n = 15 and 13). Scale bar for a, d is 20 μm, for g is 9 μm, and for i, h is 200 ηm). Bar graphs presented as mean ± SEM and dot-plot as mean ± SD. P-value calculated using two-tailed Student’s t-test for b, c, j. One-way ANOVA for d, e with Tukey’s or Sidak’s multiple comparisons test, and two-way ANOVA for f (****P < 0.0001, ***P < 0.001, **P < 0.01, and *P < 0.05; n.s., not significant).
Fig. 5
Fig. 5. Loss of ATR dampens neuronal migration and tumor cell circulation.
a Relative migration of neuroprogenitors isolated from Atr-iKO mice brain were plated into 8 μm (n = 7, 5 cell lines) or 3 μm (n = 4, 5 cell lines) polycarbonate membrane insert (ThinCert™), allowed to migrate for 20 h, then fixed and counted (neuroprogenitors isolated from 13 embryos from 2 pregnant mice independently). b, c In vivo neuronal migration: b images of cortical plates from E18.5 embryos. c Percentage of GFP-positive (GFP+) cells present in different equally divided segments of E18.5 brain cortex (n = 4 animals, 5 section, 2270 GFP+ cells for shLuc; n = 4 animals, 5 section, 2475 GFP+ cells for shAtr-4; n = 2 animals, 3 section, 730 GFP+ cells for shAtr-6. Statistical comparisons performed between shLuc individually with shAtr-4 or shAtr-6 from the same layer). d Scheme of in vivo homing assay. Control and shATR HeLa cells labeled with vital dye were injected into the tail vein of immune-compromised mice. Sections of the lung were collected after 2 and 48 h, respectively. e Images of lung surface with labeled HeLa cells residing on them. f Quantifications of cells/field at 2 and 48 h, respectively (n = 25 images from 5 mice and 15 images from 3 mice (for 2 and 48 h) for control; 20 images from 4 mice (for 2 h) and 25 images from 5 mice (for 48 h) for shATR). Scale bar is 100 μm in all images. Bar graphs presented as mean ± SEM and box plot whiskers and outliers plotted using Tukey’s method in prism-7 software. p-values calculated using two-tailed Student’s t-test or one-way ANOVA test with Tukey’s multiple comparisons test (****P < 0.0001, ***P < 0.001, **P < 0.01, *P < 0.05, n.s., not significant).
Fig. 6
Fig. 6. ATR interactors.
a Schematic summary of ATR interactors and their relative roles at the nuclear envelope and perinuclear areas b Validation of Nesprin-2 and ATR interaction using GFP-ATR immunoprecipitation and western blot analysis (full blots of Nesprin-2 with molecular weights included in Supplementary Fig. 4h and in Source data file). c Example of ATR–Nesprin-2 interaction foci generated by proximity ligation assay (PLA) in interphase and prophase cells (scale bar = 10 μm). d Quantification of total number of foci present in interphase and prophase cells (n = 65 for interphase and 10 for mitosis, pooled from 2 independent experiments). Graph presented as mean ± SEM. p-value calculated using two-tailed Student’s t-test.
Fig. 7
Fig. 7. Graphical summary of ATR defects affecting nuclear morphology and mechanics and relative pathological consequences.
In the absence of external stimuli ATR coordinates chromatin processes (such as RNA export, epigenetic and topological transitions, and chromatin condensation in prophase) with NE dynamics, influencing nuclear morphology. ATR defects lead to nuclear deformation, NE remodeling, altered nuclear mechanics, and YAP delocalization. In response to mechanical stress, ATR-defective nuclei collapse leading to NE ruptures and cGAS recruitment at the nuclear periphery. Pathological consequences are also described. See text for details.

Similar articles

Cited by

References

    1. Cho S, Irianto J, Discher DE. Mechanosensing by the nucleus: from pathways to scaling relationships. J. Cell Biol. 2017;216:305–315. doi: 10.1083/jcb.201610042. - DOI - PMC - PubMed
    1. Kirby TJ, Lammerding J. Emerging views of the nucleus as a cellular mechanosensor. Nat. Cell Biol. 2018;20:373–381. doi: 10.1038/s41556-018-0038-y. - DOI - PMC - PubMed
    1. Branzei D, Foiani M. Regulation of DNA repair throughout the cell cycle. Nat. Rev. Mol. Cell Biol. 2008;9:297–308. doi: 10.1038/nrm2351. - DOI - PubMed
    1. Matsuoka S, et al. ATM and ATR substrate analysis reveals extensive protein networks responsive to DNA damage. Science. 2007;316:1160–1166. doi: 10.1126/science.1140321. - DOI - PubMed
    1. O’Driscoll M, Ruiz-Perez VL, Woods CG, Jeggo PA, Goodship JA. A splicing mutation affecting expression of ataxia-telangiectasia and Rad3-related protein (ATR) results in Seckel syndrome. Nat. Genet. 2003;33:497–501. doi: 10.1038/ng1129. - DOI - PubMed

Publication types