. 2020 Sep 24;11(1):4827.
doi: 10.1038/s41467-020-18577-4.

A possible universal role for mRNA secondary structure in bacterial translation revealed using a synthetic operon

Affiliations

A possible universal role for mRNA secondary structure in bacterial translation revealed using a synthetic operon

Yonatan Chemla et al. Nat Commun. .

Abstract

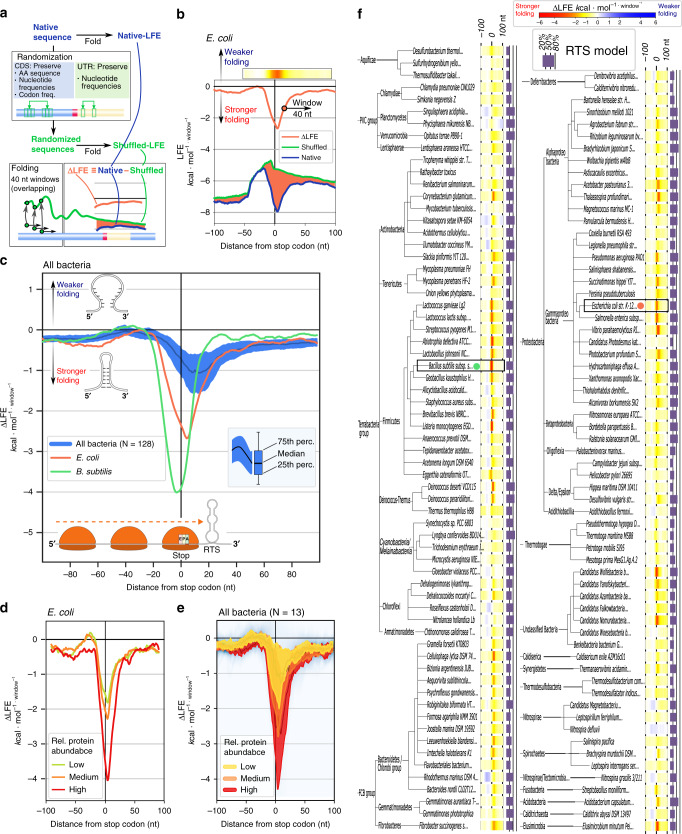
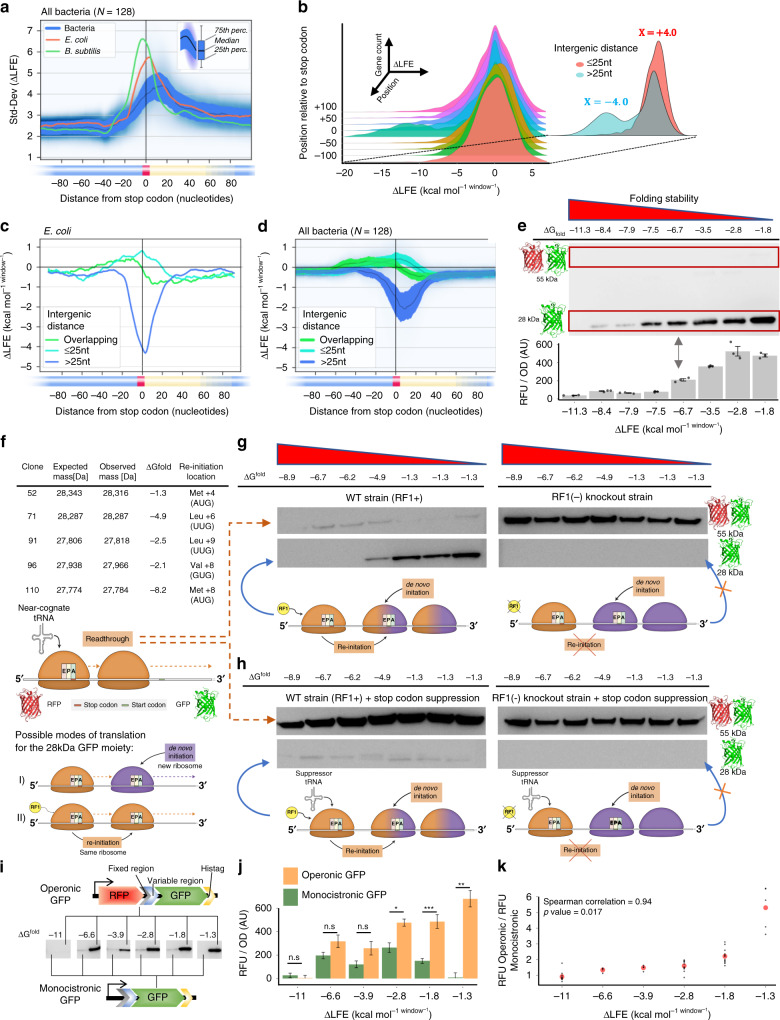
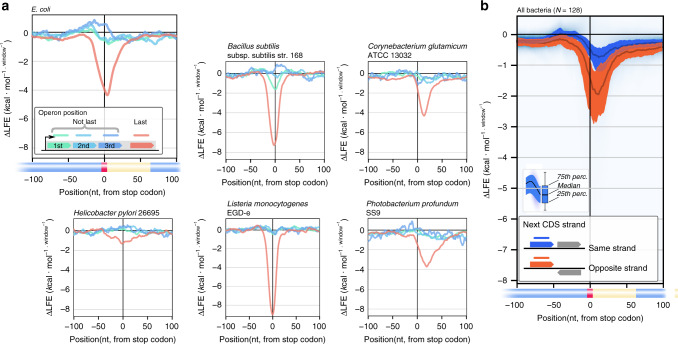
In bacteria, translation re-initiation is crucial for synthesizing proteins encoded by genes that are organized into operons. The mechanisms regulating translation re-initiation remain, however, poorly understood. We now describe the ribosome termination structure (RTS), a conserved and stable mRNA secondary structure localized immediately downstream of stop codons, and provide experimental evidence for its role in governing re-initiation efficiency in a synthetic Escherichia coli operon. We further report that RTSs are abundant, being associated with 18%-65% of genes in 128 analyzed bacterial genomes representing all phyla, and are selectively depleted when translation re-initiation is advantageous yet selectively enriched so as to insulate translation when re-initiation is deleterious. Our results support a potentially universal role for the RTS in controlling translation termination-insulation and re-initiation across bacteria.


Conflict of interest statement

T.T., L.A., Y.C. and M.P. have submitted a US provisional patent application regarding the use of synthetic RTSs to improve protein expression yields and control translation re-initiation. U.S. Provisional Patent: BGU-RMT-P-095-USP, Status: Pending. The remaining authors declare no competing interests.

Figures

Fig. 1
Fig. 1. mRNA secondary structure (ΔGfold) controls distal operon gene expression.
a Synthetic operon design and the FACS scheme employed. b GFP and RFP fluorescence of 105 cells. c Sorting of 106 cells into color-coded bins with constant RFP and variable GFP levels (top); GFP distribution in 3000 cells from each bin after sorting (bottom). d Correlation between the population mean GFP expression levels and the weighted mean of ΔGfold of 3 × 103 unique sequences in each bin. The x and y axes error bars represent the 99% confidence interval and relative standard deviation, respectively. Spearman correlation was performed on the weighted averages of the six bins (n = 6, ρ = 1, p value = 0.0028). Correlation between GFP expression and ΔGfold of (e) all (n = 33) isolated variants, and (f) a subset (n = 8) presenting an AUG start codon at position +3 or +4. g ΔGfold landscape around the stop codon and the mRNA secondary structure presented in the first window outside the stop codon-occupying ribosome footprint of two selected clones (111, 207). The red dot represents the RFP stop codon. Secondary mRNA structures of all clones are available in Supplementary data file 3. h Schematic representation of the role of the RTS in distal operon gene translation (ribosomes are not drawn to scale).
Fig. 2
Fig. 2. RTSs are conserved across bacterial phyla.
a Pipeline for genome-wide RTS analysis. ∆LFE analysis reveals that on average for all genes, an RTS is present and localized downstream of stop codons across (b) E. coli (orange), c B. subtilis (green), and 128 bacterial species examined (blue). The RTS signal is more significant in genes encoding highly abundant products in (d) E. coli, and (e) all bacterial species for which protein abundance data is available. f ∆LFE heatmap depicting the 100 nucleotide-long regions around stop codons across bacteria (warm colors: stronger folding than expected; cool colors: weaker folding than expected). The purple bar, left of each species heatmap, represents the fraction of genes in which RTS was found under the RTS statistical model described in the Methods section.
Fig. 3
Fig. 3. The RTS controls translation re-initiation.
a ΔLFE standard deviation landscape around stop codons. b E. coli gene density plot (Z-axis) versus ΔLFE (X-axis) and distance from a stop codon (Y-axis). Different colors are used for improved visualization. Inset shows gene density at position zero. Gene pairs separated by an intergenic distance larger or smaller than 25 nucleotides are in cyan and red, respectively. Gray represents the intersection of the two groups. The RTS profile around the stop codon depends on the inter-cistronic distance before the downstream gene in (c) E. coli and (d) 128 bacterial species. All parameters used to calculate ΔLFE are constant across all figures, and relied on a window size of 40 nucleotides. e Representative anti-His-tag Western blot (top) and the mean of n = 3 fluorescence measurements (error bars represents standard error; bottom) of eight AUG (+3/+4) clones, with ΔGfold indicated. f Mass spectrometry analysis of GFP from selected library clones, with the codon and location used for re-initiation indicated. Representative cropped Western blots of seven random E. coli clones (g) without or (h) with stop codon reassignment, each in the presence (left) or absence (right) of RF1. i Genetic constructs of operonic and monocistronic GFP. Each anti-His-tag Western blot represents a comparison, normalized to OD, between the two constructs for each of six tested clones. j The mean fluorescence measurements comparing the two constructs. Error bars represent standard deviation. Significance was determined by Welch two-sample t-tests (from left to right; df = 22.0, p = 0.4164; df = 4.5, p = 0.1091; df = 6.3, p value = 0.0854; df = 20.9, p value = 0.0397; df = 16.3, p value = 0.00061; df = 4.3, p value = 0.0067). k Spearman correlation (n = 6, ρ = 0.94, p value = 0.017), between the ratio of operonic to monocistronic GFP levels and ΔGfold of each clone. Uncropped Western blots are available (Fig. S9). Ribosomes are not drawn to scale.
Fig. 4
Fig. 4. In all bacteria phyla, RTSs are enriched where re-initiation is deleterious and depleted where re-initiation is advantageous.
a RTS presence depends on operonic position in E. coli and in all operon-mapped bacterial species. The blue curves represent the average ΔLFE of first and middle operon genes, while the red curve represents terminal operon genes. b RTS presence depends on downstream cistron directionality in 128 bacterial species.

References

    1. Simonetti A, et al. Structure of the 30S translation initiation complex. Nature. 2008;455:416–420. doi: 10.1038/nature07192. - DOI - PubMed
    1. Huber M, et al. Translational coupling via termination-reinitiation in archaea and bacteria. Nat. Commun. 2019;10:1–11. doi: 10.1038/s41467-018-07882-8. - DOI - PMC - PubMed
    1. Yamamoto H, et al. 70S-scanning initiation is a novel and frequent initiation mode of ribosomal translation in bacteria. Proc. Natl Acad. Sci. 2016;113:E1180–E1189. doi: 10.1073/pnas.1524554113. - DOI - PMC - PubMed
    1. Gunišová S, Hronová V, Mohammad MP, Hinnebusch AG, Valášek LS. Please do not recycle! Translation reinitiation in microbes and higher eukaryotes. FEMS Microbiol. Rev. 2018;42:165–192. doi: 10.1093/femsre/fux059. - DOI - PMC - PubMed
    1. Levin-Karp A, et al. Quantifying translational coupling in E. coli synthetic operons using RBS modulation and fluorescent reporters. ACS Synth. Biol. 2013;2:327–336. doi: 10.1021/sb400002n. - DOI - PubMed

Publication types

MeSH terms

LinkOut - more resources