. 2020 Sep 24;10(1):15613.
doi: 10.1038/s41598-020-72391-y.

Yeast Ppz1 protein phosphatase toxicity involves the alteration of multiple cellular targets

Affiliations

Yeast Ppz1 protein phosphatase toxicity involves the alteration of multiple cellular targets

Diego Velázquez et al. Sci Rep. .

Abstract

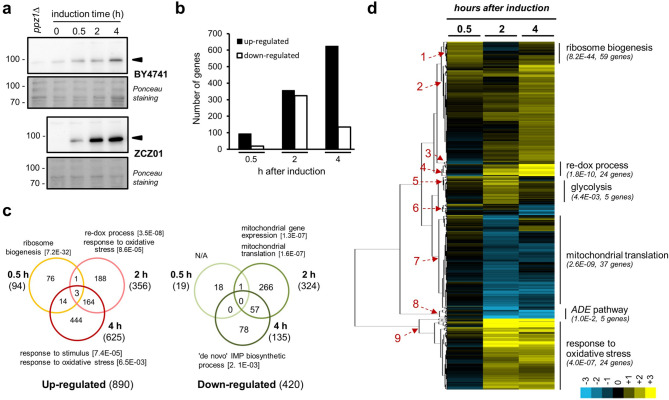
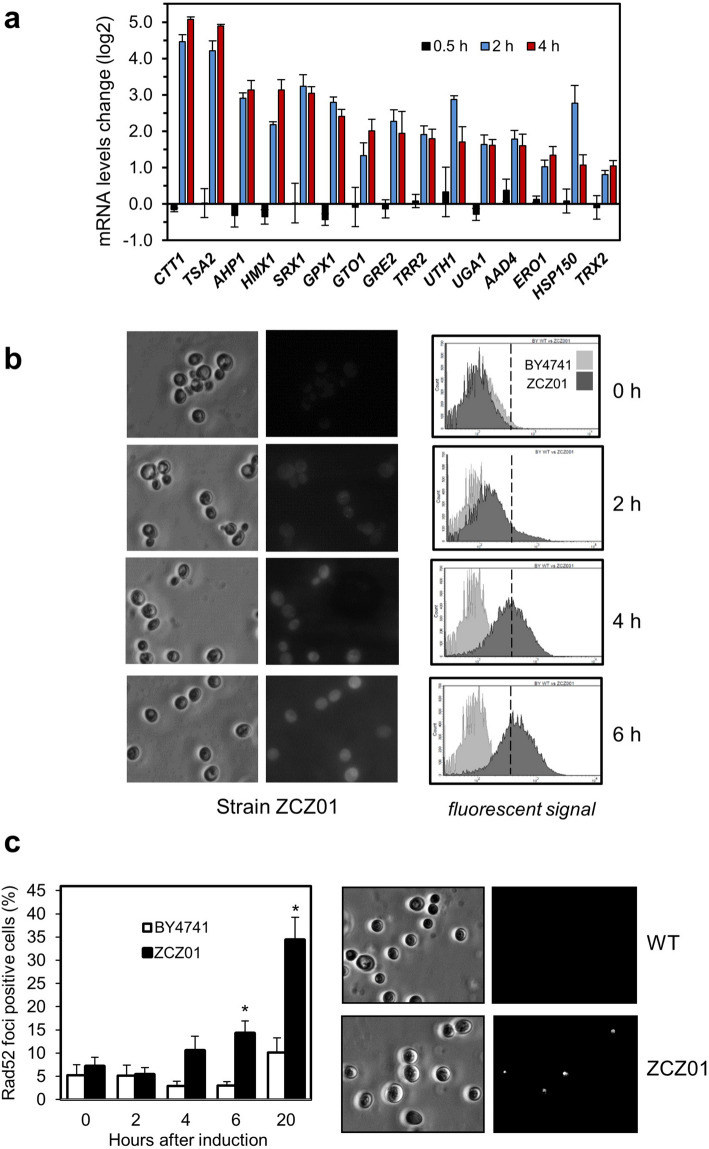
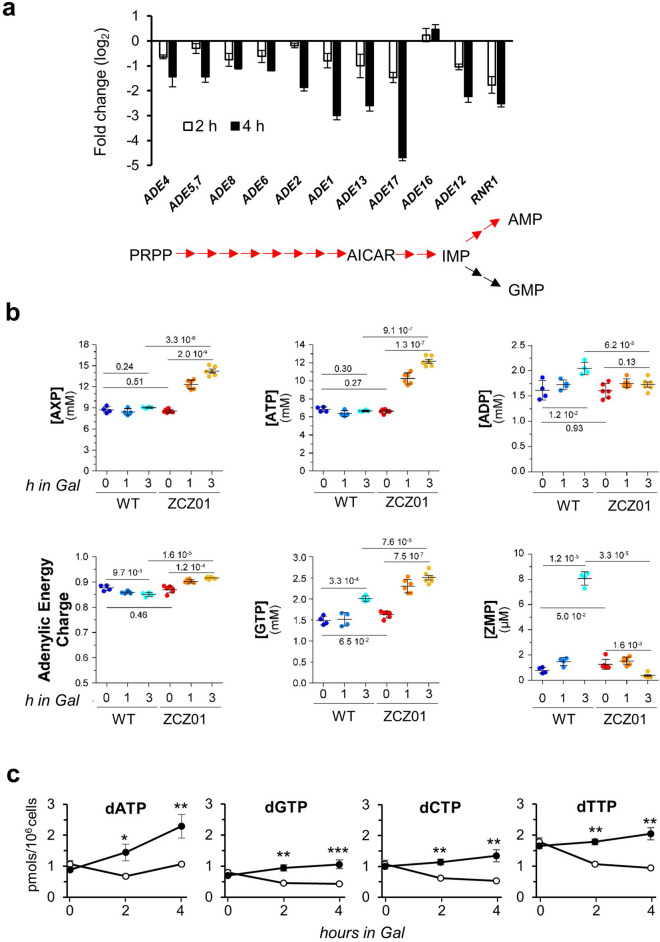
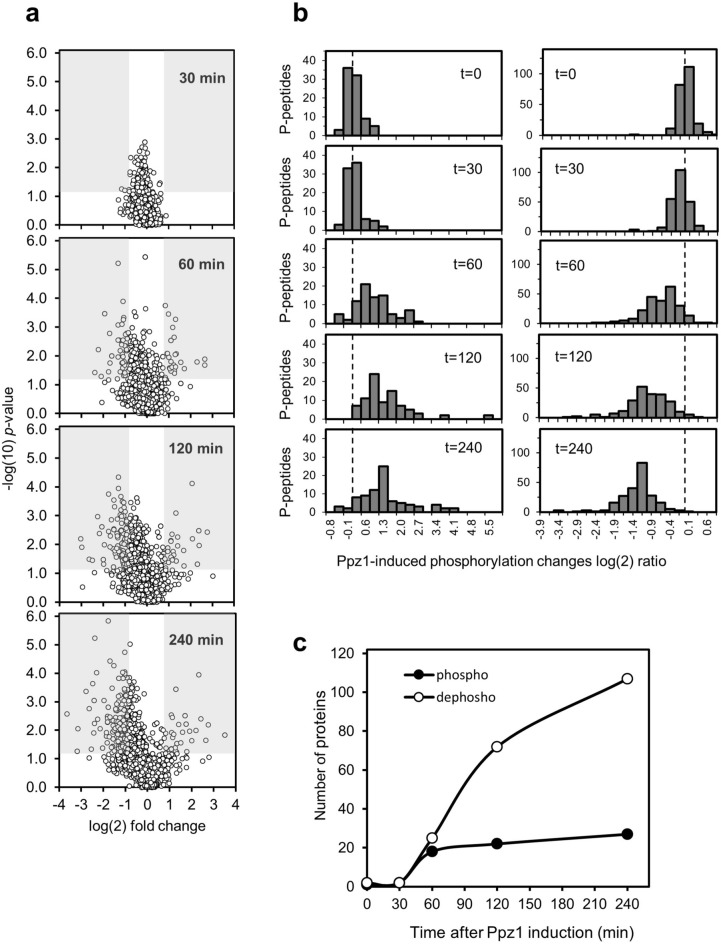
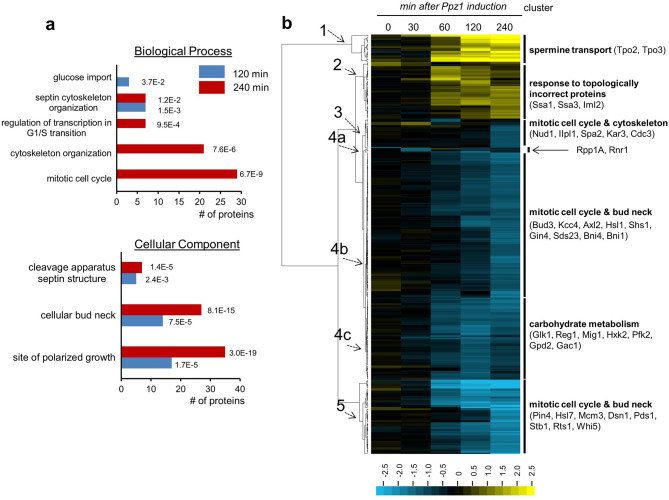
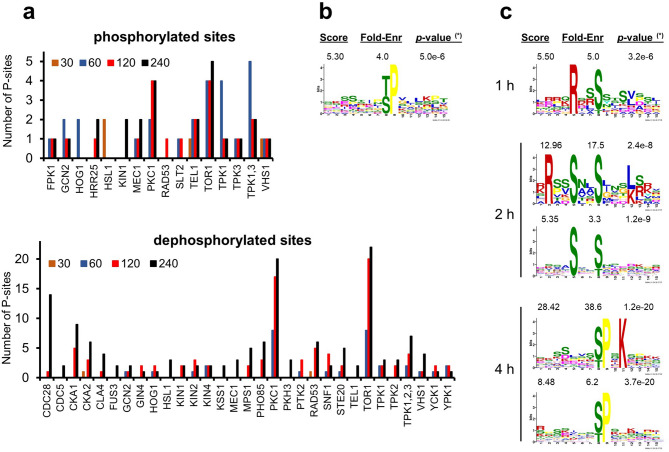
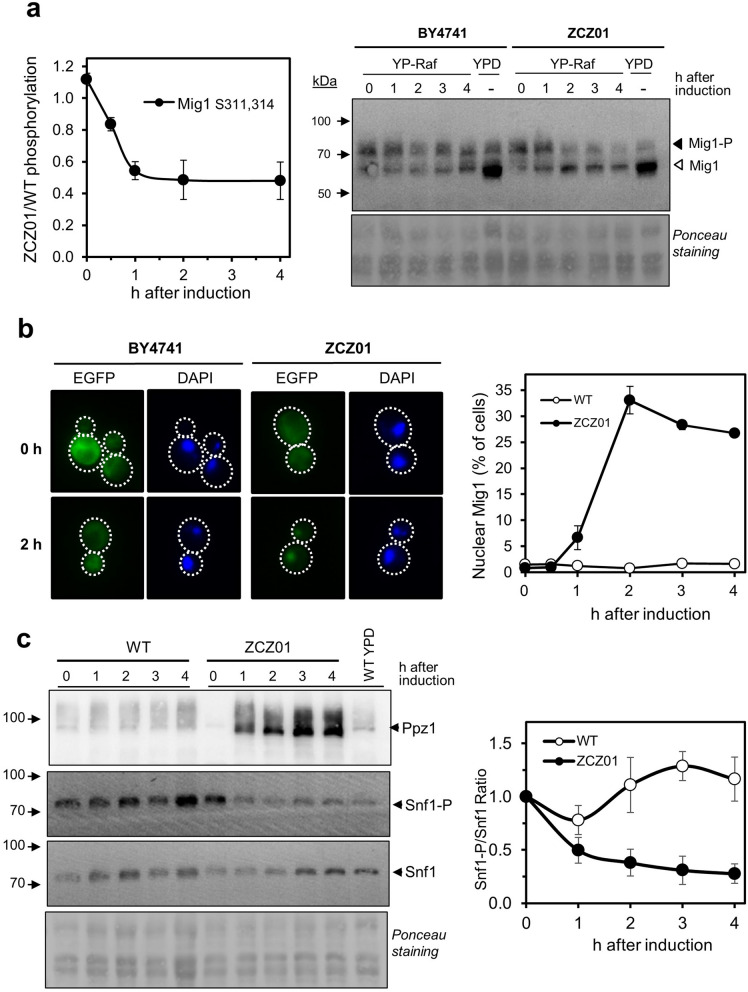
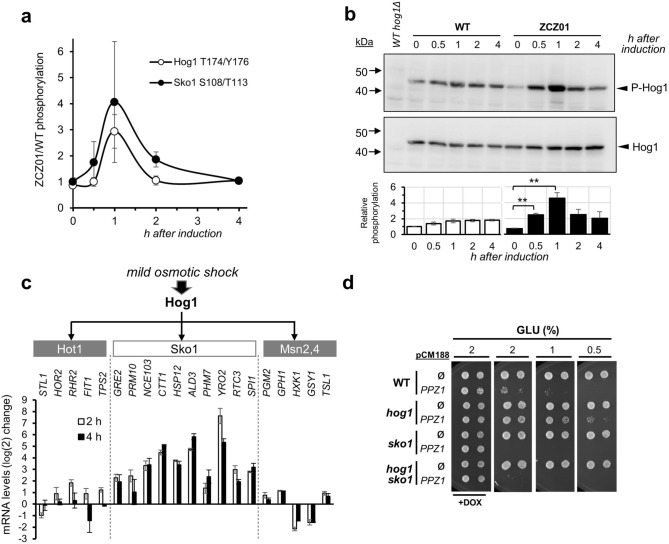
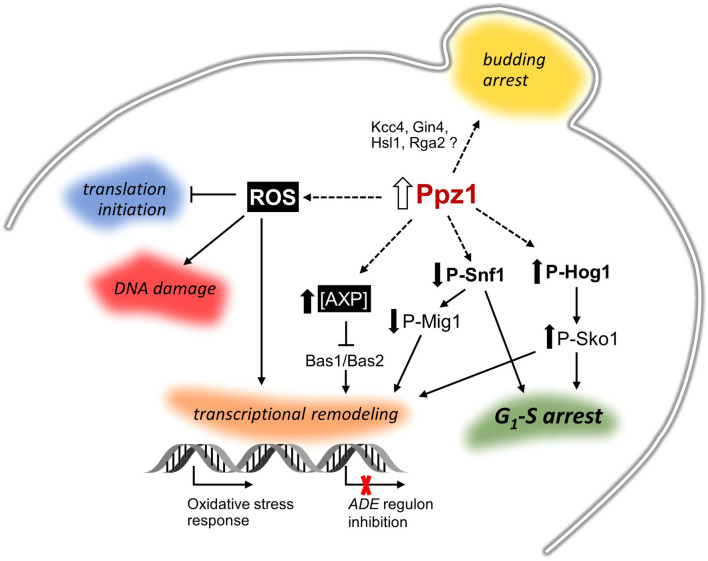
Control of the protein phosphorylation status is a major mechanism for regulation of cellular processes, and its alteration often lead to functional disorders. Ppz1, a protein phosphatase only found in fungi, is the most toxic protein when overexpressed in Saccharomyces cerevisiae. To investigate the molecular basis of this phenomenon, we carried out combined genome-wide transcriptomic and phosphoproteomic analyses. We have found that Ppz1 overexpression causes major changes in gene expression, affecting ~ 20% of the genome, together with oxidative stress and increase in total adenylate pools. Concurrently, we observe changes in the phosphorylation pattern of near 400 proteins (mainly dephosphorylated), including many proteins involved in mitotic cell cycle and bud emergence, rapid dephosphorylation of Snf1 and its downstream transcription factor Mig1, and phosphorylation of Hog1 and its downstream transcription factor Sko1. Deletion of HOG1 attenuates the growth defect of Ppz1-overexpressing cells, while that of SKO1 aggravates it. Our results demonstrate that Ppz1 overexpression has a widespread impact in the yeast cells and reveals new aspects of the regulation of the cell cycle.


Conflict of interest statement

The authors declare no competing interests.

Figures

Figure 1
Figure 1
Changes in transcriptomic profile upon overexpression of PPZ1. (a) Wild-type BY4741 and its isogenic derivative ZCZ01 (GAL1-10:PPZ1) cells were grown on YP with 2% raffinose (YP-Raff) until OD600 = 0.5 and then 2% galactose was added. Samples were taken at the indicated times, electrophoresed (40 μg of protein) and immunoblotted using polyclonal anti-Ppz1 antibodies. Extract from a ppz1Δ deletant is included as negative control. Arrowheads denote Ppz1 signal. Ponceau staining is shown for loading and transfer reference. All samples were loaded in the same gel and are shown separated for illustrative purposes. (b) Time-course distribution of up- and down-regulated genes. (c) Venn diagrams showing the number of genes whose expression was induced or repressed (≥ twofold, p < 0.05) at different times upon overexpression of PPZ1. Total numbers of genes in each category are in parentheses. Gene Ontology annotations, generated by YeastMine at SGD (https://yeastmine.yeastgenome.org/) with default settings, are also shown (p-values are in brackets). (d) Expression changes for 1,294 genes showing induction or repression at least at one time-point (mean values) were subjected to hierarchic clustering (Euclidean distance/complete linkage) using the Gene Cluster software v. 3.0. The result was visualized with Java Tree View v. 1.145. Nine major cluster were obtained and the specific GO enrichment for several of them, including p-value and number of genes belonging to the specific category, is shown in parentheses. The intensity of the expression change can be inferred by comparison with the enclosed scale (log(2) values).
Figure 2
Figure 2
Overexpression of Ppz1 causes oxidative stress and signals through Rad52. (a) Changes in mRNA levels for selected genes calculated from RNA-seq data (log2 of ZCZ01/WT ratio). Values are mean ± SEM from 3 experiments. (b) Cells grown on YP raffinose received 2% galactose to induce expression of Ppz1 and, at the same time, were loaded with dihydrorhodamine 123. Samples were taken at the indicated times and subjected to fluorescence microscopy (left panel) or processed for flow cytometry (right panel). The presence of ROS oxidizes dihydrorhodamine 123 to the fluorescent derivative rhodamine 123. Only the ZCZ01 strain is shown since wild type BY4741 cells produced no fluorescence at any time tested. c) The indicated strains were transformed with plasmid pWJ1344, which expressed an YFP-tagged version of Rad52. Upon growth on 2% raffinose, cells were shifted to 2% galactose. Samples were taken at different times and the percentage of cells positive for Rad52 foci was estimated. Data is presented as the mean ± SEM from four experiments (average 160–430 counted cells per experiment and time point). A representative micrograph taken after 20 h is shown on the right.
Figure 3
Figure 3
Overexpression of Ppz1 increases energetically charged purine nucleotide levels. (a) Expression levels of genes that define the de novo purine biosynthetic pathway derived from the RNA-seq data (ordered according to their sequence in the pathway, schematically shown at the bottom of the histogram). RNR1, encoding the large subunit of ribonucleotide reductase, is also included. (b) The intracellular concentrations of the indicated purine-containing molecules were determined in exponentially growing cells in YP-Raff (2%) with addition of galactose 2% (Gal) at time 0. Metabolic extracts were normalized to cell number and median cell volume and results (from 4 to 6 independent extractions) are given as internal concentrations ± SD of adenylic nucleotides inferred from standard curves using pure compounds. Statistical analysis was performed with Welch’s unpaired t-test (p-values are indicated in the graphs). The concentration of AXP is the sum of the concentrations of ATP, ADP, and AMP. ZMP (AICAR monosphosphate) is the 5-aminoimidazole-4-carboxamide ribonucleotide intermediate. (c) Determination of dNTPs levels in wild type (open circle, BY4741), and Ppz1-overexpressing (filled circle, ZCZ01) cells. Cells grown on YP-Raff were collected at time 0 and 2 and 4 h after addition of 2% galactose and processed as described in Material and Methods. Data correspond to the mean ± SEM from 3 to 5 independent experiments. *p < 0.05; **p < 0.01; ***p < 0.001, calculated by the Student’s t-test.
Figure 4
Figure 4
Changes with time in phosphorylation profile upon overexpression of Ppz1. (a) The significance versus fold-change in phosphorylation (y and x axes, respectively) of the 6,008 unique phosphosites identified in this work and their variation along time with overexpression of Ppz1 is represented as a Volcano plot. Fold-change is calculated as the ratio of Ppz1-overexpressing cells vs control cells, for each time and compared with t = 0. Shadows denote regions in which log(2) value of the change is ≥ 1 (phosphorylated) or ≤ − 1 (dephosphorylated), and p-value ≤ 0.05. (b) Data for a total number of 230 dephosphorylated (right panel) and 85 phosphorylated phosphopeptides (left panel) showing statistically significant changes at least at one time-point was log(2) transformed and plotted. The discontinuous line marks the zero point in the X-axis. (c) Variation of the number of phospho- (filled circle) and dephosphorylated (open circle) proteins along the experiment.
Figure 5
Figure 5
Clustering analysis of phosphoproteome changes upon Ppz1 overexpression. (a) The set of proteins dephosphorylated at t = 120 and t = 240 (72 and 107, respectively) were subjected to Gene Ontology analysis using the YeastMine tool at SGD with default settings. (b) Data from 385 phosphosites (phospho- or dephosphorylated) was calculated as the ratio between Ppz1-overexpressing cells and control cells. Log(2) transformed data was clustered with the Gene Cluster software (Euclidean distance/complete linkage) and the result was visualized with Java Tree View (v. 1.145). The intensity of the phosphorylation change can be deduced by comparison with the enclosed scale (log(2) values). Data is presented for all time-points even if in some cases the p-value between experiments is > 0.05.
Figure 6
Figure 6
Prediction of putative kinases phosphorylating sites affected by Ppz1 overexpression. (a) The set of phosphosites hyperphosphorylated or dephosphorylated at any time upon overexpression of Ppz1 was submitted to the NetworKIN 3.0 high-throughput interface using the yeast Ensemble 74 database (min score = 2). If more than one kinase was assigned to a given site, only the kinase with the highest score was selected. Due to the similarity of Tpk1-3 consensus sites, the sum of all of them is also plotted. For phosphorylated sites, all kinases are shown. For dephosphorylated sites, only kinases with ≥ 2 sites are represented (the full table is available as Supplementary Table S6). (b) Motif enrichment using the MoMo software of phosphorylated sites, as described in Material and Methods. (*) according to the authors, the p-value of the Fisher Exact test on the enrichment of the motif should be interpreted as a score only. “Fold-Enr”, fold enrichment of the foreground matches vs. the background matches. (c) Time-dependent variation of motif enrichment for the dephosphorylated sites. In this case, only sites newly appearing at a given time were submitted to MoMo analysis, to better follow the variation in the motif pattern along the time of Ppz1 overexpression.
Figure 7
Figure 7
Dephosphorylation of Mig1 and Snf1 upon overexpression of Ppz1. (a) Left panel. Changes in phosphorylation of Mig1 at residues Ser311, 314 derived from the phosphoproteomic experiments. Data represent the mean ± SEM from 4 experiments. Right panel. Cells expressing a HA-tagged version of Mig1 were exposed to Ppz1 inducing conditions and the mobility of Mig1 monitored by SDS-PAGE (10% polyacrylamide) of protein extracts (40 µg of proteins) followed by immunoblot with anti-HA antibodies. Ponceau staining of the membrane is shown for comparison of loading and transfer efficiency. (b) Wild type (BY4741) and ZCZ01 cells were transformed with an episomal plasmid bearing a GFP-tagged version of Mig1. Cultures were treated for Ppz1 induction as described in Material and Methods. Cells were collected at different times, stained with DAPI to reveal the position of the nucleus, and observed in a fluorescence microscope. The graph on the right shows the abundance of cells (as %) in which Mig1 was retained in the nucleus. Data are the mean ± SEM (n = 3) from an average of 167 to 426 cells counted per experiment. (c) Changes in Snf1 phosphorylation induced by Ppz1 overexpression. Left panel. BY4741 (WT) and ZCZ01 cells were treated as in panel A and protein extracts electrophoresed, transferred to membranes and probed with anti-Ppz1, anti-AMPK-PT172 (Snf1-P), or anti-polyHis (Snf1) antibodies. Right panel. Quantification of the P-Snf1/Snf1 ratio by integration of the signals from three independent experiments. The result for the wild type strain at time = 0 is defined as the unit and the mean ± SEM is represented.
Figure 8
Figure 8
Hog1 and Sko1 mediate part of the signals elicited by overexpression of Ppz1. (a) Changes in phosphorylation of Hog1 (Thr174/Tyr176) and Sko1 (Ser108/Thr113) derived from the phosphoproteomic experiments. Data represent the mean ± SEM from two (Hog1) and four (Sko1) datasets. (b) Upper panel. BY4741 (WT) and ZCZ01 cultures in YP-Raff received 2% galactose to promote Ppz1 induction. Protein extracts (40 µg of proteins) were subjected to SDS-PAGE (10% polyacrylamide), transferred to membranes and immunoblotted with anti P-Hog1 (P-Thr174/Tyr176) antibodies. Upon detection, membranes were stripped and probed with anti Hog1 antibodies to detect the amount of total Hog1. Lower panel. Signals corresponding to P-Hog1 and Hog1 were integrated and the P-Hog1/Hog1 ratio calculated for each time point. The values from three independent experiments were combined and the result for the WT strain at time = 0 was taken as the unit. Data is expressed as mean ± SEM (n = 3). **p < 0.01 calculated by the Student’s t-test. (c) Twenty representative genes proposed to be induced by Hog1 activation (exposure to 0.375 M KCl) mainly due to involvement of the Hot1, Sko1 and Mns2/4 downstream components were selected based on data from Supplementary Table S2 and the corresponding GEO entry (accession number GSE1227). The change in expression for these genes after 2 and 4 h upon induction of Ppz1 is plotted as the mean ± SEM (n = 3). (d) The indicated strains in the BY4741 background (WT) were transformed with plasmid pCM188-PPZ1. Overnight cultures were grown in SC medium lacking uracil with 100 µg/ml of doxycycline, washed twice with the same medium lacking doxycycline, resuspended in this medium and grown for five hours before spotting in plates with (+ DOX) or without doxycycline and containing the indicated amounts of glucose as carbon source. Pictures were taken after 3 days.
Figure 9
Figure 9
Cartoon depicting major effects of Ppz1 overexpression discussed in this work. Discontinuous lines denote uncertainty about the precise mechanism leading to the indicated effect.

Similar articles

Cited by

References

    1. Posas F, Casamayor A, Morral N, Ariño J. Molecular cloning and analysis of a yeast protein phosphatase with an unusual amino-terminal region. J. Biol. Chem. 1992;267:11734–11740. - PubMed
    1. Posas F, Casamayor A, Ariño J. The PPZ protein phosphatases are involved in the maintenance of osmotic stability of yeast cells. FEBS Lett. 1993;318:282–286. doi: 10.1016/0014-5793(93)80529-4. - DOI - PubMed
    1. Lee KS, Hines LK, Levin DE. A pair of functionally redundant yeast genes (PPZ1 and PPZ2) encoding type 1-related protein phosphatases function within the PKC1-mediated pathway. Mol. Cell Biol. 1993;13:5843–5853. doi: 10.1128/MCB.13.9.5843. - DOI - PMC - PubMed
    1. Ariño J, Velázquez D, Casamayor A. Ser/Thr protein phosphatases in fungi: structure, regulation and function. Microb. Cell. 2019;6:217–256. doi: 10.15698/mic2019.05.677. - DOI - PMC - PubMed
    1. Ariño J. Novel protein phosphatases in yeast. Eur. J. Biochem. 2002;269:1072–1077. doi: 10.1046/j.0014-2956.2002.02753.x. - DOI - PubMed

Publication types

MeSH terms

Substances