. 2020 Sep 24;10(1):15686.
doi: 10.1038/s41598-020-72610-6.

Ontogeny of different subsets of yellow fever virus-specific circulatory CXCR5+ CD4+ T cells after yellow fever vaccination

Affiliations

Ontogeny of different subsets of yellow fever virus-specific circulatory CXCR5+ CD4+ T cells after yellow fever vaccination

Quinn DeGottardi et al. Sci Rep. .

Abstract

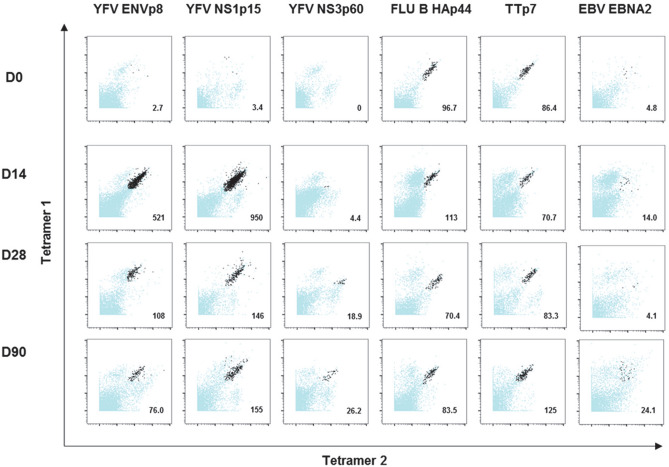
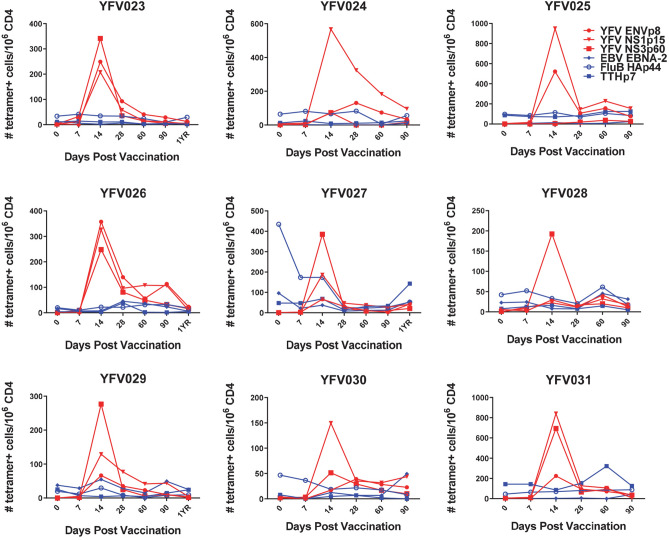
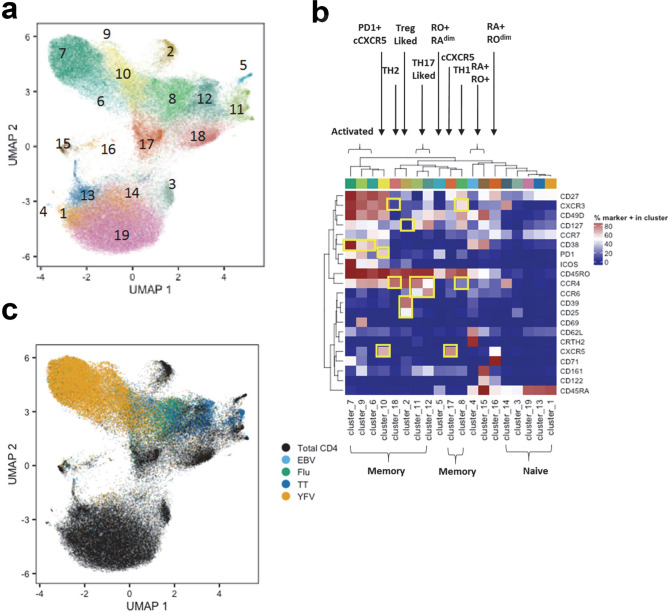
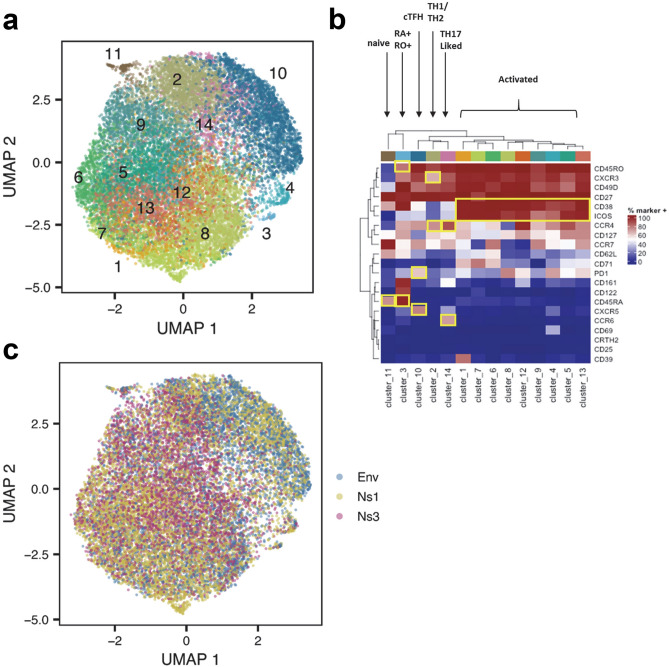
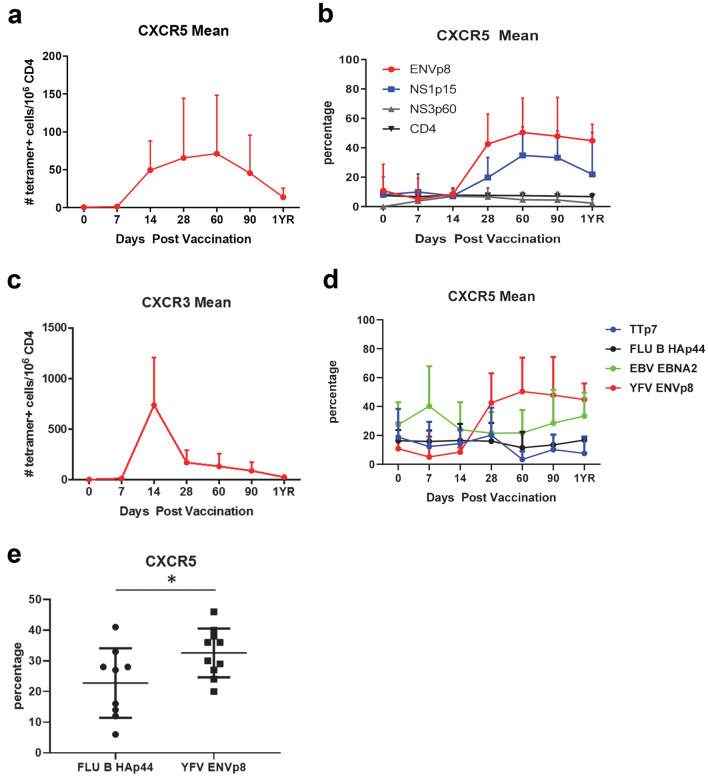
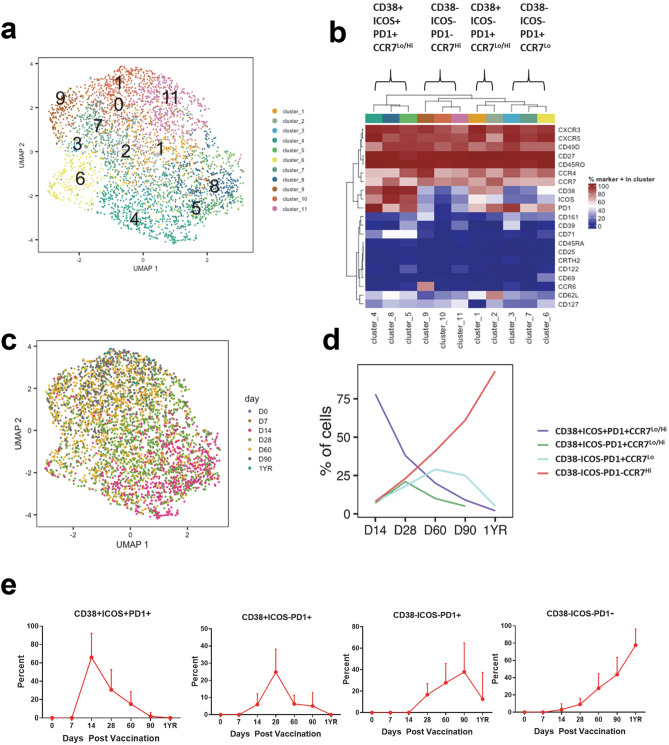
Monitoring the frequency of circulatory CXCR5+ (cCXCR5+) CD4+ T cells in periphery blood provides a potential biomarker to draw inferences about T follicular helper (TFH) activity within germinal center. However, cCXCR5+ T cells are highly heterogeneous in their expression of ICOS, PD1 and CD38 and the relationship between different cCXCR5 subsets as delineated by these markers remains unclear. We applied class II tetramer reagents and mass cytometry to investigate the ontogeny of different subsets of cCXCR5+ T cell following yellow fever immunization. Through unsupervised analyses of mass cytometry data, we show yellow fever virus-specific cCXCR5 T cells elicited by vaccination were initially CD38+ICOS+PD1+, but then transitioned to become CD38+ICOS-PD1+ and CD38-ICOS-PD1+ before coming to rest as a CD38-ICOS-PD1- subset. These results imply that most antigen-specific cCXCR5+ T cells, including the CD38-ICOS-PD1- CXCR5+ T cells are derived from the CXCR5+CD38+ICOS+PD1+ subset, the subset that most resembles preTFH/TFH in the germinal center.


Conflict of interest statement

The authors declare no competing interests.

Figures

Figure 1
Figure 1
Combinatorial ex vivo class II tetramers staining of YFV-specific, TT-specific, FLU B-specific, EBV-specific CD4+ T cells at 4 different time points. Combinatorial tetramer staining was carried out in PBMCs from the same subject at day 0 (pre-vaccination) and day 14, 28 and 90 post YF-Vax vaccination. Tetramer for each epitope specificity was conjugated to two different metal tags as show in Table S1. Staining for specific T cells of different epitope specificities at each time point was carried out in a single tube. Dark dots represent epitope specific cells and blue dots represent other CD4+ T cells. Frequencies of epitope specific CD4+ T cell per million CD4+ T cells are as indicated.
Figure 2
Figure 2
Kinetics of YFV-specific, TT-specific, FLU B-specific, EBV-specific CD4+ T cell responses post YF-Vax vaccination. PBMC from nine DRB1*0301 subjects were stained with 3 different YFV-specific tetramers, TT-specific, FLU B-specific and EBV-specific tetramers and a panel of 28 different antibodies as listed in Tables S1 and S2. Frequencies of CD45RO+ YFV ENV-specific, YFV NS-1-specific, YFV NS3-specific, TT, FLU B HA-specific and EBV EBNA2-specific CD4+ T cells of nine different subjects at different time points post YFV-Vax vaccination are shown.
Figure 3
Figure 3
Cellular clustering of total CD4+ T cells and epitope specific CD4+ T cells pre and post YF-Vax vaccination. (a) UMAP was applied for visualization of the high dimensional CyTOF data set which examines the surface expression of 21 different markers in CD4+ T cells. Marker intensities were arcsinh transformed before further data analysis. To adjust for batch differences between samples, a z-score normalization was applied to each marker relative to the total CD4 T cell expression for that marker on the same subject and visit prior to dimensionality reduction using UMAP. Clustering was performed with a total of 82,811 CD4+ T cells from all 9 subjects at all time points assayed (a total of 58 samples), including 17,851 YFV-specific, 1280 EBV-specific, 2913 FLU-specific, 2767 TT-specific CD4+ T cells and from 58,000 non-YFV, non-EBV, non-FLU, and non-TT CD4+ T cells (1000 cells from each subject at each time point). PhenoGraph defined a total of 19 different clusters as indicated. (b) Heatmap of the surface marker expression levels of cells within these 19 clusters with percentage of cells that are positive for each marker. Surface markers that are used to define the dominant T cell subset for each cluster are boxed. (c) Distribution of total CD4+ T cells, YFV-specific, EBV- specific, FLU B-specific and TT-specific T cells in UMAP.
Figure 4
Figure 4
Cellular clustering of YFV epitope-specific CD4+ T cells pre and post YF-Vax vaccination. (a) UMAP and PhenoGraph analysis of surface marker expression of YFV ENV-specific, YFV NS1-specific, YFV NS3- specific CD4+ T cells for all 9 subjects at all time points (n = 58). A total of 5246 YFV ENV-specific, 8005 YFV NS1- specific and 4600 YFV NS3-specific cells as identified by YFV-specific tetramer staining were included in the analysis. PhenoGraph defined a total of 11 different clusters. (b) Heatmap of the surface marker expression level of cells within these 11 clusters with percentage of cells that were positive for each marker. Markers that are used to define T cell subsets or activation state are boxed. (c) Distribution of YFV ENV-specific, YFV NS1-specific and YFV NS3-specific CD4+ T cells in UMAP.
Figure 5
Figure 5
Kinetics of CXCR3+ and cCXCR5+CD4+ T cells post YF-Vax vaccination. (a) Average frequencies of YFV-specific cCXCR5+CD4+ at different time points post YF-Vax vaccination (average of summation of ENV, NS1, NS3 at each time point for each subject from a total of 9 subjects). (b) Percentage of total CD4+ T cells, YFV ENV-specific, YFV NS1-specific and YFV NS3-specific that were CXCR5+ at different time points post vaccination. (c) Frequencies of YFV-specific CXCR3+CD4+ at different time points post YF-Vax vaccination. (d) Percentage of YFV ENV-specific, TT-specific, EBV-specific and FLU B-specific CD4+ T cells that were CXCR5+ at different time points post vaccination. For a and c, n = 27 for the first 6 time point and n = 12 for the last time point. For b and d, n = 9 for each epitope for the first 6 time point and n = 4 for the last time point. (e) Percentage of CXCR5+ YFV ENV-specific cells (n = 10) at day 30 post YFV-Vax vaccination and percentage of FLU B HA-specific cells (n = 9) at day 30 post FLU vaccination. Shown are the means with SD. For e, unpaired 2 tailed Student’s t test was used, *indicates p value of < 0.05.
Figure 6
Figure 6
Cellular clustering of YFV-specific cCXCR5+ CD4+ T cells pre and post YF-Vax vaccination. (a) UMAP and PhenoGraph analysis of surface marker expression of YFV-specific cCXCR5+CD4+ T cells for all 9 subjects at all time points (n = 58). Only CXCR5+ YFV tetramer specific cells were included in the analysis. PhenoGraph defined a total of 11 different clusters. (b) Heatmap of hierarchical clustering of surface marker expression of these 11 clusters with percentage of cells that were positive for each marker. These 11 clusters were grouped by similarity into 4 different cCXCR5+ subsets. (c) Distribution of cCXCR5 + YFV -specific CD4+ T cells at different time point in UMAP. (d) Kinetics of the four different YFV-specific cCXCR5+CD4+ subsets as identified by UMAP and PhenoGraph. (e) Manual gating was used to identify different subsets of YFV ENV-specific cCXCR5+CD4+. Percentages of YFV ENV-specific cCXCR5+ T cells that expressed the indicated markers at different time points are as shown.

References

    1. Cosmi L, Maggi L, Santarlasci V, Liotta F, Annunziato F. T helper cells plasticity in inflammation. Cytom. A. 2014;85:36–42. doi: 10.1002/cyto.a.22348. - DOI - PubMed
    1. Vinuesa CG, Linterman MA, Yu D, MacLennan IC. Follicular helper T cells. Annu. Rev. Immunol. 2016;34:335–368. doi: 10.1146/annurev-immunol-041015-055605. - DOI - PubMed
    1. Song W, Craft J. T follicular helper cell heterogeneity: time, space, and function. Immunol. Rev. 2019;288:85–96. doi: 10.1111/imr.12740. - DOI - PMC - PubMed
    1. Crotty S. T follicular helper cell biology: a decade of discovery and diseases. Immunity. 2019;50:1132–1148. doi: 10.1016/j.immuni.2019.04.011. - DOI - PMC - PubMed
    1. Schaerli P, et al. CXC chemokine receptor 5 expression defines follicular homing T cells with B cell helper function. J. Exp. Med. 2000;192:1553–1562. doi: 10.1084/jem.192.11.1553. - DOI - PMC - PubMed

Publication types

MeSH terms