. 2020 Sep 24;10(1):15664.
doi: 10.1038/s41598-020-72564-9.

Spatial mapping of the collagen distribution in human and mouse tissues by force volume atomic force microscopy

Affiliations

Spatial mapping of the collagen distribution in human and mouse tissues by force volume atomic force microscopy

Annalisa Calò et al. Sci Rep. .

Abstract

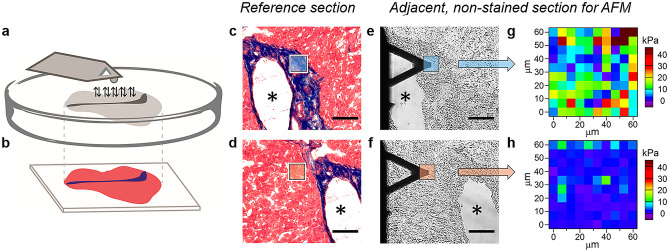
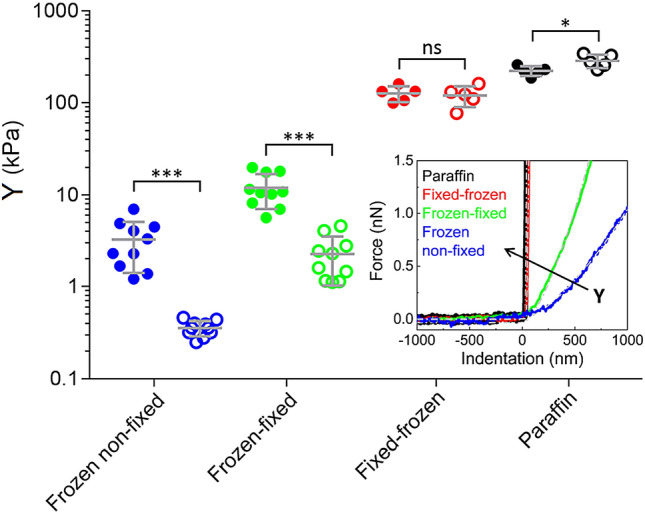
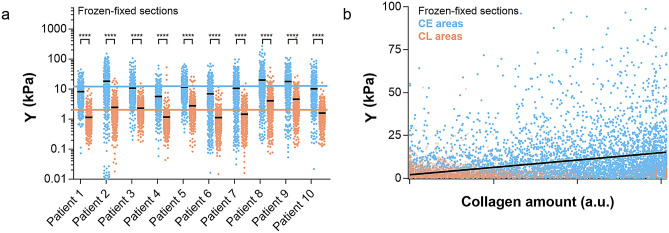
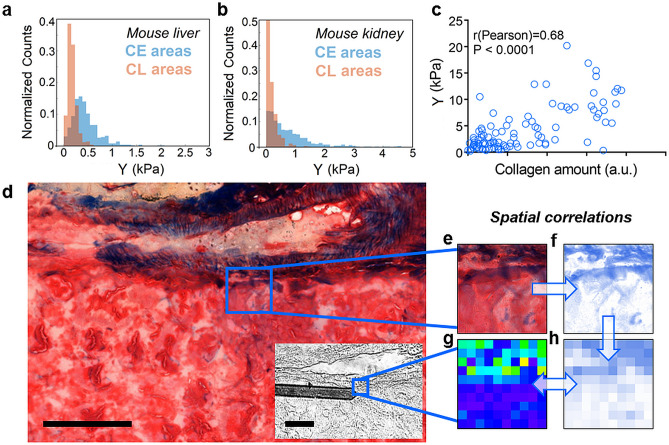
Changes in the elastic properties of living tissues during normal development and in pathological processes are often due to modifications of the collagen component of the extracellular matrix at various length scales. Force volume AFM can precisely capture the mechanical properties of biological samples with force sensitivity and spatial resolution. The integration of AFM data with data of the molecular composition contributes to understanding the interplay between tissue biochemistry, organization and function. The detection of micrometer-size, heterogeneous domains at different elastic moduli in tissue sections by AFM has remained elusive so far, due to the lack of correlations with histological, optical and biochemical assessments. In this work, force volume AFM is used to identify collagen-enriched domains, naturally present in human and mouse tissues, by their elastic modulus. Collagen identification is obtained in a robust way and affordable timescales, through an optimal design of the sample preparation method and AFM parameters for faster scan with micrometer resolution. The choice of a separate reference sample stained for collagen allows correlating elastic modulus with collagen amount and position with high statistical significance. The proposed preparation method ensures safe handling of the tissue sections guarantees the preservation of their micromechanical characteristics over time and makes it much easier to perform correlation experiments with different biomarkers independently.


Conflict of interest statement

The authors declare no competing interests.

Figures

Figure 1
Figure 1
Design of the force volume AFM experiment. (a, b) Schematic drawing showing the two adjacent sections, the Masson’s trichrome stained and the non-stained section, and the AFM probe. (c, d), Histological staining of a human liver tissue section, obtained from a patient with colon cancer (patient #9) (scale bar: 100 μm). In (c, d), areas of the tissue with low collagen (CL) (red) and enriched collagen (CE) content (blue) are shown. (e, f), Bright field images of the same areas as (c) and (d) in the adjacent, non-stained section, which has been excised 10 μm far from the stained section (scale bar: 100 μm). The two adjacent sections exhibit similar features, as indicated by the asterisks in the lumen of a large blood vessel in (cf). Images in (e, f) are obtained during the force volume AFM measurements, using the inverted optical microscope integrated with the AFM system. (g, h), Elastic modulus maps of a CE area (g) and a CL area (h), approximately corresponding to the region highlighted in blue in (c, e) and in orange in (d, f), respectively (maps size: 60 × 60 μm2, pixel size: 6 × 6 μm2).
Figure 2
Figure 2
Effect of the preparation method on the elastic modulus of tissue sections. Elastic modulus of CE areas (solid circles) and CL areas (open circles) for each patient in different preparation methods (N = 10 for frozen non-fixed sections and for frozen-fixed sections, represented as blue and green circles, respectively. N = 5 for fixed-frozen sections and for paraffin sections, represented as red and black circles, respectively). Each data point in the graph is an average value for patient, obtained from sampling 5 CE and 5 CL locations with 10 × 10 pixel maps each. Overlapped is the pooled mean with uniform samples and standard deviation. CE locations showed higher elastic modulus in frozen non-fixed and frozen-fixed samples (P < 0.001), CE and CL locations showed not significantly different Young’s modulus in fixed-frozen samples (P > 0.05) and CL locations showed higher Young’s modulus than CE locations in paraffin samples (P < 0.05). Inset. Representative force vs. indentation curves in CL locations for each preparation method. Curves belong to patient #6. The elastic modulus of differently processed tissues, extracted according to the Hertz model, follows the trend: Yfrozen non-fixed sections < Yfrozen-fixed sections < Yfixed-frozen sections < Yparaffin sections. The arrow shows the direction of increasing Young’s modulus.
Figure 3
Figure 3
Force volume AFM of frozen-fixed sections from human liver. (a) Reference Masson’s trichrome-stained section of patient #3 (scale bar: 1 mm). (b, c) (top panels), bright field optical images of the non-stained section, collected during the force volume experiment, corresponding to regions of interest for the CE component (b, top panel) and for the CL component (c, top panel) of the section, respectively. All 10 regions of interest are highlighted in (a). Scale bar for all the images is 100 μm. (b, c) (bottom panels) Set of elastic modulus maps (60 × 60 μm2, 10 × 10 pixels) from CE (b, bottom panel) and CL areas (c, bottom panel). The approximate position of the maps is highlighted in blue and orange in (b and c) (top panels), respectively. (d) Distribution histogram of the elastic modulus values plotted separately for CE (N = 500) and CL (N = 500) areas.
Figure 4
Figure 4
Correlation between elastic modulus and collagen amount. (a) Elastic modulus values for each patient, plotted separately for CE and CL, with average values (in black). For better visualization, data are shown in logarithmic scale (8 data points are outside the y axis limits). Pooled mean with uniform samples among all patients is also shown in the graph (10.9 kPa for CE, blue line and 2.0 kPa for CL, orange line). Difference between CE and CL elastic modulus was found to be significant for each patient (P < 0.0001) and for the all the patients combined (P < 0.001, see Fig. 2). (b) Correlation between elastic modulus and collagen amount, i.e. the blue intensity in the stained sections, (rPearson = 0.33, P < 0.0001). The linear fit, shown as a black line in (b), includes all CE and CL data as a single population.
Figure 5
Figure 5
Elastic modulus of frozen-fixed mouse tissue sections and spatial correlations. (a, b) Young’s modulus distribution histograms of frozen-fixed tissue sections from mouse liver (a) and mouse kidney (b) plotted separately for CE and CL data (N = 500 for CE and N = 500 for CL). (c) Elastic modulus vs. collagen amount (blue intensity), as obtained by comparing pixel by pixel the tiled map from the histological ROI which gave the highest score in the spatial correlation analysis (rPearson = 0.68, P < 0.0001, N = 100) and the low-resolution elastic modulus map (see images in g, h). (d) Trichrome-stained image (d) and bright field image (d, inset) of the same sample region around a blood vessel in two adjacent sections from mouse kidney (scale bars: 100 mμ). The area where the force map was collected (50 × 50 μm2, 10 × 10 pixels) is highlighted in blue in (d, inset). (e–h) Procedure for spatial correlation analysis (see the main text).

Similar articles

Cited by

References

    1. Lampi MC, Reinhart-King CA. Targeting extracellular matrix stiffness to attenuate disease: From molecular mechanisms to clinical trials. Sci. Transl. Med. 2018;10:eaao0475. doi: 10.1126/scitranslmed.aao0475. - DOI - PubMed
    1. Insua-Rodríguez J, Oskarsson T. The extracellular matrix in breast cancer. Adv. Drug Deliv. Rev. 2016;97:41–55. doi: 10.1016/j.addr.2015.12.017. - DOI - PubMed
    1. Marturano JE, Arena JD, Schiller ZA, Georgakoudi I, Kuo CK. Characterization of mechanical and biochemical properties of developing embryonic tendon. PNAS. 2013;110:6370–6375. doi: 10.1073/pnas.1300135110. - DOI - PMC - PubMed
    1. Plodinec M, et al. The nanomechanical signature of breast cancer. Nat. Nanotechnol. 2012;7:757–765. doi: 10.1038/nnano.2012.167. - DOI - PubMed
    1. Stolz M, et al. Early detection of aging cartilage and osteoarthritis in mice and patient samples using atomic force microscopy. Nat. Nanotechnol. 2009;4:186–192. doi: 10.1038/nnano.2008.410. - DOI - PubMed

Publication types