. 2020 Sep 24;10(1):15644.
doi: 10.1038/s41598-020-72654-8.

Retrospective unbiased plasma lipidomic of progressive multiple sclerosis patients-identifies lipids discriminating those with faster clinical deterioration

Affiliations

Retrospective unbiased plasma lipidomic of progressive multiple sclerosis patients-identifies lipids discriminating those with faster clinical deterioration

Mario Amatruda et al. Sci Rep. .

Abstract

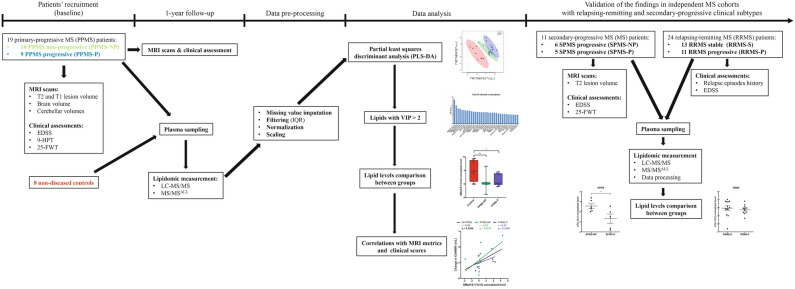
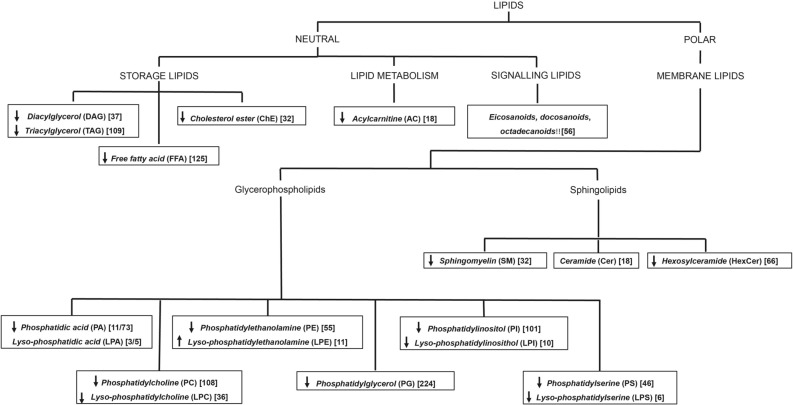
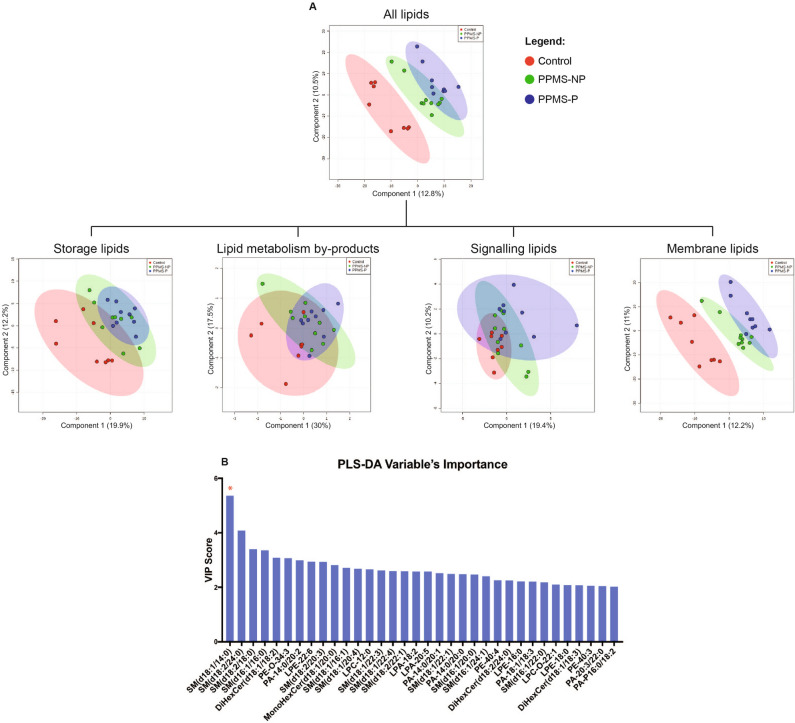
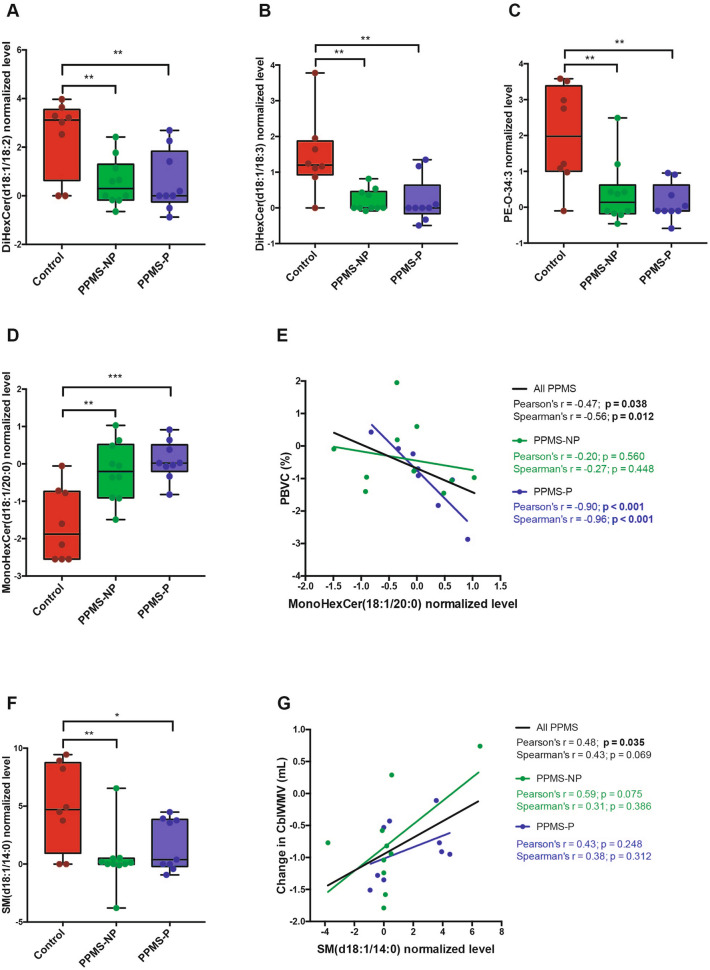
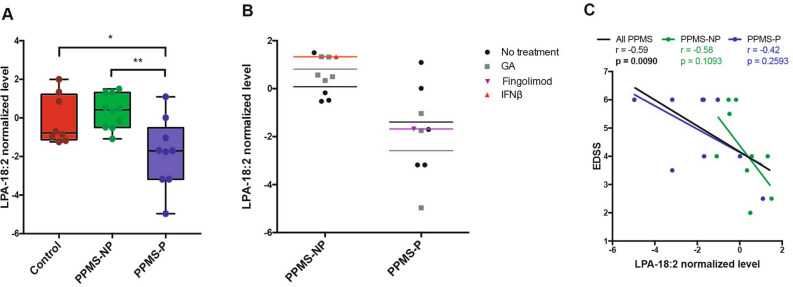
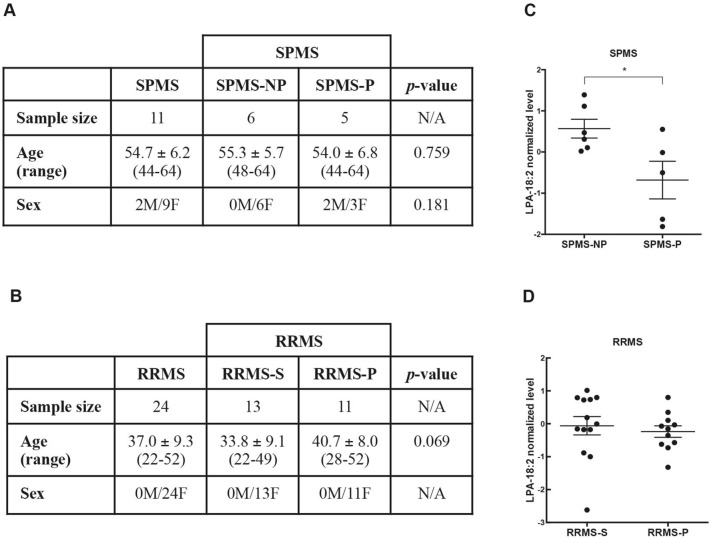
The disease course of patients with a confirmed diagnosis of primary progressive multiple sclerosis (PPMS) is uncertain. In an attempt to identify potential signaling pathways involved in the evolution of the disease, we conducted an exploratory unbiased lipidomic analysis of plasma from non-diseased controls (n = 8) and patients with primary progressive MS (PPMS, n = 19) and either a rapid (PPMS-P, n = 9) or slow (PPMS-NP, n = 10) disease course based on worsening disability and/or MRI-visible appearance of new T2 lesions over a one-year-assessment. Partial least squares-discriminant analysis of the MS/MSALL lipidomic dataset, identified lipids driving the clustering of the groups. Among these lipids, sphingomyelin-d18:1/14:0 and mono-hexosylceramide-d18:1/20:0 were differentially abundant in the plasma of PPMS patients compared to controls and their levels correlated with MRI signs of disease progression. Lyso-phosphatidic acid-18:2 (LPA-18:2) was the only lipid with significantly lower abundance in PPMS patients with a rapidly deteriorating disease course, and its levels inversely correlated with the severity of the neurological deficit. Decreased levels of LPA-18:2 were detected in patients with more rapid disease progression, regardless of therapy and these findings were validated in an independent cohort of secondary progressive (SPMS) patients, but not in a third cohorts of relapsing-remitting (RRMS) patients. Collectively, our analysis suggests that sphingomyelin-d18:1/14:0, mono-hexosylceramide-d18:1/20:0, and LPA-18:2 may represent important targets for future studies aimed at understanding disease progression in MS.


Conflict of interest statement

The authors declare no competing interests.

Figures

Figure 1
Figure 1
Flow chart of study procedures. The figure shows the overall study design. From left to right: recruitment of PPMS patients in the discovery cohort, MRI and clinical assessment at baseline, and MRI evaluation, clinical assessment and plasma collection at the one year follow up. Plasma samples were then subjected to LC–MS/MS and MS/MSALL, followed by lipidomic data pre-processing. The PLS-DA was used to identify lipids driving separations between groups and those with a high VIP score (> 2.0) were evaluated further with statistical tests to identify differentially abundant lipids correlating with rapid disease progression. Two independently collected plasma lipidomic datasets from two distinct cohorts of SPMS and RRMS patients were similarly analyzed to validate the findings in PPMS patients also in the relapsing–remitting and secondary-progressive MS clinical subtypes.
Figure 2
Figure 2
Graph shows the lipid classes detected in the plasma of patients with PPMS and healthy controls. Neutral and polar lipids were measured, and then classified based on their main biological function: storage, signalling, metabolism product, and membrane lipids. 1,068 lipid species, belonging to 15 different lipid classes, were detected in the plasma of PPMS patients. In bold-italic is indicated the name of the lipid class and in round brackets its abbreviation. In square brackets is indicated the total number of lipids detected per each class. Up-facing and down-facing arrows indicates fold-change (PPMS/controls) trends of increased or decreased lipid levels respectively.
Figure 3
Figure 3
PLS-DA discriminates PPMS patients from non-diseased controls based on membrane lipid levels in the plasma. (A) The plots show separation of controls, PPMS-P, and PPMS-NP patients based on the first two components of the partial least square discriminant analysis (PLS-DA). PLS-DA was performed using normalized lipid levels measured in the plasma. Storage, signaling lipids, and lipid metabolism by-products (acyl-carnitines) alone were not able to separate the three groups at the PLS-DA. By contrast, membrane lipids were sufficient to efficiently discriminate patients from controls and PPMS-P from PPMS-NP patients. Control, n = 8; PPMS-NP, n = 10; PPMS-P, n = 9. (B) Graph shows the Variable’s Importance PLS-DA (VIP) scores of lipids that more prominently contributed to the PLS-DA model (VIP > 2). Red asterisk indicates SM(d18:1/14:0), the lipid with the highest VIP score and thus one of the lipids that most contributed to the PLS-DA model.
Figure 4
Figure 4
Lipids differentially abundant in the plasma of PPMS patients compared with controls. (A-D,F) Graphs show normalized levels of differentially abundant lipids in the plasma of healthy controls, PPMS-NP and PPMS-P patients. The levels of (A) Di-hexosylceramide(d18:1/18:2) [DiHexCer(d18:1/18:2)], (B) DiHexCer(d18:1/18:3), (C) phosphatidylethanolamine-O-34:3 (PE-O-34:3), and (F) sphingomyelin SM(d18:1/14:0) were significantly lower in the plasma of PPMS patients compared with controls, while the levels of (C) mono-hexosylceramide(d18:1/20:0) [MonoHexCer(d18:1/20:0)] were significantly higher. Boxes indicate the interquartile range, horizontal lines indicate group medians, whiskers connect the lowest and the highest observations. The statistical analysis was performed using the One-way ANOVA with Dunnet’s multiple comparison test (*p < 0.05, **p < 0.01, ***p < 0.001). Control, n = 8; PPMS-NP, n = 10; PPMS-P, n = 9. (G and F) Graphs show correlations between normalized plasma lipid levels of (E) MonoHexCer(d18:1/20:0) and (G) SM(d18:1/14:0) with changes in MRI metrics at the 1-year follow-up. Changes in MRI volumes were computed as follow-up values minus baseline values. (E) Higher abundance of MonoHexCer(d18:1/20:0) in the plasma of PPMS patients correlated with more severe brain volume loss (calculated as percentage brain volume change, PBVC). (G) Higher levels of SM(d18:1/14:0) correlated with less severe loss of CblWMV. Lines represent the linear regressions of all patients (black), PPMS-NP (green), and PPMS-P (blue) subgroups. Correlations were assessed using both the Pearson and Spearman methods. R-coefficient (r) and p-values (p) are indicated in black for the entire PPMS population, in green and blue for the PPMS-NP and PPMS-P group respectively. P < 0.05 (in bold) was considered significant. PPMS-NP, n = 10; PPMS-P, n = 9.
Figure 5
Figure 5
The lower plasma levels of LPA 18:2 in PPMS-P patients compared to PPMS-NP, are detected independently of the use of immunomodulatory drugs and correlate with severe neurological deficits. (A) Graph shows normalized levels of lysophosphatidic acid 18:2 (LPA-18:2) in the plasma of PPMS-NP and PPMS-P patients and non-diseased controls. LPA-18:2 levels were significantly lower in samples from PPMS-P patients than PPMS-NP and non-diseased controls. No significant differences were detected between PPMS-NP and controls. Boxes indicate the interquartile range, horizontal lines indicate group medians, whiskers connect the lowest and the highest observations. The statistical analysis was performed using the One-way ANOVA with Tukey’s multiple comparison test (*p < 0.05, **p < 0.01). Control, n = 8; PPMS-NP, n = 10; PPMS-P, n = 9. (B) Graph shows LPA-18:2 levels in the plasma of untreated and treated PPMS-NP and PPMS-P patients. Untreated: PPMS-NP, n = 4; PPMS-P, n = 5; treated with glatiramer acetate (GA): PPMS-NP, n = 5; PPMS-P, n = 3; treated with Interferon-β (IFNβ): PPMS-NP, n = 1; treated with Fingolimod: PPMS-P, n = 1. Color coded horizontal lines depict group means. (C) LPA-18:2 levels in the plasma inversely correlated with the severity of the neurological deficit assessed using the EDSS method. Green and blue dots show the values of PPMS-NP and PPMS-P patients respectively. Lines represent the linear regressions of all patients together (black), PPMS-NP (green), and PPMS-P (blue) subgroups. Correlations were computed using the Spearman’s r coefficient. p < 0.05 (in bold) was considered significant. PPMS-NP, n = 10; PPMS-P, n = 9.
Figure 6
Figure 6
LPA-18:2 levels in RRMS and SPMS patients with stable or progressed disability. (A,B) Tables show the demographic features of the cohorts of SPMS (A) and RRMS (B) patients from which additional plasma lipidomic datasets were obtained. SPMS, secondary progressive MS; SPMS-NP, secondary progressive MS with non-progressed disability; SPMS-P, secondary progressive MS with progressed disability; RRMS, relapsing–remitting MS; RRMS-S, relapsing–remitting MS with stable disability; RRMS-P, relapsing–remitting MS with progressed disability; M, male; F, female. Age is expressed as mean ± standard deviation. Mann–Whitney test was applied to assess differences in terms of age. Fisher exact test was applied to assess differences in terms of gender. (C,D) Graphs show LPA-18:2 levels in the plasma of SPMS and RRMS patients with either a stable or more rapid disease course. Scatter plot graphs are presented with the mean ± SEM. (C) LPA-18:2 levels were lower in the plasma of SPMS-P compared with SPMS-NP patients. SPMS-NP, n = 6; SPMS-P, n = 5. (D) No differences in LPA-18:2 plasma levels were observed between RRMS-S and RRMS-P patients. RRMS-S, n = 13; RRMS-P, n = 11. Differences in LPA-18:2 levels were assessed using the independent t-test (*p < 0.05).

Similar articles

Cited by

References

    1. Compston A, Coles A. Multiple sclerosis. Lancet. 2008;372:1502–1517. doi: 10.1016/S0140-6736(08)61620-7. - DOI - PubMed
    1. Vidaurre OG, et al. Cerebrospinal fluid ceramides from patients with multiple sclerosis impair neuronal bioenergetics. Brain. 2014;137:2271–2286. doi: 10.1093/brain/awu139. - DOI - PMC - PubMed
    1. Villoslada P, et al. Metabolomic signatures associated with disease severity in multiple sclerosis. Neurol. Neuroimmunol. Neuroinflammation. 2017;4:e321. doi: 10.1212/NXI.0000000000000321. - DOI - PMC - PubMed
    1. Del Boccio P, et al. Lipidomic investigations for the characterization of circulating serum lipids in multiple sclerosis. J. Proteomics. 2011;74:2826–2836. doi: 10.1016/j.jprot.2011.06.023. - DOI - PubMed
    1. Teunissen CE, et al. Decreased levels of the brain specific 24S-hydroxycholesterol and cholesterol precursors in serum of multiple sclerosis patients. Neurosci. Lett. 2003;347:159–162. doi: 10.1016/S0304-3940(03)00667-0. - DOI - PubMed

Publication types