

Long-term motor skill training with individually adjusted progressive difficulty enhances learning and promotes corticospinal plasticity
- PMID: 32973251
- PMCID: PMC7518278
- DOI: 10.1038/s41598-020-72139-8
Long-term motor skill training with individually adjusted progressive difficulty enhances learning and promotes corticospinal plasticity
Abstract
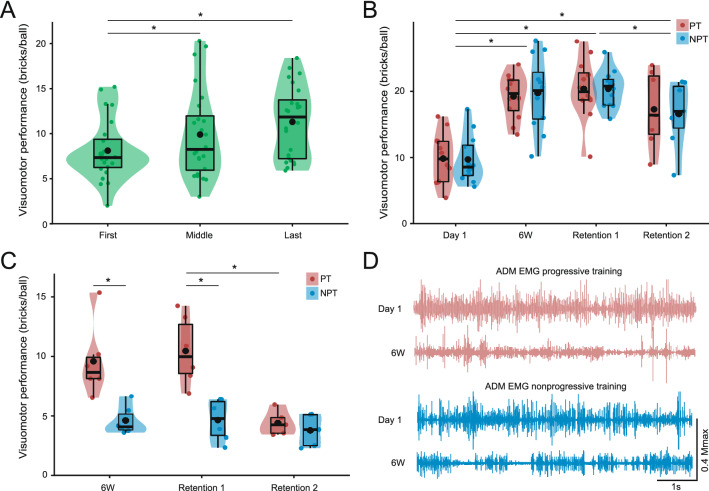
Motor skill acquisition depends on central nervous plasticity. However, behavioural determinants leading to long lasting corticospinal plasticity and motor expertise remain unexplored. Here we investigate behavioural and electrophysiological effects of individually tailored progressive practice during long-term motor skill training. Two groups of participants practiced a visuomotor task requiring precise control of the right digiti minimi for 6 weeks. One group trained with constant task difficulty, while the other group trained with progressively increasing task difficulty, i.e. continuously adjusted to their individual skill level. Compared to constant practice, progressive practice resulted in a two-fold greater performance at an advanced task level and associated increases in corticospinal excitability. Differences were maintained 8 days later, whereas both groups demonstrated equal retention 14 months later. We demonstrate that progressive practice enhances motor skill learning and promotes corticospinal plasticity. These findings underline the importance of continuously challenging patients and athletes to promote neural plasticity, skilled performance, and recovery.
Conflict of interest statement
The authors declare no competing interests.
Figures


Similar articles
-
Progressive practice promotes motor learning and repeated transient increases in corticospinal excitability across multiple days.Brain Stimul. 2018 Mar-Apr;11(2):346-357. doi: 10.1016/j.brs.2017.11.005. Epub 2017 Nov 13. Brain Stimul. 2018. PMID: 29187320
-
Long-term progressive motor skill training enhances corticospinal excitability for the ipsilateral hemisphere and motor performance of the untrained hand.Eur J Neurosci. 2017 Jun;45(12):1490-1500. doi: 10.1111/ejn.13409. Epub 2016 Oct 13. Eur J Neurosci. 2017. PMID: 27657352 Clinical Trial.
-
Short-term immobilization influences use-dependent cortical plasticity and fine motor performance.Neuroscience. 2016 Aug 25;330:247-56. doi: 10.1016/j.neuroscience.2016.06.002. Epub 2016 Jun 6. Neuroscience. 2016. PMID: 27282084 Clinical Trial.
-
Age-related changes in corticospinal excitability and intracortical inhibition after upper extremity motor learning: a systematic review and meta-analysis.Neurobiol Aging. 2017 Jul;55:61-71. doi: 10.1016/j.neurobiolaging.2017.03.024. Epub 2017 Mar 27. Neurobiol Aging. 2017. PMID: 28431286
-
Corticospinal and spinal adaptations to motor skill and resistance training: Potential mechanisms and implications for motor rehabilitation and athletic development.Eur J Appl Physiol. 2021 Mar;121(3):707-719. doi: 10.1007/s00421-020-04584-2. Epub 2021 Jan 2. Eur J Appl Physiol. 2021. PMID: 33389142 Review.
Cited by
-
Restoration of Over-Ground Walking via Non-Invasive Neuromodulation Therapy: A Single-Case Study.J Clin Med. 2023 Nov 28;12(23):7362. doi: 10.3390/jcm12237362. J Clin Med. 2023. PMID: 38068414 Free PMC article.
-
Practice makes plasticity: 10-Hz rTMS enhances LTP-like plasticity in musicians and athletes.Front Neural Circuits. 2023 Mar 21;17:1124221. doi: 10.3389/fncir.2023.1124221. eCollection 2023. Front Neural Circuits. 2023. PMID: 37025991 Free PMC article.
-
Intermittent hypoxia-induced enhancements in corticospinal excitability predict gains in motor learning and metabolic efficiency.Sci Rep. 2025 Feb 24;15(1):6614. doi: 10.1038/s41598-025-90890-8. Sci Rep. 2025. PMID: 39994358 Free PMC article.
-
Reinforcement learning in motor skill acquisition: using the reward positivity to understand the mechanisms underlying short- and long-term behavior adaptation.Front Behav Neurosci. 2024 Oct 30;18:1466970. doi: 10.3389/fnbeh.2024.1466970. eCollection 2024. Front Behav Neurosci. 2024. PMID: 39539941 Free PMC article.
-
Dynamic motor practice improves movement accuracy, force control and leads to increased corticospinal excitability compared to isometric motor practice.Front Hum Neurosci. 2023 Jan 5;16:1019729. doi: 10.3389/fnhum.2022.1019729. eCollection 2022. Front Hum Neurosci. 2023. PMID: 36684837 Free PMC article.
References
MeSH terms
LinkOut - more resources
Full Text Sources
Medical
