. 2020 Aug 19:14:239.
doi: 10.3389/fncel.2020.00239. eCollection 2020.

The CNS Myelin Proteome: Deep Profile and Persistence After Post-mortem Delay

Affiliations

The CNS Myelin Proteome: Deep Profile and Persistence After Post-mortem Delay

Olaf Jahn et al. Front Cell Neurosci. .

Abstract

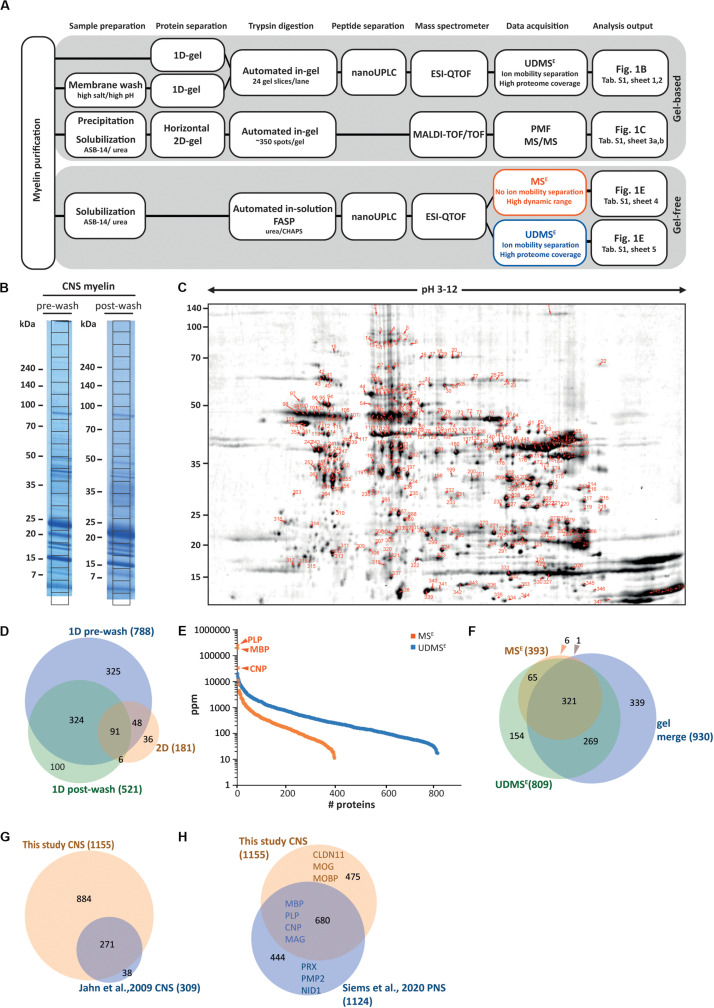
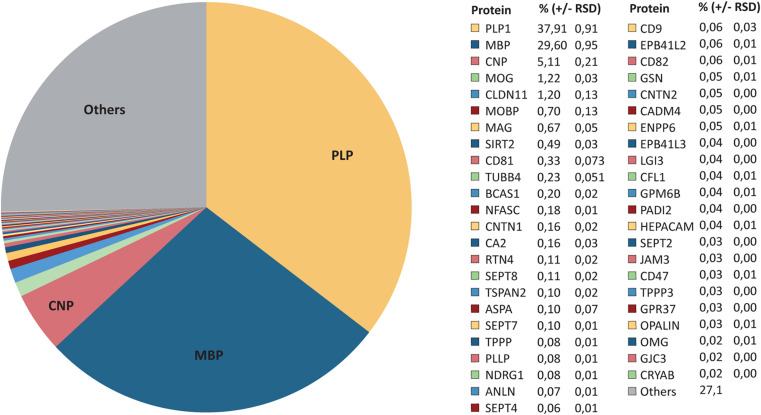
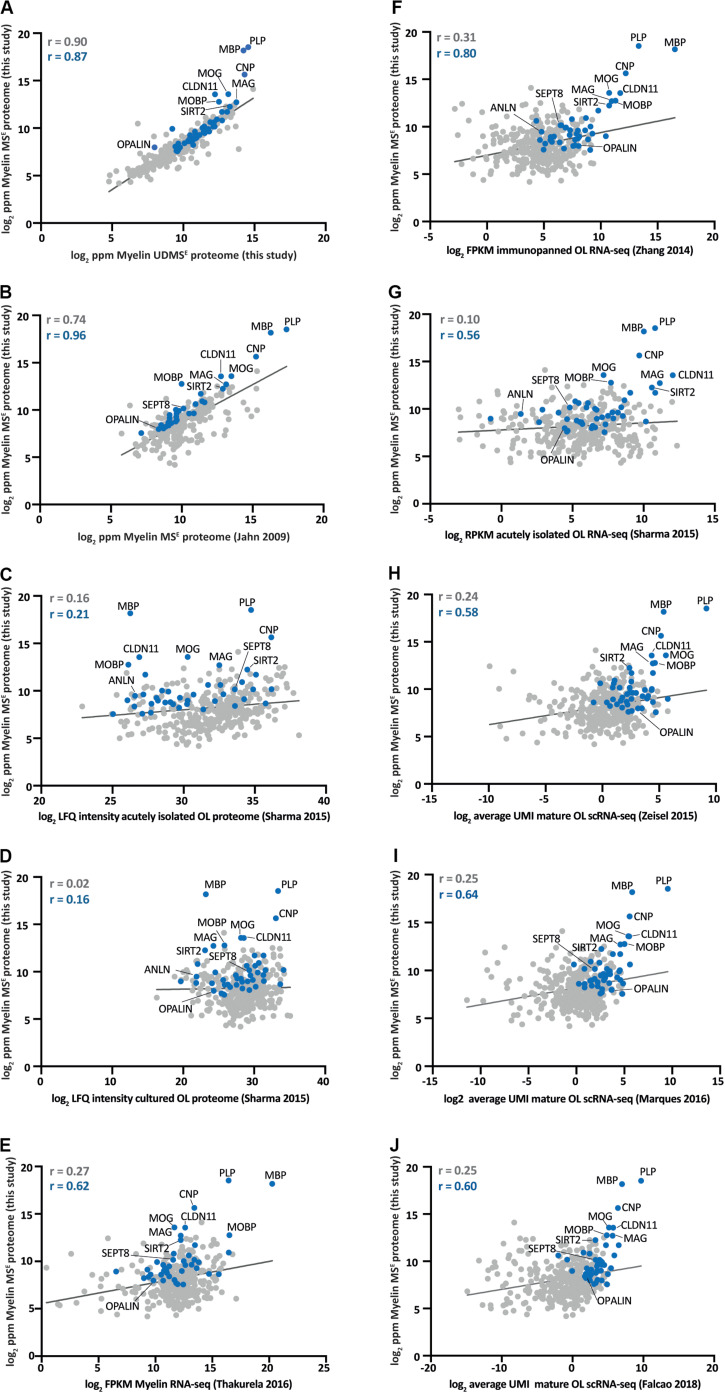
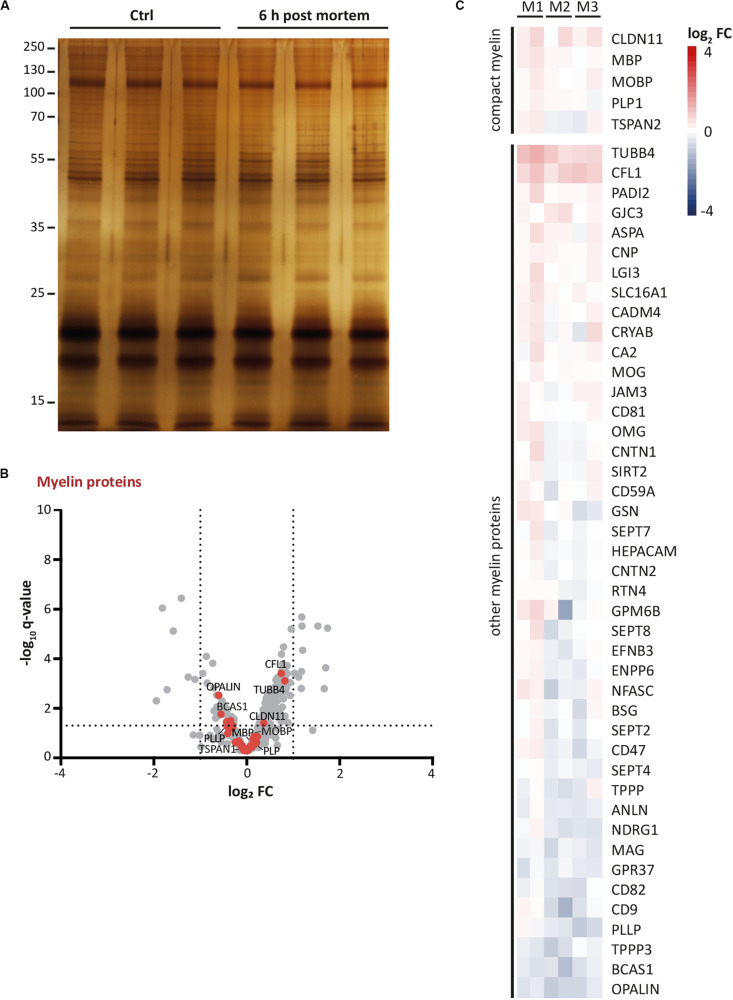
Myelin membranes are dominated by lipids while the complexity of their protein composition has long been considered to be low. However, numerous additional myelin proteins have been identified since. Here we revisit the proteome of myelin biochemically purified from the brains of healthy c56Bl/6N-mice utilizing complementary proteomic approaches for deep qualitative and quantitative coverage. By gel-free, label-free mass spectrometry, the most abundant myelin proteins PLP, MBP, CNP, and MOG constitute 38, 30, 5, and 1% of the total myelin protein, respectively. The relative abundance of myelin proteins displays a dynamic range of over four orders of magnitude, implying that PLP and MBP have overshadowed less abundant myelin constituents in initial gel-based approaches. By comparisons with published datasets we evaluate to which degree the CNS myelin proteome correlates with the mRNA and protein abundance profiles of myelin and oligodendrocytes. Notably, the myelin proteome displays only minor changes if assessed after a post-mortem delay of 6 h. These data provide the most comprehensive proteome resource of CNS myelin so far and a basis for addressing proteomic heterogeneity of myelin in mouse models and human patients with white matter disorders.

Keywords: autopsy; central nervous system (CNS); demyelination; label-free proteomics; myelin proteome; oligodendrocyte; post-mortem delay; transcriptome.


Figures

FIGURE 1
FIGURE 1
Proteome analysis of CNS myelin. (A) Schematic illustration of the gel-based (top) and gel-free (bottom) proteomic workflow to approach CNS myelin purified from the brains of wild-type c57Bl/6N mice dissected at P75. Note that gel-free proteome analysis enables largely automated sample processing and omits labor-intense gel-electrophoresis, thus reducing hands-on time. (B) One-dimensional gel-separation of CNS myelin. Myelin was separated by SDS-PAGE without (pre-wash) or upon (post-wash) depleting soluble and peripheral membrane proteins by an additional step of high-pH and high-salt conditions. Proteins were visualized with colloidal Coomassie (CBB250). The denoted grid subdivides each lane into 24 equally sized slices, which were excised for automated tryptic digest, peptide separation by nanoUPLC and data acquisition using an ESI-QTOF mass spectrometer, thereby identifying 788 (pre-wash) and 521 (post-wash) proteins, respectively (see Supplementary Table S1). (C) Two-dimensional gel-separation of CNS myelin. Myelin was two-dimensionally separated using a 2D-IEF/SDS-PAGE with isoelectric focusing (IEF) in a 24 cm gel strip with nonlinear pH-gradient (pH 3–12) as the first and 10–15% acrylamide gradient SDS-PAGE (25.5 × 20 cm, gel thickness 0.65 mm) as the second dimension. Proteins were visualized by colloidal Coomassie staining; protein spots were excised, subjected to automated tryptic in-gel digestion and MALDI-TOF mass spectrometry, thereby identifying 181 non-redundant proteins from 352 spots (Supplementary Table S1). (D) Venn diagram comparing the number of proteins identified in CNS myelin by the three gel-based approaches. (E) Number and relative abundance of proteins identified in myelin purified from the brains of wild-type mice using two gel-free data acquisition modes (MSE, UDMSE). Note that MSE (orange) identifies comparatively fewer proteins in purified myelin but provides a dynamic range of more than four orders of magnitude. UDMSE (blue) identifies a larger number of proteins but provides a dynamic range of only about three orders of magnitude. Note that the dynamic range of MSE is required for the quantification of the exceptionally abundant myelin proteins proteolipid protein (PLP), myelin basic protein (MBP) and cyclic nucleotide phosphodiesterase (CNP). Samples were analyzed in three biological replicates with four technical replicates each (duplicate digestion and injection). For datasets see Supplementary Table S1. ppm, parts per million. (F) Venn diagram comparing the number of proteins identified in CNS myelin by MSE, UDMSE and gel-based approaches. (G) Venn diagram of the proteins identified in CNS myelin in this study compared with those identified in a previous approach (Jahn et al., 2009). (H) Venn diagram comparing the proteins identified in CNS myelin in this study with those previously identified in PNS myelin (Siems et al., 2020). Selected marker proteins are denoted.
FIGURE 2
FIGURE 2
Relative abundance of CNS myelin proteins. Pie chart of the MSE dataset shown in Figure 1E and Supplementary Table S1. The relative abundance of known myelin proteins is given as percent with relative standard deviation (% ±RSD). Note that known myelin proteins constitute approximately 73% of the total myelin protein; proteins so far not independently validated as myelin proteins constitute about 27%.
FIGURE 3
FIGURE 3
Comparison of the myelin proteome with proteome and transcriptome profiles of myelin and oligodendrocytes. (A) Log2-transformed relative abundance of the proteins identified in myelin in this study by MSE plotted against their log2-transformed relative abundance as quantified by UDMSE. Data points representing known myelin proteins as specified in Figure 2 are labeled in blue; all other data points in gray. The correlation coefficient (r) was calculated for all proteins identified by MSE (displayed in gray) and specifically for the known myelin proteins (given in blue). The regression line is plotted for orientation. ppm, parts per million. (B) Same as (A) but plotted against the myelin proteome as previously assessed by MSE (Jahn et al., 2009). (C) Same as (A) but plotted against the proteome of acutely isolated O4-immunopositive oligodendrocytes (Sharma et al., 2015). LFQ, label-free quantification. (D) Same as (A) but plotted against the proteome of O1-immunopositive primary oligodendrocytes cultured for 4 days in vitro (DIV) (Sharma et al., 2015). (E) Same as (A) but plotted against the RNA-seq-based transcriptome of myelin purified from the brains of mice (Thakurela et al., 2016). FPKM, fragments per kilobase of exon model per million reads mapped. (F) Same as (A) but plotted against the RNA-seq-based transcriptome of oligodendrocytes immunopanned using MOG-specific antibodies (Zhang et al., 2014). (G) Same as (A) but plotted against the RNA-seq-based transcriptome of acutely isolated O4-immunopositive oligodendrocytes (Sharma et al., 2015). RPKM, reads per kilobase per million mapped reads. (H) Same as (A) but plotted against the scRNA-seq-based transcriptome of mature oligodendrocytes in the mouse cortex and hippocampus [mean of all 484 cells in clusters Oligo5 and Oligo6 in Zeisel et al. (2015)]. UMI, unique molecular identifiers. (I) Same as (A) but plotted against the scRNA-seq-based transcriptome of mature oligodendrocytes in 10 regions of the mouse CNS [mean of all 2748 cells in clusters OL1 – OL6 in Marques et al. (2016)]. (J) Same as (A) but plotted against the scRNA-seq-based transcriptome of mature oligodendrocytes in the mouse spinal cord [mean of all 617 cells in clusters MOL2-Ct and MOL5/6-Ct in Falcão et al. (2018)].
FIGURE 4
FIGURE 4
Persistence of myelin proteins upon post-mortem delay. (A) Myelin purified from the brains of mice at P56 was separated by SDS-PAGE (0.5 μg protein load) and proteins were visualized by silver staining. Myelin of brains frozen upon a post-mortem delay of 6 h at room temperature was compared with myelin of brains frozen immediately upon dissection (Ctrl). Note the similar band pattern. Gel shows n = 3 biological replicates per condition. (B) Volcano plot representing differential proteome analysis by DRE-UDMSE to compare myelin purified from brains upon post-mortem delay with myelin of brains immediately frozen upon dissection. For entire dataset see Supplementary Table S1. Data points represent proteins quantified in myelin purified from mouse brains frozen after a post-mortem delay of 6 h at room temperature compared to immediately frozen brains and are plotted as the log2-transformed fold-change (FC) on the x-axis against the –log10-transformed q-value on the y-axis. Vertical stippled lines mark a 2-fold/0.5-fold change (FC) as significance threshold. Horizontal stippled line represents a –log10-transformed q-value of 1.301, reflecting a q-value of 0.05 as significance threshold. Data points highlighted in red represent known myelin proteins as specified in Figure 4C. Note that no known myelin protein exceeds the fold-change significance threshold. (C) Heatmap displaying known myelin proteins as highlighted by the red data points in Figure 4B. Heatmap shows reduced (blue) or increased (red) abundance in myelin purified from brains after post-mortem delay. Each horizontal line corresponds to the fold-change (FC) of a distinct myelin protein compared to its average abundance in control myelin plotted on a log2 color scale. Heatmap displays 6 replicates, i.e., three biological replicates per condition (M1, M2, M3) with two technical replicates each.

Similar articles

Cited by

References

    1. Ackerman S. D., Garcia C., Piao X., Gutmann D. H., Monk K. R. (2015). The adhesion GPCR Gpr56 regulates oligodendrocyte development via interactions with Gα12/13 and RhoA. Nat. Commun. 6:6122. 10.1038/ncomms7122 - DOI - PMC - PubMed
    1. Ahrné E., Molzahn L., Glatter T., Schmidt A. (2013). Critical assessment of proteome-wide label-free absolute abundance estimation strategies. Proteomics 13 2567–2578. 10.1002/pmic.201300135 - DOI - PubMed
    1. Al-Abdi L., Al Murshedi F., Elmanzalawy A., Al Habsi A., Helaby R., Ganesh A., et al. (2020). CNP deficiency causes severe hypomyelinating leukodystrophy in humans. Hum. Genet. 139 615–622. 10.1007/s00439-020-02144-4 - DOI - PubMed
    1. Ambrozkiewicz M. C., Schwark M., Kishimoto-Suga M., Borisova E., Hori K., Salazar-Lázaro A., et al. (2018). Polarity Acquisition in Cortical Neurons Is Driven by Synergistic Action of Sox9-Regulated Wwp1 and Wwp2 E3 Ubiquitin Ligases and Intronic miR-140. Neuron 100:1097-1115.e15. 10.1016/j.neuron.2018.10.008 - DOI - PubMed
    1. Banik N. L., Smith M. E. (1977). Protein determinants of myelination in different regions of developing rat central nervous system. Biochem. J. 162 247–255. 10.1042/bj1620247 - DOI - PMC - PubMed