

Antenatal Hypoxia Accelerates the Onset of Alzheimer's Disease Pathology in 5xFAD Mouse Model
- PMID: 32973487
- PMCID: PMC7472639
- DOI: 10.3389/fnagi.2020.00251
Antenatal Hypoxia Accelerates the Onset of Alzheimer's Disease Pathology in 5xFAD Mouse Model
Abstract
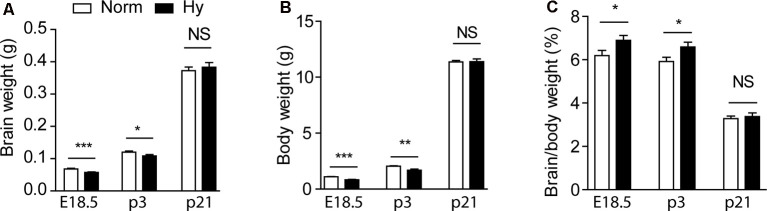
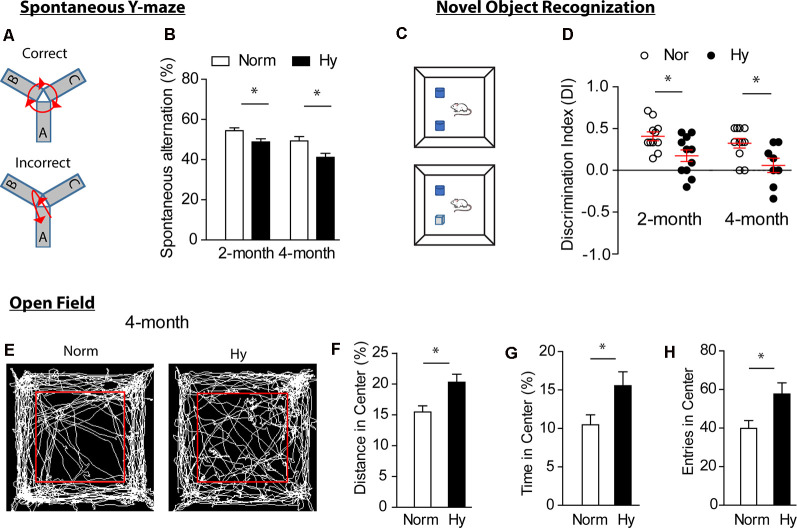
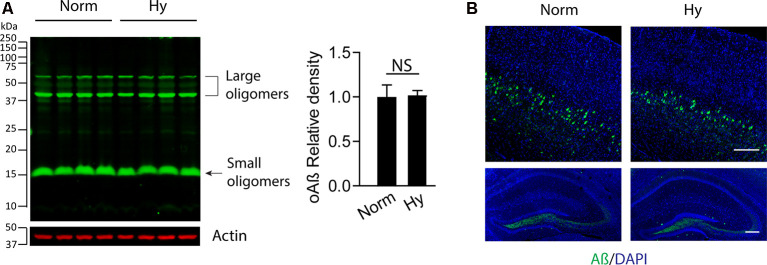
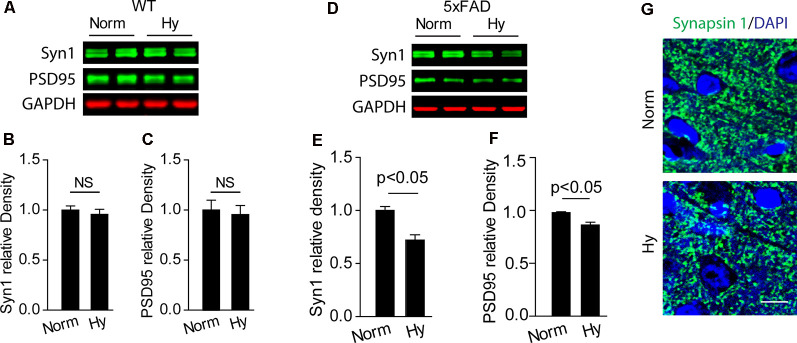
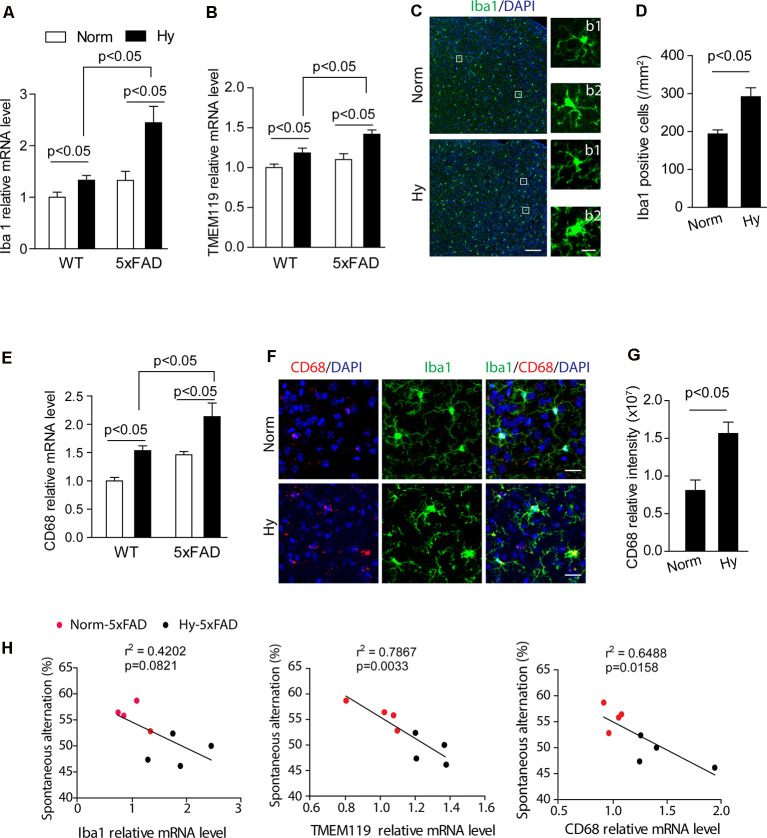
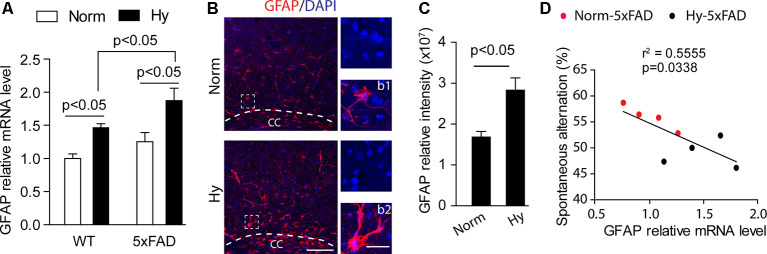
Alzheimer's disease (AD) is a chronic neurodegenerative disorder associated with cognitive impairment and later dementia among the elderly. Mounting evidence shows that adverse maternal environments during the fetal development increase the risk of diseases later in life including neurological disorders, and suggests an early origin in the development of AD-related dementia (ADRD) in utero. In the present study, we investigated the impact of antenatal hypoxia and fetal stress on the initiation of AD-related pathology in offspring of 5xFAD mice. We showed that fetal hypoxia significantly reduced brain and body weight in the fetal and the early postnatal period, which recovered in young adult mice. Using spontaneous Y-maze, novel object recognition (NOR), and open field (OF) tasks, we found that antenatal hypoxia exacerbated cognitive decline in offspring of 5xFAD compared with normoxia control. Of interest, fetal hypoxia did not alter intraneuronal soluble amyloid-β (Aβ) oligomer accumulation in the cortex and hippocampus in 5xFAD mouse offspring, indicating that antenatal hypoxia increased the vulnerability of the brain to synaptotoxic Aβ in the disease onset later in life. Consistent with the early occurrence of cognitive decline, we found synapse loss but not neuronal death in the cerebral cortex in 5xFAD but not wild-type (WT) offspring exposed to antenatal hypoxia. Furthermore, we also demonstrated that antenatal hypoxia significantly increased microglial number and activation, and reactive astrogliosis in the cerebral cortex in WT offspring. Moreover, antenatal hypoxia resulted in an exacerbated increase of microgliosis and astrogliosis in the early stage of AD in 5xFAD offspring. Together, our study reveals a causative link between fetal stress and the accelerated onset of AD-related pathology, and provides mechanistic insights into the developmental origin of aging-related neurodegenerative disorders.
Keywords: 5xFAD mouse; Alzheimer’s disease; antenatal hypoxia; cognitive impairment; gliosis; synapse loss.
Copyright © 2020 Shen, Hu, Zhao, Zhang and Ma.
Figures
Similar articles
-
Hippocampal disruptions of synaptic and astrocyte metabolism are primary events of early amyloid pathology in the 5xFAD mouse model of Alzheimer's disease.Cell Death Dis. 2021 Oct 16;12(11):954. doi: 10.1038/s41419-021-04237-y. Cell Death Dis. 2021. PMID: 34657143 Free PMC article.
-
MK-0677, a Ghrelin Agonist, Alleviates Amyloid Beta-Related Pathology in 5XFAD Mice, an Animal Model of Alzheimer's Disease.Int J Mol Sci. 2018 Jun 18;19(6):1800. doi: 10.3390/ijms19061800. Int J Mol Sci. 2018. PMID: 29912176 Free PMC article.
-
High-Fat-Diet Intake Enhances Cerebral Amyloid Angiopathy and Cognitive Impairment in a Mouse Model of Alzheimer's Disease, Independently of Metabolic Disorders.J Am Heart Assoc. 2016 Jun 13;5(6):e003154. doi: 10.1161/JAHA.115.003154. J Am Heart Assoc. 2016. PMID: 27412896 Free PMC article.
-
Chronic kidney disease accelerates cognitive impairment in a mouse model of Alzheimer's disease, through angiotensin II.Exp Gerontol. 2017 Jan;87(Pt A):108-112. doi: 10.1016/j.exger.2016.11.012. Epub 2016 Dec 1. Exp Gerontol. 2017. PMID: 27916702
-
A preclinical perspective on the enhanced vulnerability to Alzheimer's disease after early-life stress.Neurobiol Stress. 2018 Feb 23;8:172-185. doi: 10.1016/j.ynstr.2018.02.003. eCollection 2018 Feb. Neurobiol Stress. 2018. PMID: 29888312 Free PMC article. Review.
Cited by
-
C-Type Natriuretic Peptide Ameliorates Vascular Injury and Improves Neurological Outcomes in Neonatal Hypoxic-Ischemic Brain Injury in Mice.Int J Mol Sci. 2021 Aug 20;22(16):8966. doi: 10.3390/ijms22168966. Int J Mol Sci. 2021. PMID: 34445671 Free PMC article.
-
Long-Term Neurologic Consequences following Fetal Growth Restriction: The Impact on Brain Reserve.Dev Neurosci. 2025;47(2):139-146. doi: 10.1159/000539266. Epub 2024 May 14. Dev Neurosci. 2025. PMID: 38740013 Free PMC article. Review.
-
Unravelling the Collective Calcium Dynamics of Physiologically Aged Astrocytes under a Hypoxic State In Vitro.Int J Mol Sci. 2023 Jul 31;24(15):12286. doi: 10.3390/ijms241512286. Int J Mol Sci. 2023. PMID: 37569663 Free PMC article.
-
Very Early-Life Risk Factors for Developing Dementia: Evidence From Full Population Registers.J Gerontol B Psychol Sci Soc Sci. 2023 Dec 6;78(12):2131-2140. doi: 10.1093/geronb/gbad142. J Gerontol B Psychol Sci Soc Sci. 2023. PMID: 37756487 Free PMC article.
-
Hypoxia and aging: molecular mechanisms, diseases, and therapeutic targets.MedComm (2020). 2024 Oct 15;5(11):e786. doi: 10.1002/mco2.786. eCollection 2024 Nov. MedComm (2020). 2024. PMID: 39415849 Free PMC article. Review.
References
-
- Basha M. R., Wei W., Bakheet S. A., Benitez N., Siddiqi H. K., Ge Y. W., et al. . (2005). The fetal basis of amyloidogenesis: exposure to lead and latent overexpression of amyloid precursor protein and β-amyloid in the aging brain. J. Neurosci. 25, 823–829. 10.1523/JNEUROSCI.4335-04.2005 - DOI - PMC - PubMed
Grants and funding
LinkOut - more resources
Full Text Sources
Molecular Biology Databases
Research Materials