. 2020 Aug 18:11:1977.
doi: 10.3389/fimmu.2020.01977. eCollection 2020.

Effector CD8 T Cell-Dependent Zika Virus Control in the CNS: A Matter of Time and Numbers

Affiliations

Effector CD8 T Cell-Dependent Zika Virus Control in the CNS: A Matter of Time and Numbers

Loulieta Nazerai et al. Front Immunol. .

Abstract

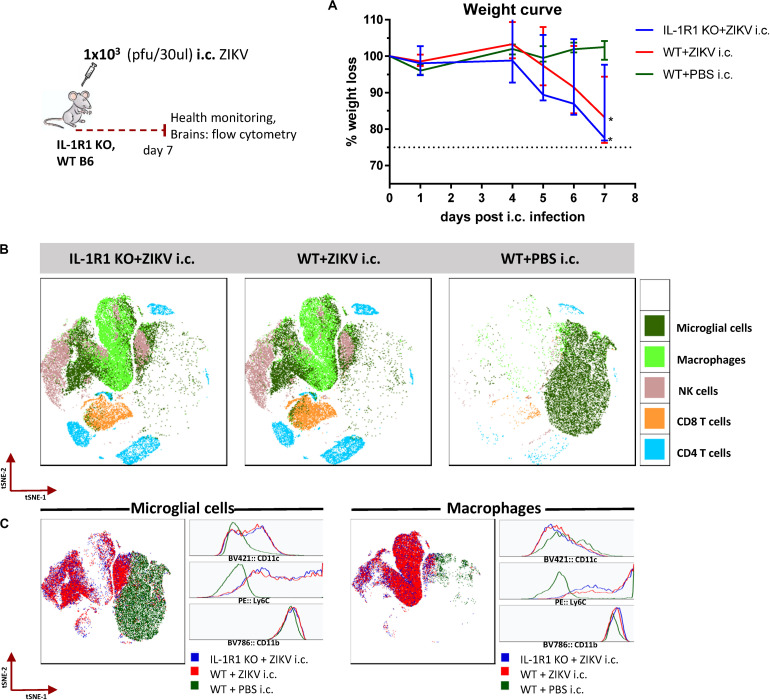
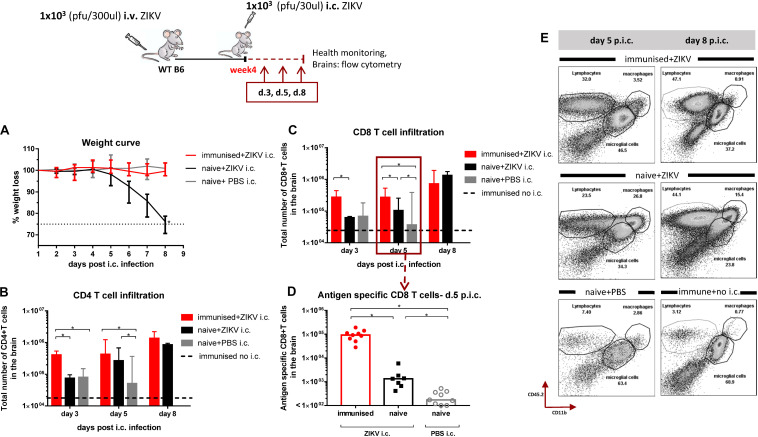
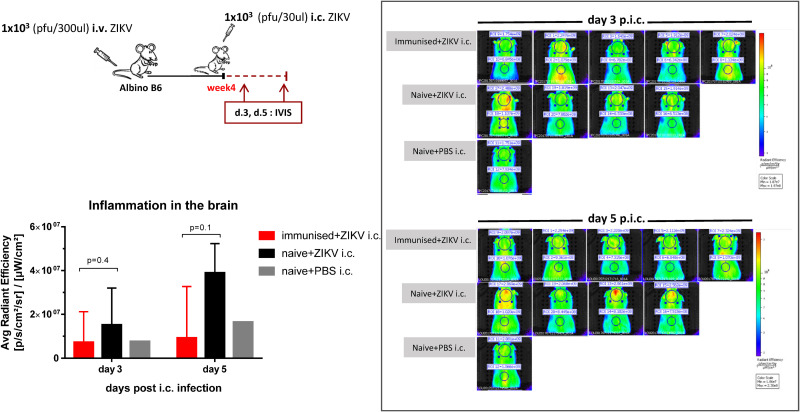
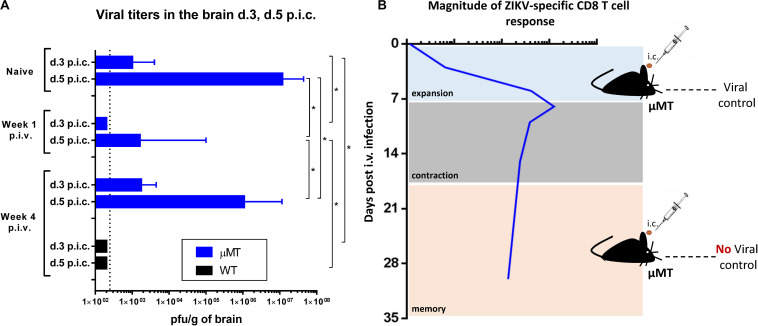
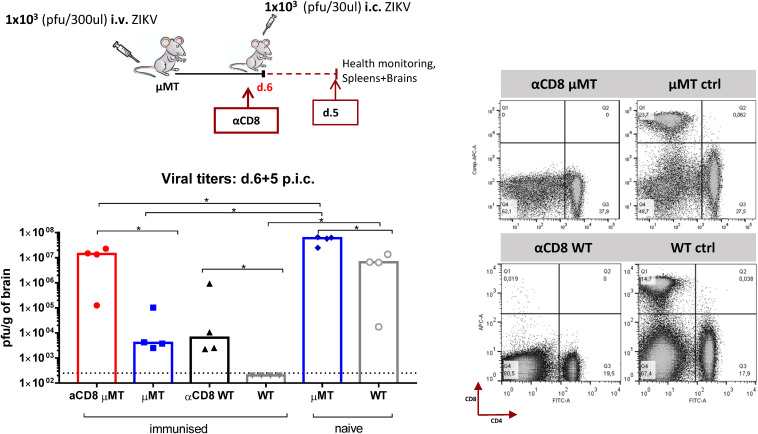
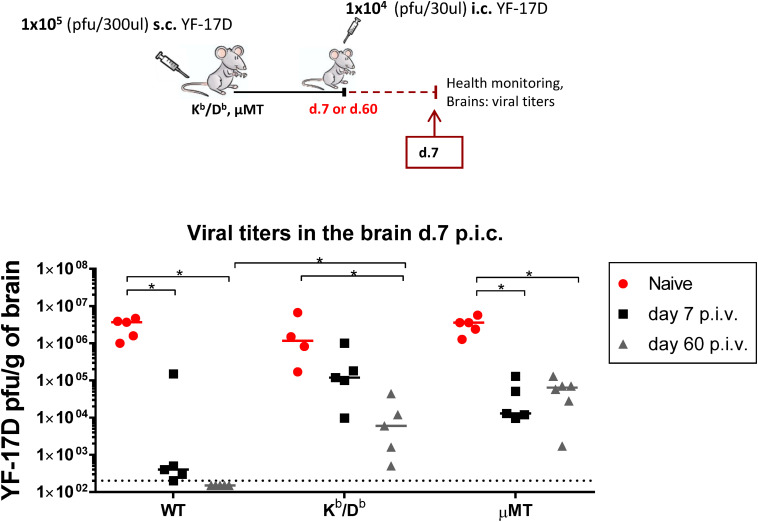
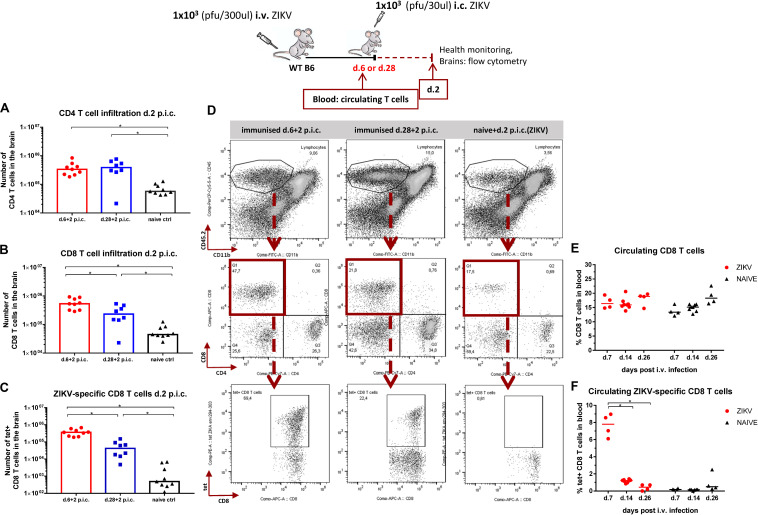
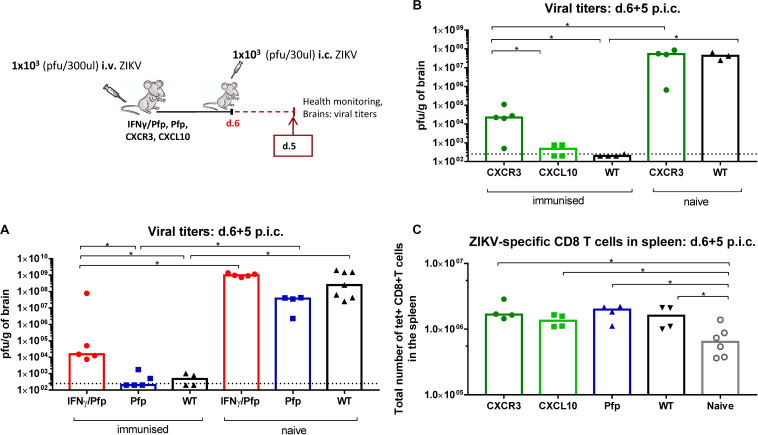
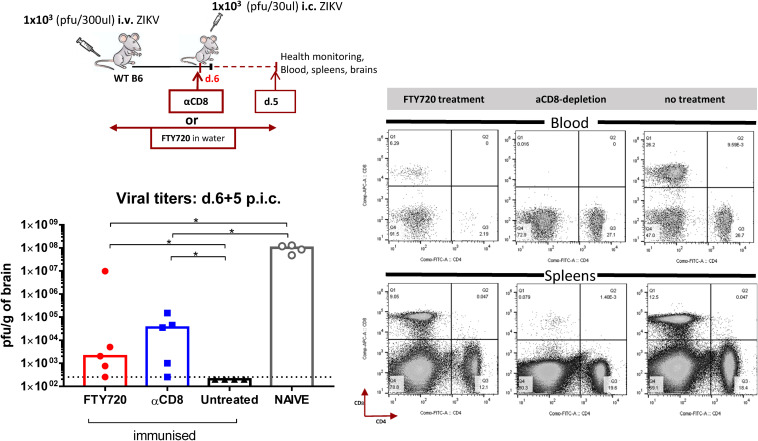
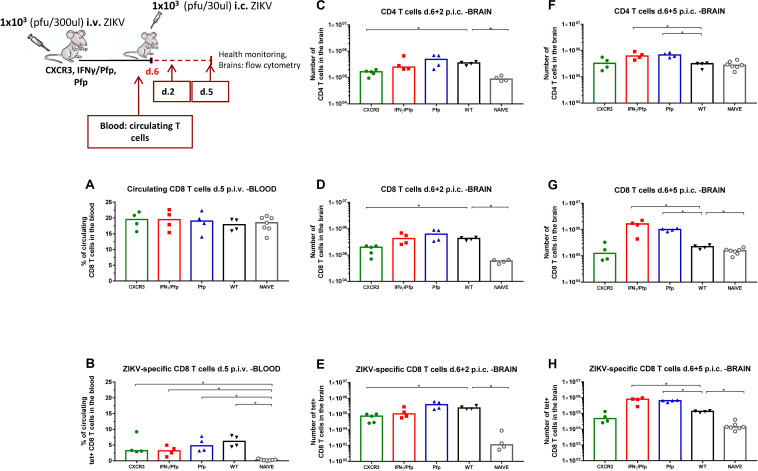
Zika virus (ZIKV), a mosquito-borne flavivirus, came into the spotlight in 2016 when it was found to be associated with an increased rate of microcephalic newborns in Brazil. The virus has further been recognized to cause neurologic complications in children and adults in the form of myelitis, encephalitis, acute disseminated encephalomyelitis (ADEM) and Guillain Barre Syndrome in a fraction of infected individuals. With the ultimate goal of identifying correlates of protection to guide the design of an effective vaccine, the study of the immune response to ZIKV infection has become the focus of research worldwide. Both innate and adaptive immune responses seem to be essential for controlling the infection. Induction of sufficient levels of neutralizing antibodies has been strongly correlated with protection against reinfection in various models, while the role of CD8 T cells as antiviral effectors in the CNS has been controversial. In an attempt to improve our understanding regarding the role of ZIKV-induced CD8 T cells in protective immunity inside the CNS, we have expanded on previous studies in intracranially infected mice. In a recent study, we have demonstrated that, peripheral ZIKV infection in adult C57BL/6 mice induces a robust CD8 T cell response that peaks within a week. In the present study, we used B cell deficient as well as wild-type mice to show that there is a race between CXCR3-dependent recruitment of the effector CD8 T cells and local ZIKV replication, and that CD8 T cells are capable of local viral control if they arrive in the brain early after viral invasion, in appropriate numbers and differentiation state. Our data highlight the benefits of considering this subset when designing vaccines against Zika virus.

Keywords: B cells; T cells; Zika virus; adaptive immunity; memory; mouse model; protection.


Figures

FIGURE 1
FIGURE 1
Composition of cellular infiltrates in the brains of IL-1R1 KO and WT mice following i.c. challenge with ZIKV. IL-1R1 KO and WT C57BL/6 mice were challenged with 1 × 10³ pfu ZIKV i.c. A group of naive mice injected i.c. with PBS was included for control. (A) Mice were weighed and monitored daily. (B) On day 7 post i.c. challenge, brains were removed and processed for flow cytometry. The flow cytometry data were analyzed and displayed as t-SNE plots to enable the identification of microglial cells (CD45.2int/CD11bint), macrophages (CD45hi/CD11bhi), NK cells (CD45.2+/NK1.1+/CD4 ), CD8 (CD45.2+/CD8+/CD4 ) and CD4 T cells (CD45.2+/CD4+/CD8 ) based on the expression of relevant surface markers. (C) The population of microglial cells and macrophages are displayed as t-SNE plots along with histograms indicating the expression levels of CD11c, Ly6C and CD11b for each group. The weight curve depicts the group medians and ranges. n = 4–5/time point. The stippled line on the weight curve indicates the humane endpoint of 25% weight loss (compared to initial weight). The results are representative of two independent experiments.
FIGURE 2
FIGURE 2
Kinetic of T cell infiltration in the brain following i.c. challenge with ZIKV. WT C57BL/6 mice were inoculated with 1 × 10³ pfu ZIKV i.v. and 4 weeks later, these mice along with naive controls, were challenged with 1 × 10³ pfu ZIKV i.c. A group of naive mice challenged i.c. with PBS and a group of immunized mice not challenged were also included for controls. Mice were weighed and monitored daily (A) and on days 3, 5, and 8 post i.c. challenge, brains were removed and the total number of CD4 T cells (B) and CD8 T cells (C) were determined via flow cytometry. For day 5 post i.c. the levels of ZIKV-specific CD8 T cells (D) were also determined. Representative flow plots of the cellular composition of infiltrating cells on days 5 and 8 post i.c. are included (E). The results represent the group medians ± ranges and, for day 5 post i.c, are pooled from two independent experiments. The weight curve depicts the group medians and ranges. n = 4–5/time point. The stippled line on the weight curve indicates the humane endpoint of 25% weight loss (compared to initial weight). Each dot represents one animal, *p < 0.05.
FIGURE 3
FIGURE 3
Inflammation levels in the brain. Albino C57BL/6 mice were inoculated with 1 × 10³ pfu ZIKV i.v. and 4 weeks later, these mice along with naive controls, were challenged with 1 × 10³ pfu ZIKV i.c. A group of naive mice injected i.c. with PBS and a group of immunized mice not challenged i.c. were also included for controls. Health status was monitored daily and on days 3 and 5 post i.c. challenge, mice were scanned for fluorescence in the IVIS SpectrumCT after administration of the fluorescent probe (ProSense 750, FAST) 6 h earlier. Representative images and scales indicating light intensity (ranging from dark blue for the least intense to red for the most intense) are included. The measured fluorescence on the back served as background fluorescence for each mouse and was subtracted from the fluorescence measured on the brain area. Fluorescence was expressed as average radiant efficiency. The results represent the group medians ± ranges. n = 1–5/time point. The experiment was also performed in BALB/c mice with similar results (data not shown).
FIGURE 4
FIGURE 4
Improved viral control in B cell deficient mice when challenged i.c. during the effector phase. B cell KO (μMT) mice were inoculated with 1 × 10³ pfu ZIKV i.v. and 1 week or 4 weeks later, these mice along with naive μMT control mice, were challenged with 1 × 10³ pfu ZIKV i.c. WT C57BL/6 mice challenged with 1 × 10³ pfu ZIKV i.c. on week 4 post i.v. were also included for comparison. (A) Health status was monitored daily and on days 3 and 5 post i.c. challenge, brains were removed and viral titers were measured by a plaque assay. The detection limit for virus in brain was 250 pfu/g organ and is displayed as a stippled line. The results represent the group medians ± ranges. n = 4–5/group. *p < 0.05. (B) Graphical representation of the experimental setup in relation to the T cell levels at the time of i.c. challenge; T cell levels represent a schematic based on published results regarding numbers of virus specific CD8 T cells in the spleen of WT mice (35).
FIGURE 5
FIGURE 5
CD8 T cell depletion impairs viral control in the CNS of B cell deficient and WT mice. B cell KO (μMT) and WT C57BL/6 mice were inoculated with 1 × 10³ pfu ZIKV i.v. and 1 week later, these mice along with matched CD8 T cell depleted groups (αCD8 μMT, αCD8 WT), were challenged with 1 × 10³ pfu ZIKV i.c. Naιve μMT and WT mice were included for control. Health status was monitored daily and on day 5 post i.c. challenge, brains were removed and viral titers were measured by a plaque assay. The detection limit for virus in brain was 250 pfu/g organ and is displayed as a stippled line. Each dot represents an individual animal. The efficiency αCD8-depletion was assessed on splenocytes by flow cytometry; representative flow plots are included. The columns represent the group medians and are representative of two independent experiments, *p < 0.05.
FIGURE 6
FIGURE 6
Viral control in CD8 T-cell deficient and B cell deficient mice when challenged i.c. with YF-17D virus during the effector and memory phase. WT C57BL/6, MHC class I CD8 T-cell deficient (Kb/Db) and B cell deficient (μMT) mice were vaccinated with 1 × 10⁵ pfu YF-17D s.c. and 1 week or 8 weeks later, these mice along with naive control mice, were challenged with 1 × 10⁴ pfu YF-17D i.c. Health status was monitored daily and on day 7 post i.c. challenge, brains were removed and viral titers were measured by an immune focus assay. The detection limit for virus in brain was 200 pfu/g organ and is displayed as a stippled line. The results represent the group medians and each dot represents one animal, *p < 0.05.
FIGURE 7
FIGURE 7
Accelerated influx in the CNS when higher numbers of effector CD8 T cells are circulating. WT C57BL/6 mice were inoculated with 1 × 10³ pfu ZIKV i.v. and either 1 or 4 weeks later, these mice along with naive controls, were challenged with 1 × 10³ pfu ZIKV i.c. Health status was monitored daily and on day 2 post i.c. challenge, brains were removed and the total number of CD4 T cells (A), CD8 T cells (B), and ZIKV-specific CD8 T cells (C) were determined by flow cytometry. Representative plots are included (D). The levels of circulating CD8 T cells (E) and ZIKV-specific CD8 T cells (F) in the blood were assessed on days 7, 14, and 28 following peripheral i.v. inoculation. The columns represent the group medians and each dot represents one animal. Data are pooled from two independent experiments, *p < 0.05.
FIGURE 8
FIGURE 8
Impact of CD8 T cell deficiency in efficient viral control in the brain. (A) IFNγ/Perforin double-deficient (IFNγ/Pfp), IFNγ-deficient (IFNγ), and Perforin-deficient (Pfp) mice and (B) CXCR3-deficient and CXCL10-deficient mice, were inoculated with 1 × 10³ pfu ZIKV i.v. and 1 week later these mice along with naive controls, were challenged with 1 × 10³ pfu ZIKV i.c. WT C57BL/6 immunized mice were included as positive controls. Health status was monitored daily and on day 5 post i.c. challenge, brains were removed and viral titers were measured by a plaque assay. (C) The total number of ZIKV-specific CD8 T cells in the spleens of CXCR3-, CXCL10-, Pfp- deficient mice were assessed by flow cytometry. The detection limit for virus in brain was 250 pfu/g organ and is displayed as a stippled line. The results represent the group medians and each dot represents one animal, *p < 0.05.
FIGURE 9
FIGURE 9
Effect of FTY720 treatment in protection during effector phase. WT C57BL/6 mice were inoculated with 1 × 10³ pfu ZIKV i.v. while FTY720 was administered in the water 2 days prior to i.v and for the whole duration of the experiment. Groups of immunized mice not receiving FTY720 (untreated), as well as a group receiving αCD8-depletion antibodies (αCD8), were included as controls. On day 6 post i.v, these mice along with naive controls, were challenged with 1 × 10³ pfu ZIKV i.c. Health status was monitored daily and on day 5 post i.c. challenge, brains were removed and viral titers were measured by a plaque assay. The efficiency of FTY720 administration and αCD8-depletion antibodies to reduce T cells was assessed on day 5 post i.c. in the blood and spleens by flow cytometry; representative plots are included. The detection limit for virus in brain was 250 pfu/g organ and is displayed as a stippled line. Each dot represents one animal. The columns represent the group medians, *p < 0.05.
FIGURE 10
FIGURE 10
Impact of CD8 T cell deficiency on cellular recruitment to the brain. CXCR3-deficient, IFNγ/Perforin double-deficient, IFNγ-deficient and Perforin-deficient mice were inoculated with 1 × 10³ pfu ZIKV i.v. WT C57BL/6 immunized and naive mice were included as controls. On day 5 post i.v, the percentage of circulating CD8 T cells (A) and ZIKV-specific CD8 T cells (B), were assessed in the blood by flow cytometry. On day 6 post i.v, mice were challenged with 1 × 10³ pfu ZIKV i.c. Health status was monitored daily and on days 2 and 5 post i.c. challenge, brains were removed and the total number of CD4 T cells (C,F), CD8 T cells (D,G), and ZIKV-specific CD8 T cells (E,H) were determined via flow cytometry. Each dot represents one animal. The columns represent the group medians, *p < 0.05.

Similar articles

Cited by

References

    1. Dick GW, Kitchen SF, Haddow AJ. Zika virus. I. Isolations and serological specificity. Trans R Soc Trop Med Hyg. (1952) 46:509–20. 10.1016/0035-9203(52)90042-4 - DOI - PubMed
    1. Simpson DI. Zika virus infection in man. Trans R Soc Trop Med Hyg. (1964) 58:335–8. - PubMed
    1. Duffy MR, Chen TH, Hancock WT, Powers AM, Kool JL, Lanciotti RS, et al. Zika virus outbreak on Yap Island, federated states of micronesia. N Engl J Med. (2009) 360:2536–43. 10.1056/nejmoa0805715 - DOI - PubMed
    1. Chang C, Ortiz K, Ansari A, Gershwin ME. The Zika outbreak of the 21st century. J Autoimmun. (2016) 68:1–13. 10.1016/j.jaut.2016.02.006 - DOI - PMC - PubMed
    1. Nazerai L, Pravsgaard CJ, Randrup TA. A ‘Furry-Tale’ of zika virus infection: what have we learned from animal models? Viruses. (2019) 11:29. 10.3390/v11010029 - DOI - PMC - PubMed

Publication types

MeSH terms