

Dysbiosis of Gut Microbiota and Short-Chain Fatty Acids in Encephalitis: A Chinese Pilot Study
- PMID: 32973805
- PMCID: PMC7468513
- DOI: 10.3389/fimmu.2020.01994
Dysbiosis of Gut Microbiota and Short-Chain Fatty Acids in Encephalitis: A Chinese Pilot Study
Abstract
Background: Encephalitis, the inflammation of the brain, may be caused by an infection or an autoimmune reaction. However, few researches were focused on the gut microbiome characteristics in encephalitis patients.
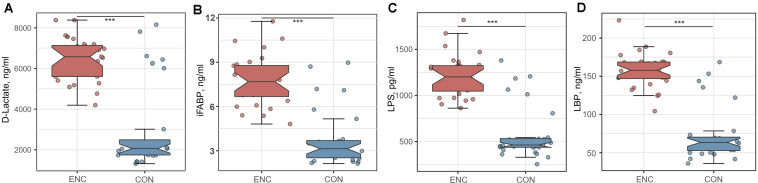
Methods: A prospective observational study was conducted in an academic hospital in Guangzhou from February 2017 to February 2018. Patients with encephalitis were recruited. Fecal and serum samples were collected at admission. Healthy volunteers were enrolled from a community. Disease severity scores were recorded by specialized physicians, including Glasgow Coma Scale (GCS), Sequential Organ Failure Assessment (SOFA), and Acute Physiology and Chronic Health Evaluation-II (APACHE-II). 16S rRNA sequence was performed to analyze the gut microbiome, then the α-diversities and β-diversities were estimated. Short-chain fatty acids (SCFAs) were extracted from fecal samples and determined by gas chromatography-mass spectrometry. Serum D-lactate (D-LA), intestinal fatty acid-binding protein (iFABP), lipopolysaccharide (LPS), and lipopolysaccharide-binding protein (LBP) were measured by enzyme-linked immunosorbent assay (ELISA). The associations among microbial indexes and clinical parameters were evaluated by Spearman correlation analysis.
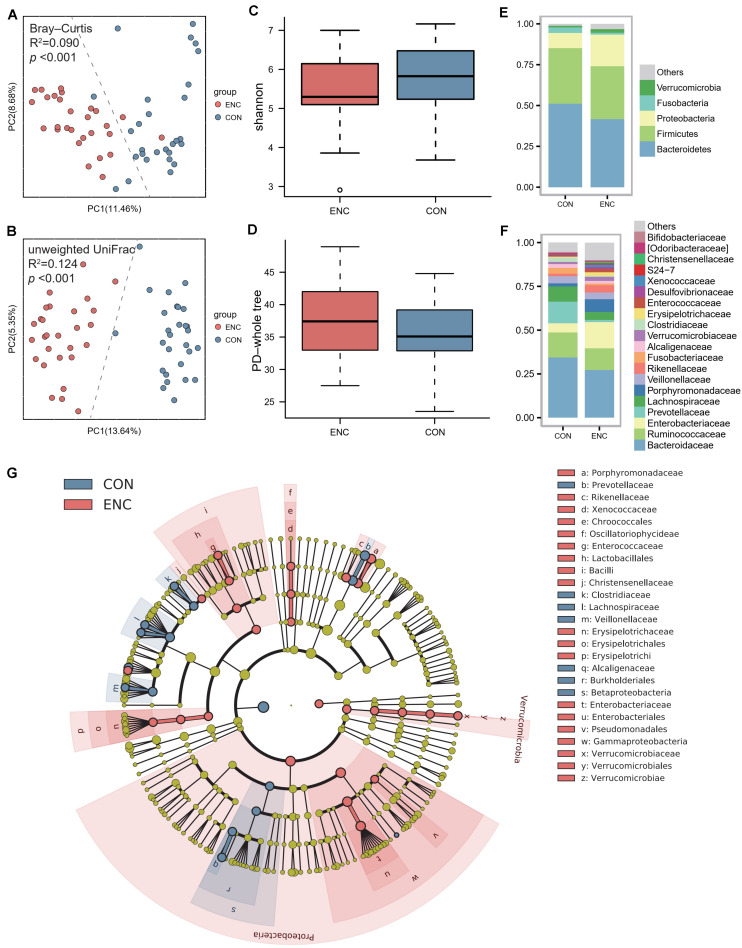
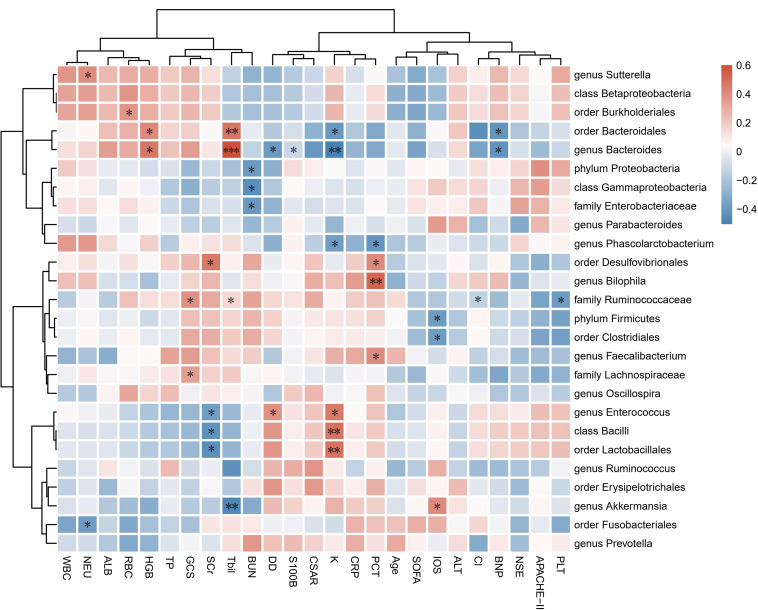
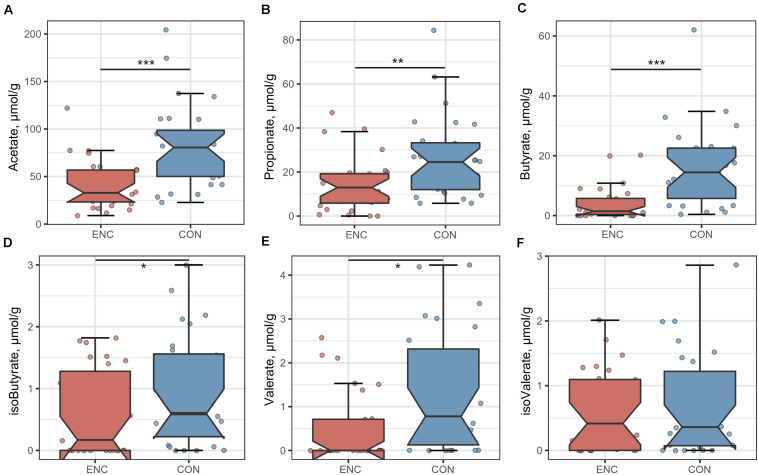
Results: In total, twenty-eight patients were recruited for analysis (median age 46 years; 82.1% male; median GCS 6.5; median SOFA 6.5; median APACHE-II 14.5). Twenty-eight age- and sex-matched healthy subjects were selected as controls. The β-diversities between patients and healthy subjects were significantly different. The α-diversities did not show significant differences between these two groups. In the patient group, the abundances of Bacteroidetes, Proteobacteria, and Bacilli were significantly enriched. Accordingly, fecal SCFA levels were decreased in the patient group, whereas serum D-LA, iFABP, LPS, and LBP levels were increased compared with those in healthy subjects. Correlation analyses showed that disease severity had positive correlations with Proteobacteria and Akkermansia but negative correlations with Firmicutes, Clostridia, and Ruminococcaceae abundances. The cerebrospinal fluid albumin-to-serum albumin ratio (CSAR) was positively related to the α-diversity but negatively correlated with the fecal butyrate concentration.
Conclusion: Gut microbiota disruption was observed in encephalitis patients, which manifested as pathogen dominance and health-promoting commensal depletion. Disease severity and brain damage may have associations with the gut microbiota or its metabolites. The causal relationship should be further explored in future studies.
Keywords: dysbiosis; encephalitis; gut microbiome; intestinal barrier; short-chain fatty acids.
Copyright © 2020 Xu, Tan, He, Wu, Wang and Yin.
Figures
Similar articles
-
Dysbiosis of Gut Microbiota Is an Independent Risk Factor of Stroke-Associated Pneumonia: A Chinese Pilot Study.Front Cell Infect Microbiol. 2021 Aug 3;11:715475. doi: 10.3389/fcimb.2021.715475. eCollection 2021. Front Cell Infect Microbiol. 2021. PMID: 34414134 Free PMC article.
-
Imbalance of Microbacterial Diversity Is Associated with Functional Prognosis of Stroke.Neural Plast. 2023 May 8;2023:6297653. doi: 10.1155/2023/6297653. eCollection 2023. Neural Plast. 2023. PMID: 37197229 Free PMC article.
-
Dysbiosis of Gut Microbiota and Short-Chain Fatty Acids in Acute Ischemic Stroke and the Subsequent Risk for Poor Functional Outcomes.JPEN J Parenter Enteral Nutr. 2021 Mar;45(3):518-529. doi: 10.1002/jpen.1861. Epub 2020 May 30. JPEN J Parenter Enteral Nutr. 2021. PMID: 32473086 Free PMC article.
-
Immunomodulatory potential of gut microbiome-derived short-chain fatty acids (SCFAs).Acta Biochim Pol. 2019 Mar 4;66(1):1-12. doi: 10.18388/abp.2018_2648. Acta Biochim Pol. 2019. PMID: 30831575 Review.
-
Neuropsychiatric Ramifications of COVID-19: Short-Chain Fatty Acid Deficiency and Disturbance of Microbiota-Gut-Brain Axis Signaling.Biomed Res Int. 2021 Oct 5;2021:7880448. doi: 10.1155/2021/7880448. eCollection 2021. Biomed Res Int. 2021. PMID: 34651049 Free PMC article. Review.
Cited by
-
Food-breastmilk combinations alter the colonic microbiome of weaning infants: an in silico study.mSystems. 2024 Sep 17;9(9):e0057724. doi: 10.1128/msystems.00577-24. Epub 2024 Aug 27. mSystems. 2024. PMID: 39191378 Free PMC article.
-
Neuroprotective Effect of a Multistrain Probiotic Mixture in SOD1G93A Mice by Reducing SOD1 Aggregation and Targeting the Microbiota-Gut-Brain Axis.Mol Neurobiol. 2024 Dec;61(12):10051-10071. doi: 10.1007/s12035-024-03988-x. Epub 2024 Feb 13. Mol Neurobiol. 2024. PMID: 38349516 Free PMC article.
-
Gut Microbiota Improve the Prediction of Stroke-Associated Pneumonia Risk and Outcomes in Acute Ischemic Stroke.Transl Stroke Res. 2025 Jun 12. doi: 10.1007/s12975-025-01363-z. Online ahead of print. Transl Stroke Res. 2025. PMID: 40500582
-
L- and D-Lactate: unveiling their hidden functions in disease and health.Cell Commun Signal. 2025 Mar 12;23(1):134. doi: 10.1186/s12964-025-02132-z. Cell Commun Signal. 2025. PMID: 40075490 Free PMC article. Review.
-
Differences in the Gut Microbiota Composition and Metabolites Associated With Feeding Intolerance in VLBW Infants With a Gestational Age of ≤ 30 Weeks: A Pilot Study.Front Cell Infect Microbiol. 2022 Feb 17;12:726322. doi: 10.3389/fcimb.2022.726322. eCollection 2022. Front Cell Infect Microbiol. 2022. PMID: 35252022 Free PMC article.
References
Publication types
MeSH terms
Substances
LinkOut - more resources
Full Text Sources
Medical
Miscellaneous