Changes in H3K27ac at Gene Regulatory Regions in Porcine Alveolar Macrophages Following LPS or PolyIC Exposure
- PMID: 32973863
- PMCID: PMC7468443
- DOI: 10.3389/fgene.2020.00817
Changes in H3K27ac at Gene Regulatory Regions in Porcine Alveolar Macrophages Following LPS or PolyIC Exposure
Abstract
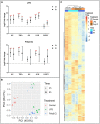
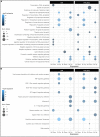
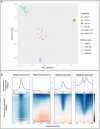
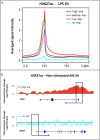
Changes in chromatin structure, especially in histone modifications (HMs), linked with chromatin accessibility for transcription machinery, are considered to play significant roles in transcriptional regulation. Alveolar macrophages (AM) are important immune cells for protection against pulmonary pathogens, and must readily respond to bacteria and viruses that enter the airways. Mechanism(s) controlling AM innate response to different pathogen-associated molecular patterns (PAMPs) are not well defined in pigs. By combining RNA sequencing (RNA-seq) with chromatin immunoprecipitation and sequencing (ChIP-seq) for four histone marks (H3K4me3, H3K4me1, H3K27ac and H3K27me3), we established a chromatin state map for AM stimulated with two different PAMPs, lipopolysaccharide (LPS) and Poly(I:C), and investigated the potential effect of identified histone modifications on transcription factor binding motif (TFBM) prediction and RNA abundance changes in these AM. The integrative analysis suggests that the differential gene expression between non-stimulated and stimulated AM is significantly associated with changes in the H3K27ac level at active regulatory regions. Although global changes in chromatin states were minor after stimulation, we detected chromatin state changes for differentially expressed genes involved in the TLR4, TLR3 and RIG-I signaling pathways. We found that regions marked by H3K27ac genome-wide were enriched for TFBMs of TF that are involved in the inflammatory response. We further documented that TF whose expression was induced by these stimuli had TFBMs enriched within H3K27ac-marked regions whose chromatin state changed by these same stimuli. Given that the dramatic transcriptomic changes and minor chromatin state changes occurred in response to both stimuli, we conclude that regulatory elements (i.e. active promoters) that contain transcription factor binding motifs were already active/poised in AM for immediate inflammatory response to PAMPs. In summary, our data provides the first chromatin state map of porcine AM in response to bacterial and viral PAMPs, contributing to the Functional Annotation of Animal Genomes (FAANG) project, and demonstrates the role of HMs, especially H3K27ac, in regulating transcription in AM in response to LPS and Poly(I:C).
Keywords: Poly(I:C); alveolar macrophages; chromatin state; histone modifications; lipopolysaccharide; pig; transcriptome.
Copyright © 2020 Herrera-Uribe, Liu, Byrne, Bond, Loving and Tuggle.
Figures


Similar articles
-
Genome-Wide Histone Modifications and CTCF Enrichment Predict Gene Expression in Sheep Macrophages.Front Genet. 2021 Jan 7;11:612031. doi: 10.3389/fgene.2020.612031. eCollection 2020. Front Genet. 2021. PMID: 33488675 Free PMC article.
-
Characterizing Genetic Regulatory Elements in Ovine Tissues.Front Genet. 2021 May 20;12:628849. doi: 10.3389/fgene.2021.628849. eCollection 2021. Front Genet. 2021. PMID: 34093640 Free PMC article.
-
Chromatin profiling and state predictions reveal insights into epigenetic regulation during early porcine development.Epigenetics Chromatin. 2024 May 21;17(1):16. doi: 10.1186/s13072-024-00542-w. Epigenetics Chromatin. 2024. PMID: 38773546 Free PMC article.
-
Transcriptome sequencing of microglial cells stimulated with TLR3 and TLR4 ligands.BMC Genomics. 2015 Jul 10;16(1):517. doi: 10.1186/s12864-015-1728-5. BMC Genomics. 2015. PMID: 26159724 Free PMC article.
-
Functionally Annotating Regulatory Elements in the Equine Genome Using Histone Mark ChIP-Seq.Genes (Basel). 2019 Dec 18;11(1):3. doi: 10.3390/genes11010003. Genes (Basel). 2019. PMID: 31861495 Free PMC article.
Cited by
-
Assessment of DNA methylation in porcine immune cells reveals novel regulatory elements associated with cell-specific gene expression and immune capacity traits.BMC Genomics. 2022 Aug 11;23(1):575. doi: 10.1186/s12864-022-08773-5. BMC Genomics. 2022. PMID: 35953767 Free PMC article.
-
Impacts of Epigenetic Processes on the Health and Productivity of Livestock.Front Genet. 2021 Feb 23;11:613636. doi: 10.3389/fgene.2020.613636. eCollection 2020. Front Genet. 2021. PMID: 33708235 Free PMC article. Review.
-
Porcine cis-acting lnc-CAST positively regulates CXCL8 expression through histone H3K27ac.Vet Res. 2024 May 7;55(1):56. doi: 10.1186/s13567-024-01296-9. Vet Res. 2024. PMID: 38715098 Free PMC article.
-
Transcriptome Analysis of Selenium-Treated Porcine Alveolar Macrophages Against Lipopolysaccharide Infection.Front Genet. 2021 Mar 4;12:645401. doi: 10.3389/fgene.2021.645401. eCollection 2021. Front Genet. 2021. PMID: 33747052 Free PMC article. No abstract available.
-
Integrative profiling of gene expression and chromatin accessibility elucidates specific transcriptional networks in porcine neutrophils.Front Genet. 2023 May 23;14:1107462. doi: 10.3389/fgene.2023.1107462. eCollection 2023. Front Genet. 2023. PMID: 37287538 Free PMC article.
References
LinkOut - more resources
Full Text Sources
Miscellaneous

