. 2020 Aug 21:10:1506.
doi: 10.3389/fonc.2020.01506. eCollection 2020.

Adipose Tissue Properties in Tumor-Bearing Breasts

Affiliations

Adipose Tissue Properties in Tumor-Bearing Breasts

Isabelle Miran et al. Front Oncol. .

Abstract

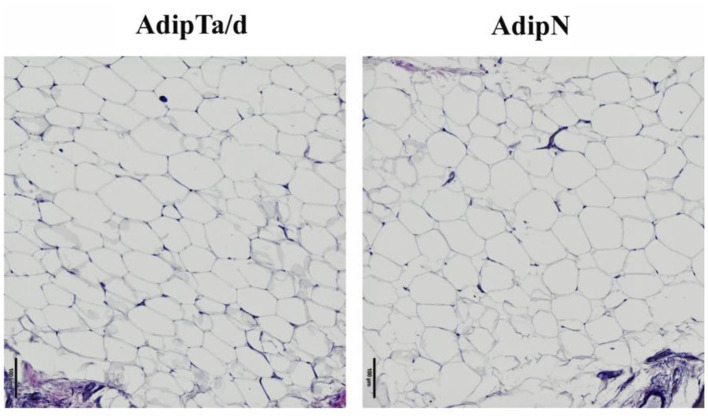
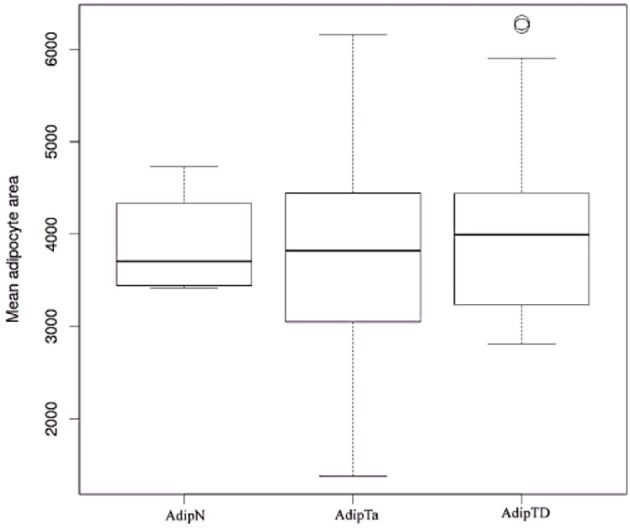
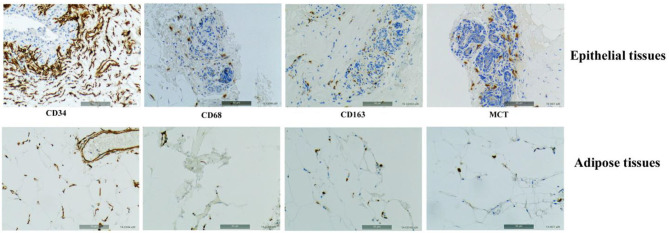
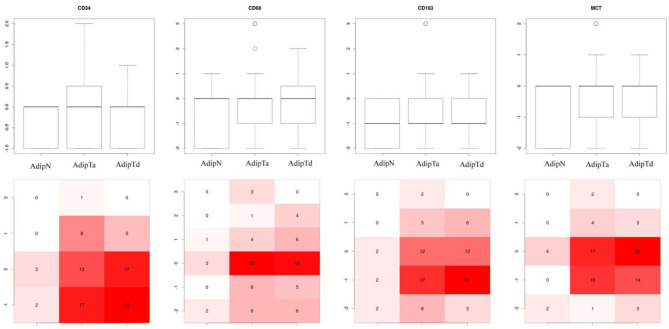
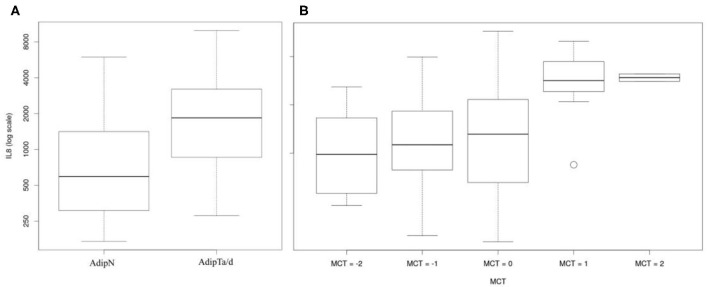
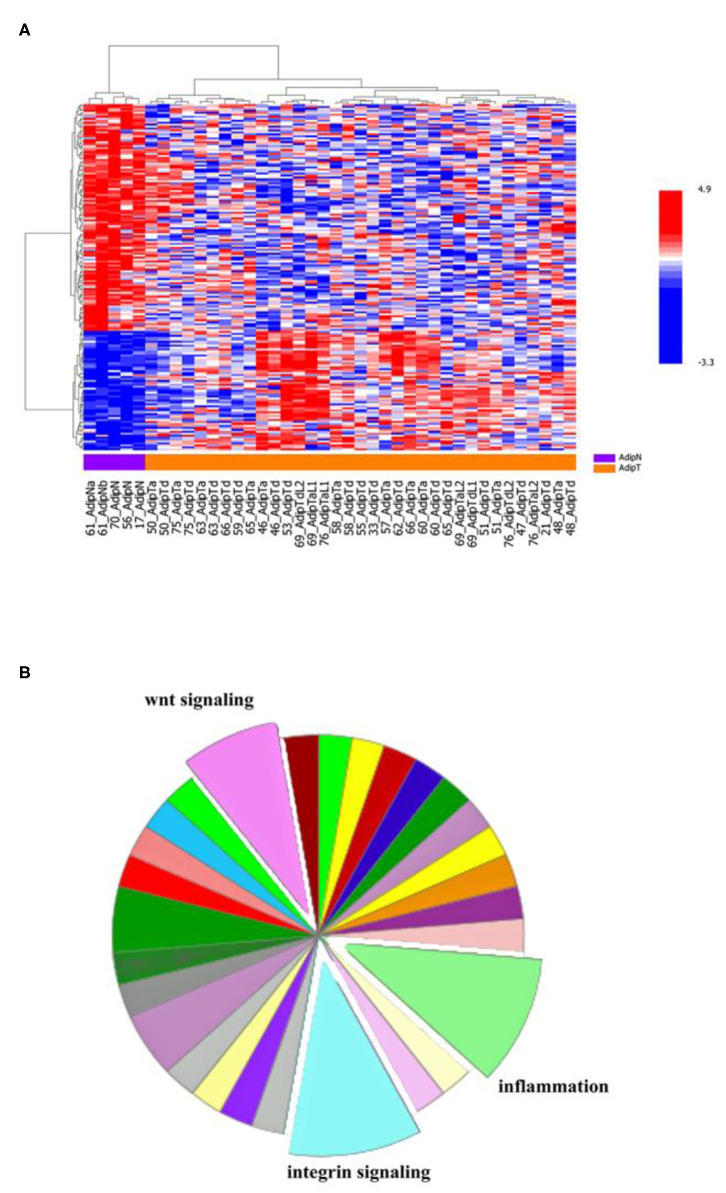
The tissue stroma plays a major role in tumors' natural history. Most programs for tumor progression are not activated as cell-autonomous processes but under the conditions of cross-talks between tumor and stroma. Adipose tissue is a major component of breast stroma. This study compares adipose tissues in tumor-bearing breasts to those in tumor-free breasts with the intention of defining a signature that could translate into markers of cancer risk. In tumor-bearing breasts, we sampled adipose tissues adjacent to, or distant from the tumor. Parameters studied included: adipocytes size and density, immune cell infiltration, vascularization, secretome and gene expression. Adipose tissues from tumor-bearing breasts, whether adjacent to or distant from the tumor, do not differ from each other by any of these parameters. By contrast, adipose tissues from tumor-bearing breasts have the capacity to secrete twice as much interleukin 8 (IL-8) than those from tumor-free breasts and differentially express a set of 137 genes of which a significant fraction belongs to inflammation, integrin and wnt signaling pathways. These observations show that adipose tissues from tumor-bearing breasts have a distinct physiological status from those from tumor-free breasts. We propose that this constitutive status contributes as a non-cell autonomous process to determine permissiveness for tumor growth.

Keywords: IL-8; adipose tissue; breast cancer; non-cell autonomous; permissive cancer niche.


Figures

Figure 1
Figure 1
Representative images of adipose tissues from AdipN (tumor-free breasts) and AdipTa or AdipTd (tumor-bearing breasts).
Figure 2
Figure 2
Box plots images: Boxplots comparing sizes of adipocytes in AdipN vs. AdipTa and AdipTd.
Figure 3
Figure 3
Representatives IHC images of adipose tissues and epithelial tissues (as controls) stained, respectively, with C34 predominantly staining endothelial cell membranes, Anti-human CD68 staining monocyte/macrophage, Anti-human CD163 specific to the monocytic-macrophage lineage, and Anti-human Mast Cell Tryptase (MCT).
Figure 4
Figure 4
Box plots of distribution of IHC markers in the three sets of samples. AdipN, adipose tissues from tumor-free breasts; AdipTa, adipose tissues adjacent to cancer; AdipTd, adiposes tissue distant from cancer from the same breast as AdipTa. The bottom part of the figure represents the distribution of IHC scores. The intensity of the color (from white, pink to full red) increases with the fraction of samples in each scoring zone.
Figure 5
Figure 5
IL-8 secretome analyses: (A) Boxplot comparing the secretion capacities of IL-8 by non-tumor-bearing samples (AdipN) and tumor-bearing samples (AdipTa/d). (B) Boxplots illustrating the correlations between the capacity to secrete IL-8 and MCT the level estimated by IHC.
Figure 6
Figure 6
Expression profiles in adipose tissues from tumor-free vs. tumor-bearing breasts. (A) HeatMap: Analysis performed on one set of breast adipose tissues sampled from a single batch of tumor-bearing 40 breasts. They include 14 AdipTa and 21 AdipTd samples. One set of AdipN samples (n = 5 samples) were from tumor-free breasts. The HeatMap illustrates an unsupervised analysis (ward method) on the basis of the 177 probes defined by the differential expression at a parametric p-value of 0.001, between tumor–bearing (AdipTa+AdipTd) and normal (AdipN) samples. (B) Panther pathways analysis: the pie chart is the result of an analysis of pathways for the 137 differential genes as referenced in the Materials and Methods section.

References

    1. Wu S, Powers S, Zhu W, Hannun YA. Substantial contribution of extrinsic risk factors to cancer development. Nature. (2016) 529:43–7. 10.1038/nature16166 - DOI - PMC - PubMed
    1. La Merrill M, Emond C, Kim MJ, Antignac JP, Le Bizec B, Clement K, et al. . Toxicological function of adipose tissue: focus on persistent organic pollutants. Environ Health Perspect. (2013) 121:162–9. 10.1289/ehp.1205485 - DOI - PMC - PubMed
    1. Dongre A, Weinberg RA. New insights into the mechanisms of epithelial-mesenchymal transition and implications for cancer. Nat Rev Mol Cell Biol. (2019) 20:69–84. 10.1038/s41580-018-0080-4 - DOI - PubMed
    1. Lochhead P, Chan AT, Nishihara R, Fuchs CS, Beck AH, Giovannucci E, et al. . Etiologic field effect: reappraisal of the field effect concept in cancer predisposition and progression. Modern Pathol. (2015) 28:14–29. 10.1038/modpathol.2014.81 - DOI - PMC - PubMed
    1. Elenbaas B, Weinberg RA. Heterotypic signaling between epithelial tumor cells and fibroblasts in carcinoma formation. Exp Cell Res. (2001) 264:169–84. 10.1006/excr.2000.5133 - DOI - PubMed