. 2020 Aug 19:8:979.
doi: 10.3389/fbioe.2020.00979. eCollection 2020.

Two-Dimensional Shear Wave Elastography of Normal Soft Tissue Organs in Adult Beagle Dogs; Interobserver Agreement and Sources of Variability

Affiliations

Two-Dimensional Shear Wave Elastography of Normal Soft Tissue Organs in Adult Beagle Dogs; Interobserver Agreement and Sources of Variability

Jin-Woo Jung et al. Front Bioeng Biotechnol. .

Abstract

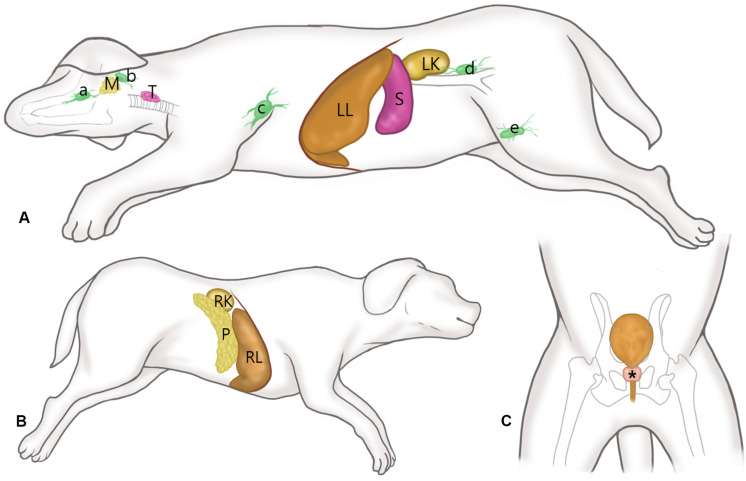
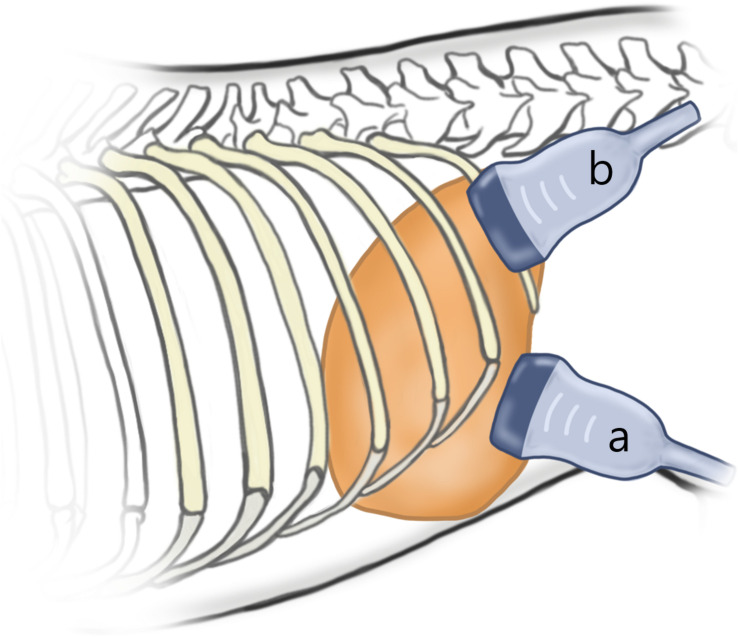
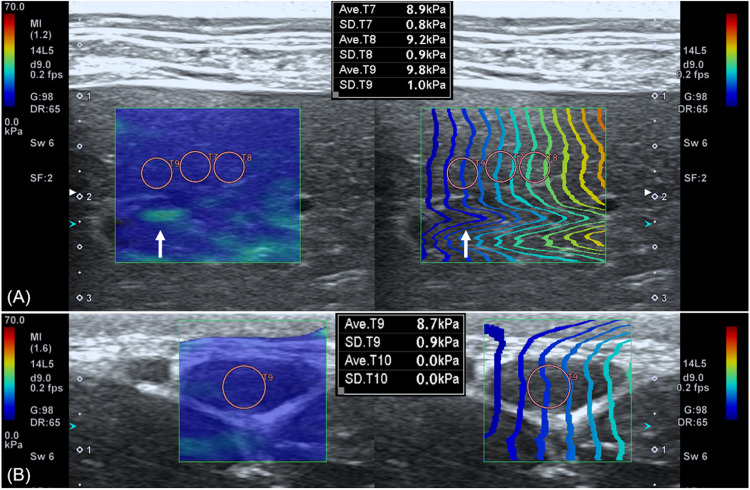
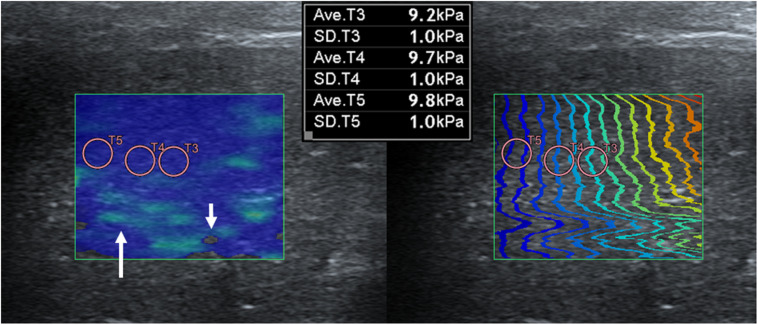
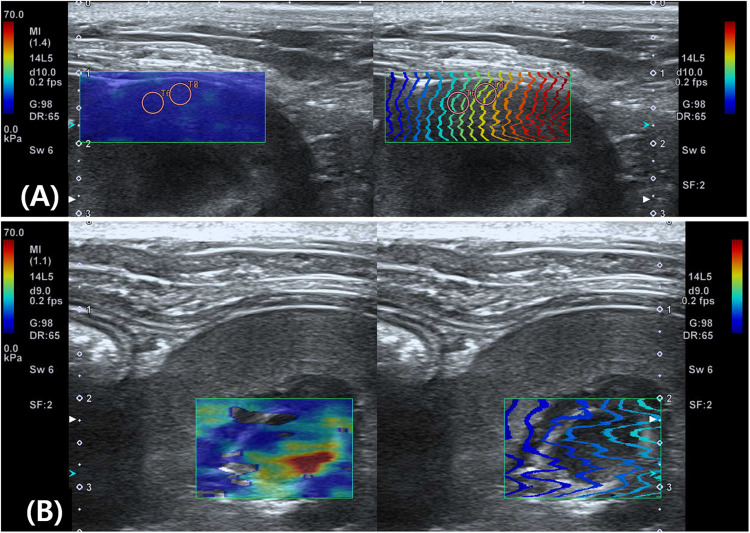
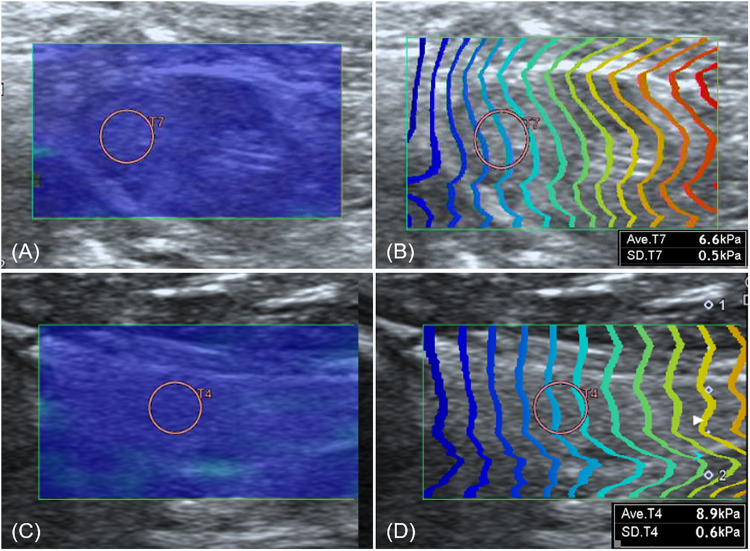
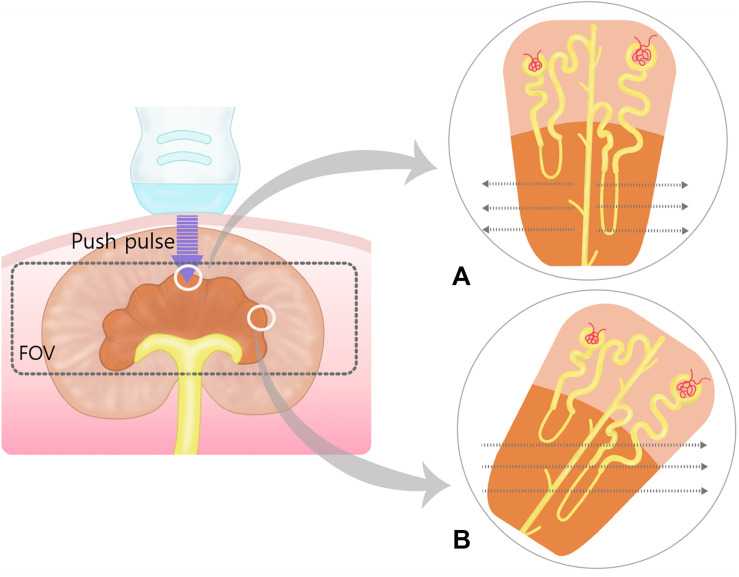
Shear wave elastography (SWE) induces lateral shear wave through acoustic pulses of the transducer and evaluates tissue stiffness quantitatively. This study was performed to evaluate feasibility and reproducibility of two-dimensional shear wave elastography (2D SWE) for evaluation of tissue stiffness and to examine technical factors that affect shear wave speed (SWS) measurements in adult dogs. Nine healthy, 2 year-old, adult beagles with the median weight of 9.8 kg were included. In this prospective, experimental, exploratory study, 2D SWE (Aplio 600) from the liver, spleen, kidneys, pancreas, prostate, lymph nodes (submandibular, retropharyngeal, axillary, medial iliac, and inguinal), submandibular salivary gland, and thyroid was performed in anesthetized beagles. Color map was drawn and SWS of each SWE were measured as Young's modulus (kPa) and shear wave velocity (m/s). The effect of measuring site, scan approach, depth, and anesthesia on SWE was assessed in abdominal organs by two observers independently. A total of 27 SWE examinations were performed in 12 organs by each observer. All SWS measurements were preformed successfully; however, SWE in the renal medulla could not be successfully conducted, and it was excluded from further analysis. Interobserver agreement of SWE was moderate to excellent in all organs, except for the left liver lobe at 10-15 mm depth with the intercostal scan. In the liver, there was no significant effect of the measuring site and scan approach on SWE. SWS of the liver and spleen tended to be higher with increasing the depth, but no significant difference. However, anesthesia significantly increased tissue stiffness in the spleen compared to awake dog regardless of the depth (P < 0.05). There was a significant difference in SWS according to the measuring site in the kidneys and pancreas (P < 0.001). 2D SWE was feasible and highly reproducible for the estimation of tissue stiffness in dogs. Measuring site and anesthesia are sources of variability affecting SWE in abdominal organs. Therefore, these factors should be considered during SWS measurement in 2D SWE. This study provides basic data for further studies on 2D SWE on pathological conditions that may increase tissue stiffness in dogs.

Keywords: dog; elastography; reproducibility; shear wave; two dimensional.


Figures

FIGURE 1
FIGURE 1
Schematic representations of the canine anatomy with indication of the examined soft tissue organs. (A) After placing the dogs in right lateral recumbency, shear wave elastography (SWE) of the submandibular (a), retropharyngeal (b), axillary (c), inguinal (d) and medial iliac (e) lymph nodes, submandibular salivary gland (M), thyroid (T), spleen (S), left liver lobe (LL), and left kidney (LK) was performed in the left side for each dog, while maintaining the vertical angle of the probe to the organ. (B) With the dog positioned in left lateral recumbency, SWE of the pancreas (P), right liver lobe (RL), and right kidney (RK) were performed. (C) SWE in the prostate (*) was conducted in the right and left lobes in the transverse images with the dog in dorsal recumbency.
FIGURE 2
FIGURE 2
Schematic representation of the probe position according to the approach. For subcostal approach (a), the ultrasound probe is placed under the ribs. For intercostal approach (b), the probe was placed parallel to and within the intercostal space, and sufficient gel was applied to minimize rib shadowing.
FIGURE 3
FIGURE 3
Shear wave elastography in the liver (A) and submandibular lymph node (B). A dual-screen mode shows a color map on the left side and propagation map on the right of the view (rectangular boxes). On color maps, red color represents high shear wave velocity and blue low velocity. Propagation maps show multiple contour line depicting shear wave arrival time at different location. (A) In the liver, circular regions of interest (ROIs) with 3 mm diameter are placed over the region where uniform blue color on color map and parallel contour lines with constant interval on propagation map are observed. Care was taken not to place ROI over the region (arrow) displayed as green color in the color map and distorted contour line in the propagation map. (B) In the submandibular lymph node, a 2 mm diameter ROI not to exceed the target organ is used.
FIGURE 4
FIGURE 4
Elastographic images in the liver. Near field, the region at 5–10 mm depth from the liver capsule, has uniform blue color in the color map and contour lines with constant intervals in the propagation map. Far field, the region at 10–15 mm depth from the liver capsule, appeared heterogeneously in the color map with focal green color (long arrow) and block spots (short arrow) presenting signal void and distorted contour lines in the propagation map.
FIGURE 5
FIGURE 5
Elastographic images of the kidney. On shear wave elastography (SWE) of the renal cortex (A) shows homogeneous blue color in the color map and constant contour lines in the propagation map, whereas SWE of the renal medulla (B) shows heterogeneity with various colors and severe distortion of contour lines in the propagation map.
FIGURE 6
FIGURE 6
Elastographic images of the axillary lymph node (A,B) and thyroid (C,D). Both the axillary lymph node and thyroid show uniform blue color in the color map (A,C) and constant intervals of contour lines in the propagation map (B,D).
FIGURE 7
FIGURE 7
Schematic representation of the push pulse and shear wave in the renal medulla. Within field of view (FOV), the shear waves (dotted arrows) propagate perpendicular to the push pulse. (A) When push pulses are sent parallel to the renal medulla, shear waves propagate orthogonally to the loops of Henle and collecting ducts at lower speeds due to more biological interfaces. (B) In oblique manner, shear waves will travel at higher speed than in (A) because of less biological interfaces. The oblique and perpendicular anisotropy within the renal medulla results in heterogenous shear wave speed within the field of view.

Similar articles

Cited by

References

    1. Arslan S., Durmaz M. S., Erdogan H., Esmen S. E., Turgut B., Iyisoy M. S. (2020). Two-dimensional shear wave elastography in the assessment of salivary gland involvement in primary Sjögren’s syndrome. J. Ultrasound Med. 39 949–956. 10.1002/jum.15179 - DOI - PubMed
    1. Asano K., Ogata A., Tanaka K., Ide Y., Sankoda A., Kawakita C., et al. (2014). Acoustic radiation force impulse elastography of the kidneys: is shear wave velocity affected by tissue fibrosis or renal blood flow? J. Ultrasound Med. 33 793–801. 10.7863/ultra.33.5.793 - DOI - PubMed
    1. Avante L. M., Rossi F. M. A., Ramirez U. R. A., Cristina M. M., Aguila S. P. D., Ricardo P., et al. (2020). Pancreatic evaluation in dogs using different ultrasonographic techniques – preliminary results. Acta Vet. 70 255–266. 10.2478/acve-2020-0018 - DOI
    1. Barr R. G., Cosgrove D., Brock M., Cantisani V., Correas J. M., Postema A. W., et al. (2017). WFUMB guidelines and recommendations on the clinical use of ultrasound elastography: part 5. Prostate. Ultrasound Med. Biol. 43 27–48. 10.1016/j.ultrasmedbio.2016.06.020 - DOI - PubMed
    1. Barr R. G., Ferraioli G., Palmeri M. L., Goodman Z. D., Garciataso G., Rubin J., et al. (2015a). Elastography assessment of liver fibrosis: society of radiologists in ultrasound consensus conference statement. Radiology 276 845–861. 10.1148/radiol.2015150619 - DOI - PubMed

LinkOut - more resources