

Low-Cost, Large-Scale Production of the Anti-viral Lectin Griffithsin
- PMID: 32974328
- PMCID: PMC7471252
- DOI: 10.3389/fbioe.2020.01020
Low-Cost, Large-Scale Production of the Anti-viral Lectin Griffithsin
Abstract
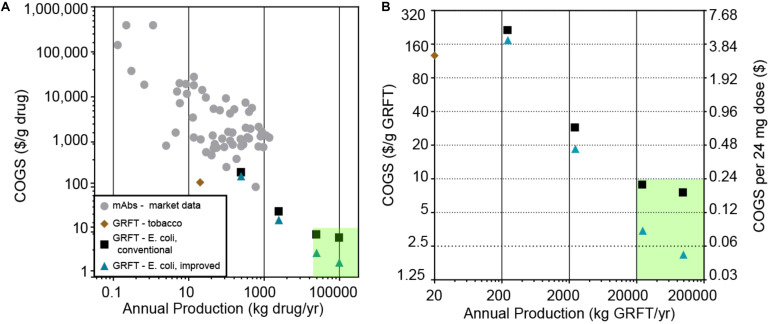
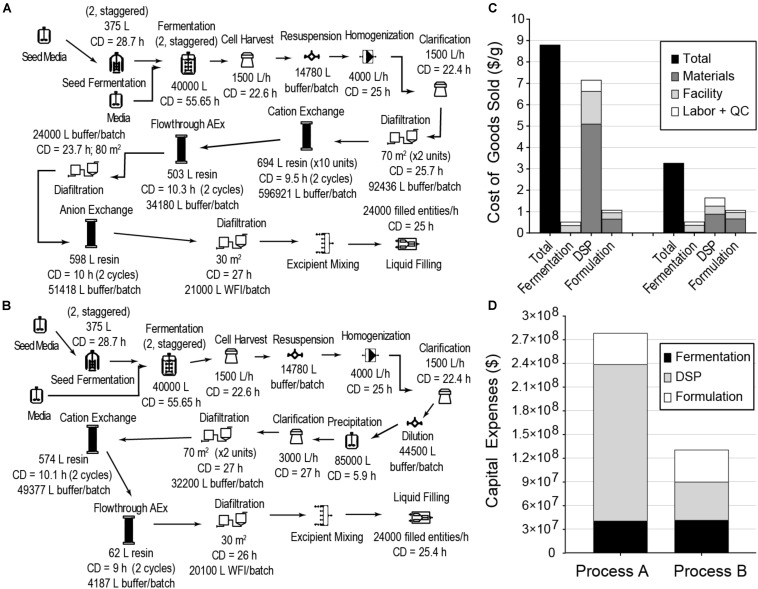
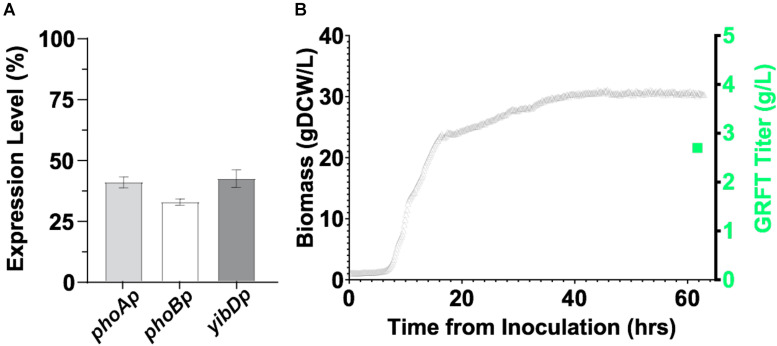
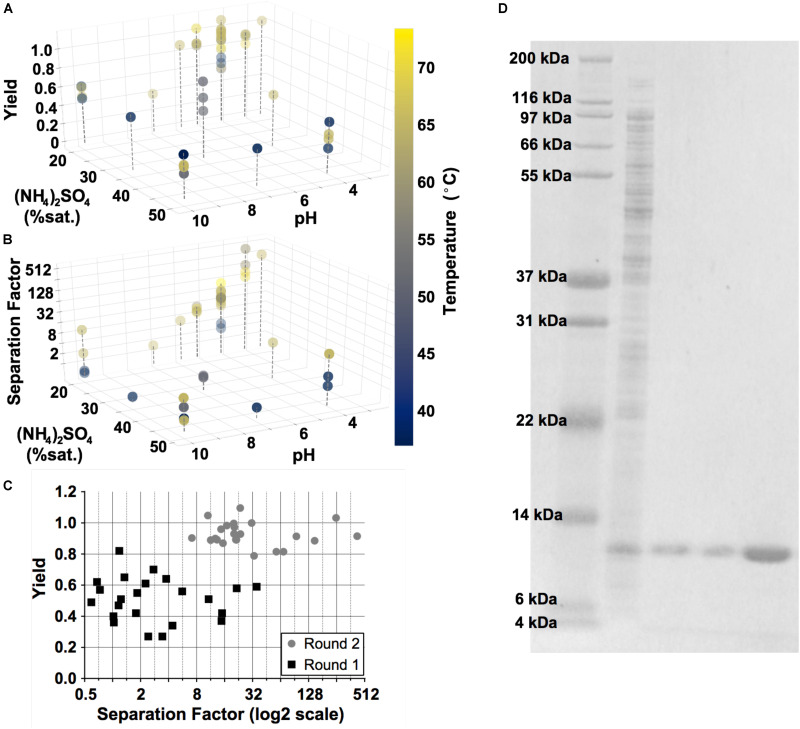
Griffithsin, a broad-spectrum antiviral lectin, has potential to prevent and treat numerous viruses including HIV, HCV, HSV, SARS-CoV, and SARS-CoV-2. For these indications, the annual demand for Griffithsin could reach billions of doses and affordability is paramount. We report the lab-scale validation of a bioprocess that supports production volumes of >20 tons per year at a cost of goods sold below $3,500/kg. Recombinant expression in engineered E. coli enables Griffithsin titers ∼2.5 g/L. A single rapid precipitation step provides > 90% yield with 2-, 3-, and 4-log reductions in host cell proteins, endotoxin, and nucleic acids, respectively. Two polishing chromatography steps remove residual contaminants leading to pure, active Griffithsin. Compared to a conventional one this process shows lower costs and improved economies of scale. These results support the potential of biologics in very large-scale, cost-sensitive applications such as antivirals, and highlight the importance of bioprocess innovations in enabling these applications.
Keywords: SARS-CoV-2; antiviral; biologics manufacturing; downstream recovery; griffithsin.
Copyright © 2020 Decker, Menacho-Melgar and Lynch.
Figures
Similar articles
-
Technoeconomic Modeling of Plant-Based Griffithsin Manufacturing.Front Bioeng Biotechnol. 2018 Jul 24;6:102. doi: 10.3389/fbioe.2018.00102. eCollection 2018. Front Bioeng Biotechnol. 2018. PMID: 30087892 Free PMC article.
-
Integrated autolysis, DNA hydrolysis and precipitation enables an improved bioprocess for Q-Griffithsin, a broad-spectrum antiviral and clinical-stage anti-COVID-19 candidate.Biochem Eng J. 2022 Apr;181:108403. doi: 10.1016/j.bej.2022.108403. Epub 2022 Mar 12. Biochem Eng J. 2022. PMID: 35308834 Free PMC article.
-
Integrated Autolysis, DNA Hydrolysis and Precipitation Enables an Improved Bioprocess for Q-Griffithsin, a Broad-Spectrum Antiviral and Clinical-Stage anti-COVID-19 Candidate.bioRxiv [Preprint]. 2022 Jan 3:2021.12.30.474602. doi: 10.1101/2021.12.30.474602. bioRxiv. 2022. Update in: Biochem Eng J. 2022 Apr;181:108403. doi: 10.1016/j.bej.2022.108403. PMID: 35018377 Free PMC article. Updated. Preprint.
-
Bulk production of the antiviral lectin griffithsin.Plant Biotechnol J. 2015 Oct;13(8):1160-8. doi: 10.1111/pbi.12433. Epub 2015 Jul 14. Plant Biotechnol J. 2015. PMID: 26176205 Free PMC article. Review.
-
Griffithsin: An Antiviral Lectin with Outstanding Therapeutic Potential.Viruses. 2016 Oct 24;8(10):296. doi: 10.3390/v8100296. Viruses. 2016. PMID: 27783038 Free PMC article. Review.
Cited by
-
An algal lectin griffithsin inhibits Hantaan virus infection in vitro and in vivo.Front Cell Infect Microbiol. 2022 Dec 12;12:881083. doi: 10.3389/fcimb.2022.881083. eCollection 2022. Front Cell Infect Microbiol. 2022. PMID: 36579342 Free PMC article.
-
Production of Recombinant Monoclonal Antibodies in the Egg White of Gene-Targeted Transgenic Chickens.Genes (Basel). 2020 Dec 30;12(1):38. doi: 10.3390/genes12010038. Genes (Basel). 2020. PMID: 33396657 Free PMC article.
-
Algal and Cyanobacterial Lectins and Their Antimicrobial Properties.Mar Drugs. 2021 Dec 1;19(12):687. doi: 10.3390/md19120687. Mar Drugs. 2021. PMID: 34940686 Free PMC article. Review.
-
Bioprocessing and the Production of Antiviral Biologics in the Prevention and Treatment of Viral Infectious Disease.Vaccines (Basel). 2023 May 17;11(5):992. doi: 10.3390/vaccines11050992. Vaccines (Basel). 2023. PMID: 37243096 Free PMC article. Review.
-
The direct and indirect effects of bioactive compounds against coronavirus.Food Front. 2022 Mar;3(1):96-123. doi: 10.1002/fft2.119. Epub 2021 Dec 8. Food Front. 2022. PMID: 35462942 Free PMC article. Review.
References
-
- Barton C., Kouokam J. C., Lasnik A. B., Foreman O., Cambon A., Brock G., et al. (2014). Activity of and effect of subcutaneous treatment with the broad- Spectrum antiviral lectin griffithsin in two laboratory rodent models. Antimicrob. Agents Chemother. 58 120–127. 10.1128/aac.01407-13 - DOI - PMC - PubMed
Grants and funding
LinkOut - more resources
Full Text Sources
Other Literature Sources
Research Materials
Miscellaneous