. 2020 Aug 21:8:771.
doi: 10.3389/fcell.2020.00771. eCollection 2020.

CXCL12-CXCR4 Interplay Facilitates Palatal Osteogenesis in Mice

Affiliations

CXCL12-CXCR4 Interplay Facilitates Palatal Osteogenesis in Mice

Nanne Verheijen et al. Front Cell Dev Biol. .

Abstract

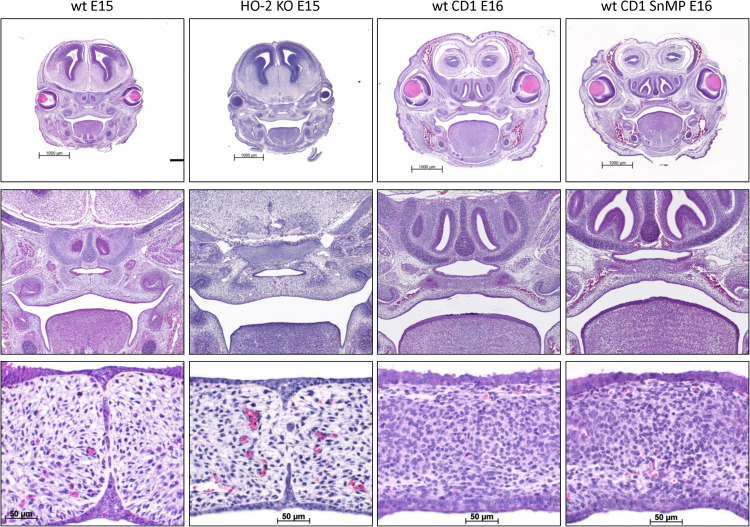
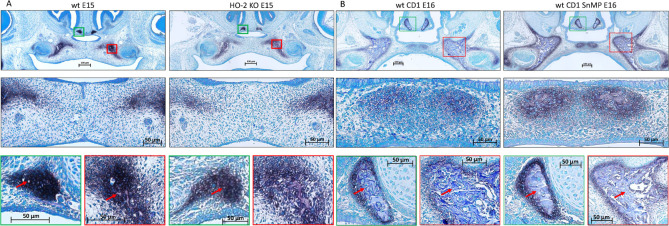
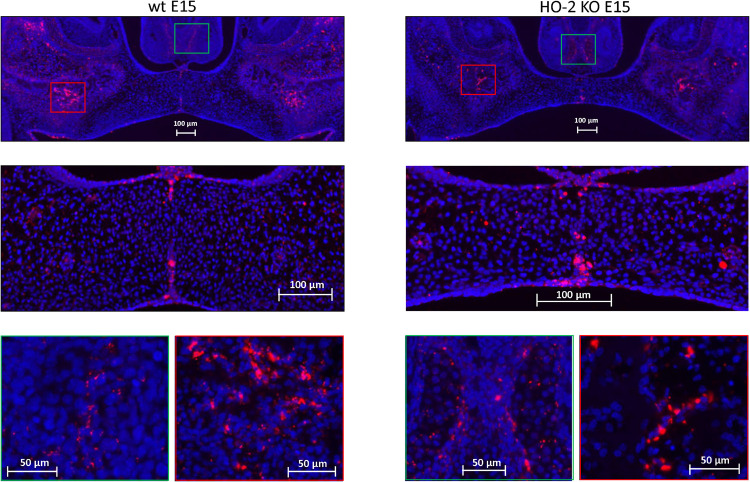
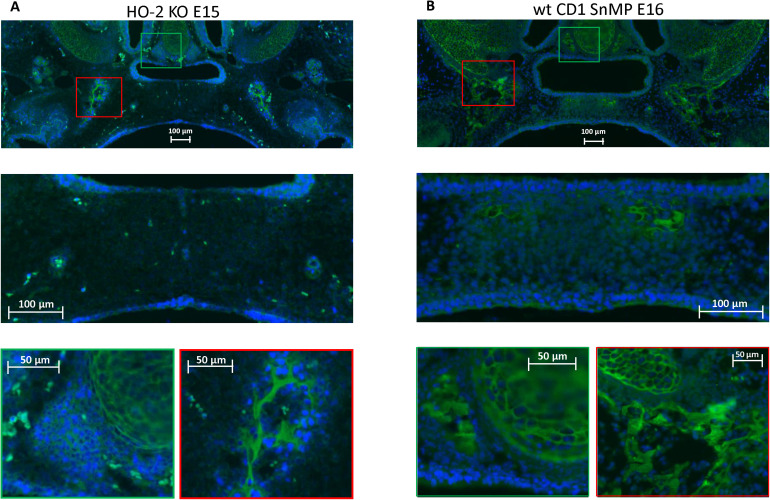
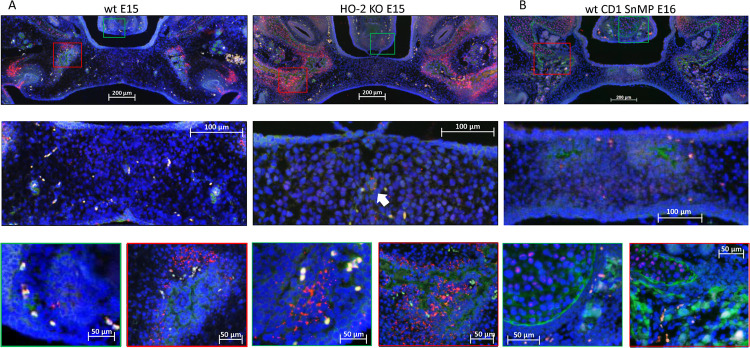
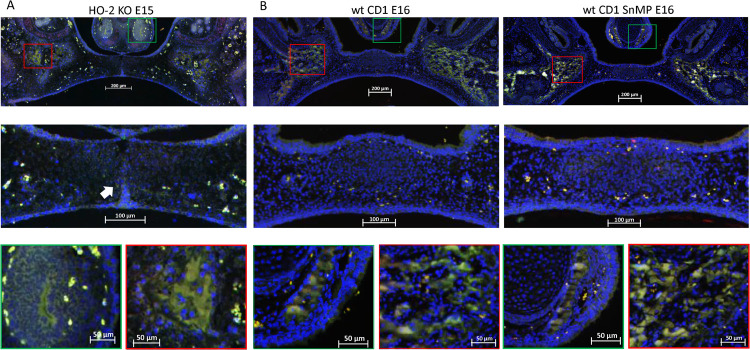
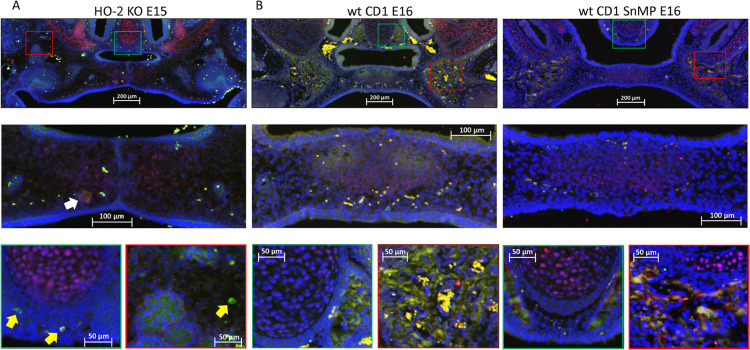
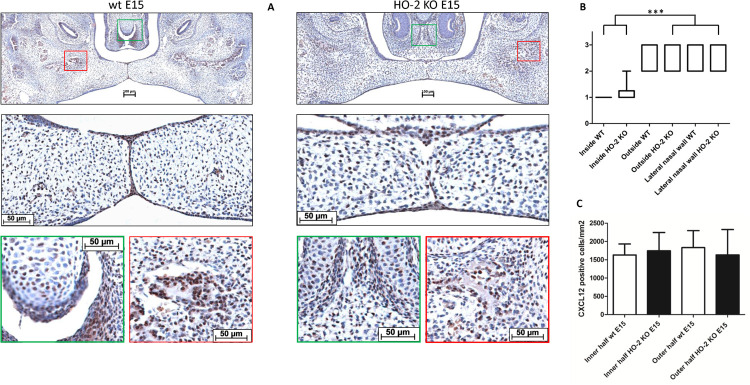
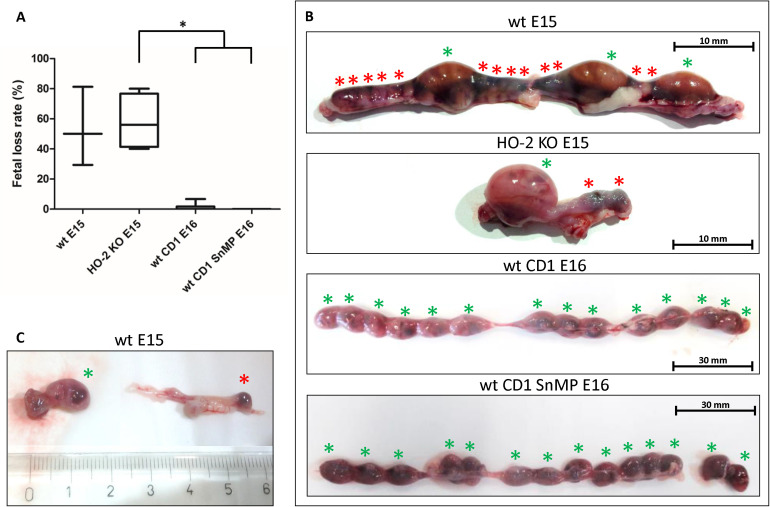
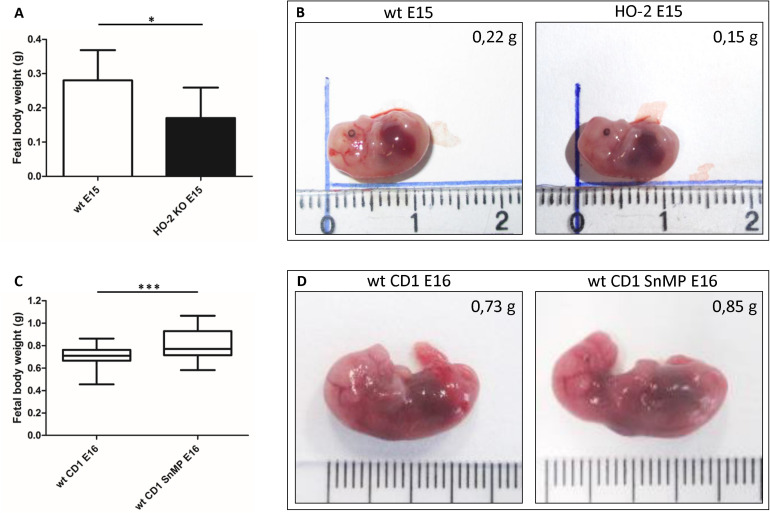
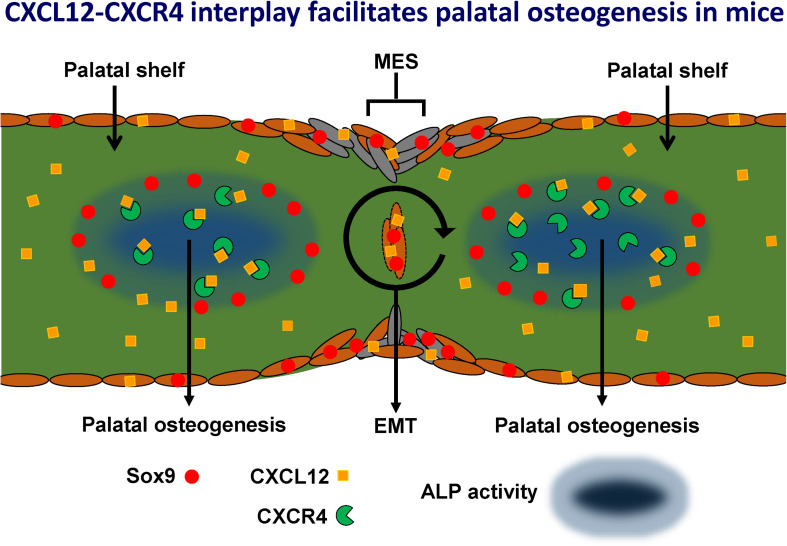
Cranial neural crest cells (CNCCs), identified by expression of transcription factor Sox9, migrate to the first branchial arch and undergo proliferation and differentiation to form the cartilage and bone structures of the orofacial region, including the palatal bone. Sox9 promotes osteogenic differentiation and stimulates CXCL12-CXCR4 chemokine-receptor signaling, which elevates alkaline phosphatase (ALP)-activity in osteoblasts to initiate bone mineralization. Disintegration of the midline epithelial seam (MES) is crucial for palatal fusion. Since we earlier demonstrated chemokine-receptor mediated signaling by the MES, we hypothesized that chemokine CXCL12 is expressed by the disintegrating MES to promote the formation of an osteogenic center by CXCR4-positive osteoblasts. Disturbed migration of CNCCs by excess oxidative and inflammatory stress is associated with increased risk of cleft lip and palate (CLP). The cytoprotective heme oxygenase (HO) enzymes are powerful guardians harnessing injurious oxidative and inflammatory stressors and enhances osteogenic ALP-activity. By contrast, abrogation of HO-1 or HO-2 expression promotes pregnancy pathologies. We postulate that Sox9, CXCR4, and HO-1 are expressed in the ALP-activity positive osteogenic regions within the CNCCs-derived palatal mesenchyme. To investigate these hypotheses, we studied expression of Sox9, CXCL12, CXCR4, and HO-1 in relation to palatal osteogenesis between E15 and E16 using (immuno)histochemical staining of coronal palatal sections in wild-type (wt) mice. In addition, the effects of abrogated HO-2 expression in HO-2 KO mice and inhibited HO-1 and HO-2 activity by administrating HO-enzyme activity inhibitor SnMP at E11 in wt mice were investigated at E15 or E16 following palatal fusion. Overexpression of Sox9, CXCL12, CXCR4, and HO-1 was detected in the ALP-activity positive osteogenic regions within the palatal mesenchyme. Overexpression of Sox9 and CXCL12 by the disintegrating MES was detected. Neither palatal fusion nor MES disintegration seemed affected by either HO-2 abrogation or inhibition of HO-activity. Sox9 progenitors seem important to maintain the CXCR4-positive osteoblast pool to drive osteogenesis. Sox9 expression may facilitate MES disintegration and palatal fusion by promoting epithelial-to-mesenchymal transformation (EMT). CXCL12 expression by the MES and the palatal mesenchyme may promote osteogenic differentiation to create osteogenic centers. This study provides novel evidence that CXCL12-CXCR4 interplay facilitates palatal osteogenesis and palatal fusion in mice.

Keywords: CXCL12-CXCR4; Sox9; cranial neural crest cells; embryology; heme oxygenase; osteogenesis; palatogenesis; pathological pregnancy.


Figures

FIGURE 1
FIGURE 1
Isolation of the uteri and mice fetuses. After sacrifice of the plugged mice the uteri were isolated: (A) wt E15 mouse. (B) wt E15 mouse, (C) wt CD1 SnMP E16 mouse, (D,E) HO-2 KO E15 mouse. (F) Isolation of the fetuses from the uterus of a HO-2 KO E15 mouse. Left panel: Uterus containing 6 fetuses (green asterisks) in total. Middle panel: After removal of the fetuses five resorptions (red asterisks) were found (centimeter ruler). Right panel: Overview of the six isolated fetuses with placenta (green asterisks).
FIGURE 2
FIGURE 2
Palatal epithelium classification. (A) Coronal palatal section, e.g., HO-2 KO E15. (B) For each section the palatal epithelial layers were subdivided into three regions of interest according to morphological characteristics: (Inside) epithelium of the palatal shelves from the edge, including the MES, to half of the width of the shelves (in red); (Outside) epithelium of the lateral half of the palatal shelves (in blue); (Lateral nasal wall) epithelium of the lateral wall of the nasal cavity, this region is positioned outside the palatal shelves and served as a control region (in yellow). Immunoreactivity scoring scale: Semi-quantitative scoring of CXCL12 immunoreactivity within the epithelial regions according to the following scale: HIGH, immunoreactivity present in almost the entire epithelial region; MODERATE, immunoreactivity present only partially in the epithelial region; LOW, almost no immunoreactivity present in the epithelial region. Immunoreactivity scored for the three regions of interest in a CXCL12 immunostained section. (C) Inside region was scored as HIGH, in red. (D) Outside region was scored as MODERATE, in blue. Lateral nasal wall region was scored as LOW, in yellow.
FIGURE 3
FIGURE 3
Palatal shelf cross-sectional surface measurement determining the number of CXCL12-positive immunostained cells/mm2 within the mesenchyme. (A) The individual cross-sectional surface of the inner half (in green) and outer half (in orange) of each palatal shelf was measured. (B) A square scale bar was drawn in the microscopic picture of 1,000×1,000 μm (mm2) and the total number of pixels was determined (e.g., HO-2 KO E15: 1 mm2 = 635,000 pixels), data not shown. The contour of the mesenchyme was drawn (yellow line). The number of pixels for this area was determines by the Fiji Image J 1.51n software (10,424 pixels). The number of CXCL12-positive stained cells within this mesenchymal area of the palatal shelves was counted (e.g., inner half contains 31 CXCL12-positive cells. The number of cells/mm2 was calculated (635,000/10,424 × 31 = 1888 cells/mm2).
FIGURE 4
FIGURE 4
MES disintegration despite HO-2 abrogation and palatal fusion despite HO-activity inhibition from E11. In the HE-stained coronal palatal sections of the wt E15 and HO-2 KO E15 fetuses, the palatal shelves were attached and disintegration of the MES was found. In the HE-stained coronal palatal sections from wt CD1 E16 and wt CD1 SnMP E16 fetuses, the palatal shelves were fused. Representative palatal section per group was shown.
FIGURE 5
FIGURE 5
Palatal osteogenesis during MES disintegration: (A) Upper panel: Histochemical stained coronal palatal section for ALP-activity, representative for the wt E15 and HO-2 KO E15 fetuses. Middle panel: Magnification of the central part of the fusing palate including the MES. The palatal mesenchymal cells demonstrated positive staining for ALP-activity. Green panel: Magnification of the nasal septum. A cluster of ALP-activity positive-stained mesenchymal cells was found in the region lateral from the nasal septum including some small bone matrix depositions (red arrow). Red panel: Magnification of the lateral part of the palatal shelve. A cluster of ALP-positive stained mesenchymal cells was found including small bone matrix depositions (red arrow). (B) Upper panel: Histochemical stained sections through the maxilla for ALP-activity, representative for the wt CD1 E16 and wt CD1 SnMP E16 fetuses. Middle panel: Magnification of the central part of the fusing palate. A cluster of ALP-positive stained mesenchymal cells including bone matrix depositions was found at the former location of the MES and was regarded as an osteogenic center. Green panel: Magnification of the nasal septum. A cluster of ALP-positive-stained mesenchymal cells surrounding a large area of bone matrix deposition (red arrow) was found. Red panel: Magnification of the lateral part of the palatal shelve. A cluster of ALP-positive-stained mesenchymal cells in the lateral part of the fusing palate surrounding a large area of bone matrix deposition (red arrow) was found.
FIGURE 6
FIGURE 6
Sox9 expressing cells in the MES and the palatal osteogenic centers. Upper panels: Fluorescent immunohistochemical-stained coronal palatal sections for Sox9-activity (red), representative for the wt E15 fetuses and HO-2 KO E15 fetuses. Middle panels: Strong Sox9 expressing cells (red) were found in the remnants of the MES. Green panels: Sox9 expressing mesenchymal cells were present in the osteogenic centers at the oral side of the forming nasal septum, and also in the cartilage of the nasal septum. Red panels: The osteogenic centers in the lateral parts of the fusing palate demonstrated clusters of strong Sox9 expressing cells.
FIGURE 7
FIGURE 7
CXCR4 expressing cells in the palatal osteogenic centers. (A) Upper panel: Fluorescent immunohistochemical-stained coronal palatal section for CXCR4 expression (green), representative for the wt E15 and HO-2 KO E15, e.g., HO-2 KO. Middle panel: Within the disintegrating MES almost no CXCR4 expressing cells were found. Green panel: Near the forming nasal septum clusters of strong CXCR4 expressing cells were found. Also within the cartilage of the forming nasal septum CXCR4 expressing cells were present. Red panel: The osteogenic centers in the lateral parts of the fusing palate demonstrated clusters of strong CXCR4 expressing cells. (B) Upper panel: Fluorescent immunohistochemical stained coronal palatal section for CXCR4 expression (green), representative for the wt CD1 E16 and wt CD1 SnMP E16 fetuses, e.g., wt CD1 SnMP E16. Middle panel: in the osteogenic centers in the central part of the fusing palate clusters of CXCR4-positive-stained mesenchymal cells were found. Green panel: Near the forming nasal septum clusters of strong CXCR4 expressing cells were found. Also within the cartilage of the forming nasal septum CXCR4 expressing cells were present. Red panel: The osteogenic centers in the lateral parts of the fusing palate demonstrated clusters of strong CXCR4 expressing cells.
FIGURE 8
FIGURE 8
Most CXCR4-positive cells in the palatal osteogenic centers are not positive for Sox9. (A) Upper panel: Fluorescent immunohistochemical double-stained coronal palatal section for Sox9 (red) with CXCR4 (green), representative for the wt E15 and HO-2 KO E15 fetuses. Middle panel: Near the disintegrating MES only a few Sox9-CXCR4 double-positive stained cells (white arrow) were found. Green panel: In the osteogenic centers near the forming nasal septum clusters of Sox9 expressing cells together with CXCR4 expressing cells. Red panel: The osteogenic centers in the lateral parts of the fusing palate demonstrated clusters of Sox9 expressing cells near CXCR4 expressing cells. (B) Upper panel: Fluorescent histochemical double-stained coronal palatal section for Sox9 (red) with CXCR4 (green), representative for the wt CD1 E16 and wt CD1 SnMP E16 fetuses, e.g., wt CD1 SnMP E16. Middle panel: In the osteogenic centers in the central part of the fusing palate, almost no Sox9-CXCR4 double-positive stained cells were found. Green panel: Near the forming nasal septum clusters of CXCR4 expressing cells were found near CXCR4 positive cells. Also in the cartilage of the nasal septum CXCR4 positive cells were found close to Sox9 positive cells. Red panel: The osteogenic centers in the lateral parts of the fusing palate demonstrated clusters of Sox9 expressing cells near CXCR4 expressing cells.
FIGURE 9
FIGURE 9
HO-1 expressing cells in the palatal osteogenic centers. (A) Upper panel: Fluorescent histochemical stained coronal palatal section for HO-1 expression (green), representative for the wt E15 and HO-2 KO E15 fetuses, e.g., HO-2 KO E15. Middle panel: In the mesenchyme near the disintegrating MES some HO-1 expressing cells (white arrow) were found. Green panel: Near the forming nasal septum clusters of strong HO-1 expressing cells were found. Red panel: The osteogenic centers in the lateral parts of the fusing palate demonstrated clusters of strong HO-1 expressing cells. (B) Upper panel: Fluorescent histochemical-stained coronal palatal section for HO-1 expression (green), representative for the wt CD1 E16 and wt CD1 SnMP E16 fetuses. Middle panel: In the central part of the fusing palate some HO-1 expressing cells were found. Green panel: Near the forming nasal septum clusters of strong HO-1 expressing cells were found. Red panel: The osteogenic centers in the lateral parts of the fusing palate demonstrated clusters of strong HO-1 expressing cells.
FIGURE 10
FIGURE 10
Most HO-1 positive cells in the palatal osteogenic centers are not positive for Sox9. (A) Upper panel: Fluorescent histochemical double-stained coronal palatal section for Sox9 (red) with HO-1 (green), representative for the wt E15 and HO-2 KO E15 fetuses, e.g., HO-2 KO E15. Middle panel: Near the disintegrating MES Sox9-HO-1 double-positive-stained cells (white arrow) were sporadically found. Green panel: In the osteogenic centers near the forming nasal septum clusters some HO-1 expressing cells were found. Furthermore, some solitary HO-1 expressing cells (yellow arrow) were found. In the cartilage of the nasal septum, multiple Sox9 expressing cells were found. Red panel: The osteogenic centers in the lateral parts of the fusing palate demonstrated clusters of HO-1 expressing cells, and solitary strong HO-1 expressing cells (yellow arrows) in the mesenchyme. (B) Upper panel: Fluorescent histochemical double-stained coronal palatal section for Sox9 (red) with HO-1 (green), representative for the wt CD1 E16 and wt CD1 SnMP E16 fetuses. Middle panel: In the fusing palate clusters of HO-1, expressing cells were found within the palatal osteogenic centers. Green panel: Near the forming nasal septum clusters of HO-1 expressing cells were found. In the cartilage of the nasal septum multiple Sox9 expressing cells were found. Red panel: The osteogenic centers in the lateral parts of the fusing palate demonstrated clusters of HO-1 expressing cells.
FIGURE 11
FIGURE 11
CXCL12 expression in the MES and palatal osteogenic centers. (A) Upper panel: Coronal palatal section stained for CXCL12 expression, representative for the wt and HO-2 KO fetuses. Middle panel: Magnification of the central part of the fusing palate including the MES. The MES demonstrated strong CXCL12 expression. CXCL12-positive cells were also found in the palatal mesenchyme. Green panel: The osteogenic centers at the lateral/oral side of the nasal septum demonstrated clusters of strong CXCL12 expressing cells. Also in the cartilage of the forming nasal septum CXCL12 expressing cells were present. Red panel: The osteogenic centers in the lateral parts of the fusing palate demonstrated clusters of strong CXCL12 expressing cells. (B) Box-and-whisker plot with 10–90 percentiles of semi-quantitative assessment of the CXCL12 expression in the palatal epithelial layers (scoring scale in three categories: 1 = HIGH, 2 = MODERATE and 3 = LOW) compared for the different regions in sections from wt E15 (n = 7) and HO-2 KO E15 fetuses (n = 10), ∗∗∗ = p < 0.001. (C) Bar chart of the number of mesenchymal CXCL12-positive cells cells/mm2 compared for the wt E15 (n = 7) and HO-2 KO E15 fetuses (n = 10) between the outline of the inner and outer half of the mesenchyme. Data are shown as mean ± SD. No statistically significant differences in CXCL12 expression were found (p = 0.85).
FIGURE 12
FIGURE 12
Fetal resorption independent of HO-2 KO expression and HO-activity. (A) Box-and-whisker plot with 10–90 percentiles of quantitative assessment of the fetal loss ratio in the wt (n = 3) and HO-2 KO pregnant mice (n = 4) at E15, and wt CD1 mice (n = 6) and wt CD1 SnMP mice (n = 4) at E16, p < 0.05. (B) The uteri were photographed, the green asterisk indicated a fetus, the red asterisk indicated a fetal resorption. Representative uterus per group was shown. (C) Isolated fetus with placenta and isolated fetal resorption from the uterus.
FIGURE 13
FIGURE 13
Fetal body weight decreases by disruption of HO-2, but increases by HO-activity inhibition from E11. (A) Bar chart of the fetal body weight of the wt E15 fetuses (n = 15) and HO-2 KO E15 fetuses (n = 4), p < 0.05. Data are shown as mean ± SD. (B) Representative fetus per group was shown (centimeter ruler). (C) Box-and-whisker plot with 10–90 percentiles of quantitative assessment of the body weight of the wt CD1 E16 fetuses (n = 91) and wt CD1 SnMP E16 fetuses (n = 56), ∗∗∗p < 0.001. (D) Representative fetus per group was shown (centimeter ruler).
FIGURE 14
FIGURE 14
Hypothetical model: CXCL12-CXCR4 interplay facilitates palatal osteogenesis. We propose that the CXCL12-CXCR4 interplay facilitates osteogenesis during palatal fusion in mice. Expression of transcription factor Sox9 in osteoblast progenitors was thought to initiate differentiation into osteoblasts by promoting CXCL12-CXCR4 signaling. CXCL12 expression in the midline epithelial seam could promote maturation of immature CXCR4-positive osteoblast. Sox9 progenitors maintain the CXCR4-positive osteoblast pool to drive osteogenesis. Furthermore, Sox9 expression found in the MES, possibly regulates MES disintegration by the process of epithelial-to-mesenchymal transformation (EMT).

References

    1. Achilleos A., Trainor P. A. (2012). Neural crest stem cells: discovery, properties and potential for therapy. Cell Res. 22 288–304. 10.1038/cr.2012.11 - DOI - PMC - PubMed
    1. Akiyama H., Chaboissier M. C., Martin J. F., Schedl A., de Crombrugghe B. (2002). The transcription factor Sox9 has essential roles in successive steps of the chondrocyte differentiation pathway and is required for expression of Sox5 and Sox6. Genes Dev. 16 2813–2828. 10.1101/gad.1017802 - DOI - PMC - PubMed
    1. Akiyama H., Kim J. E., Nakashima K., Balmes G., Iwai N., Deng J. M., et al. (2005). Osteo-chondroprogenitor cells are derived from Sox9 expressing precursors. Proc. Natl. Acad. Sci. U.S.A. 102 14665–14670. 10.1073/pnas.0504750102 - DOI - PMC - PubMed
    1. Al Ghafli M. H., Padmanabhan R., Kataya H. H., Berg B. (2004). Effects of alpha-lipoic acid supplementation on maternal diabetes-induced growth retardation and congenital anomalies in rat fetuses. Mol. Cell Biochem. 261 123–135. 10.1023/b:mcbi.0000028747.92084.42 - DOI - PubMed
    1. Albano E. (2006). Alcohol, oxidative stress and free radical damage. Proc. Nutr. Soc. 65 278–290. 10.1079/pns2006496 - DOI - PubMed