. 2020 Sep 25;48(17):9969-9985.
doi: 10.1093/nar/gkaa697.

Structural basis for DNA recognition and allosteric control of the retinoic acid receptors RAR-RXR

Affiliations

Structural basis for DNA recognition and allosteric control of the retinoic acid receptors RAR-RXR

Judit Osz et al. Nucleic Acids Res. .

Abstract

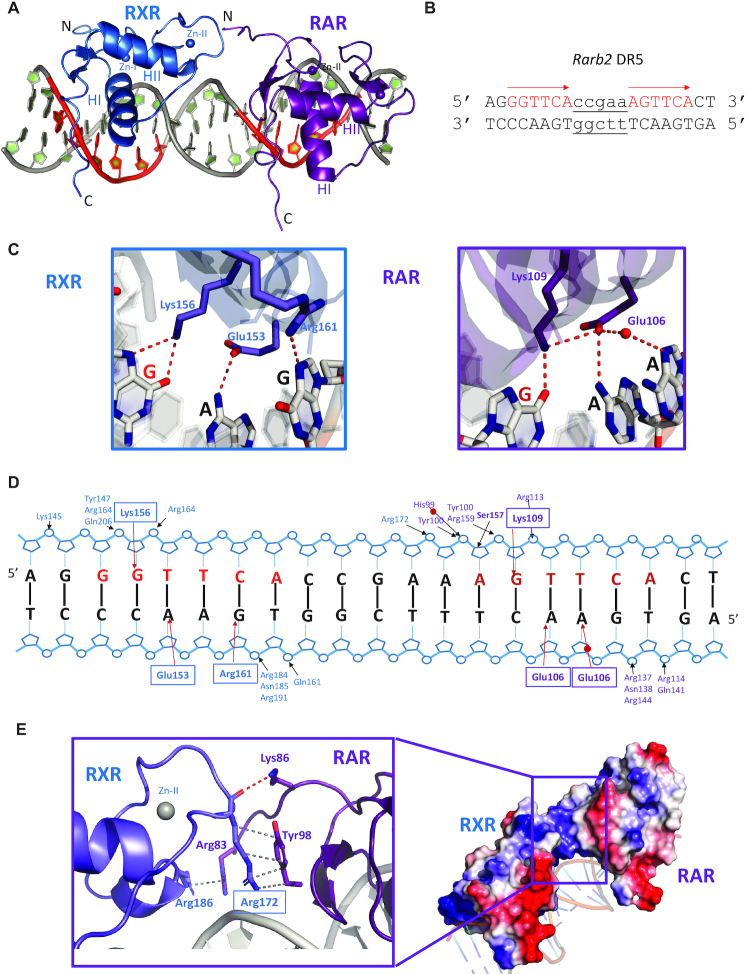
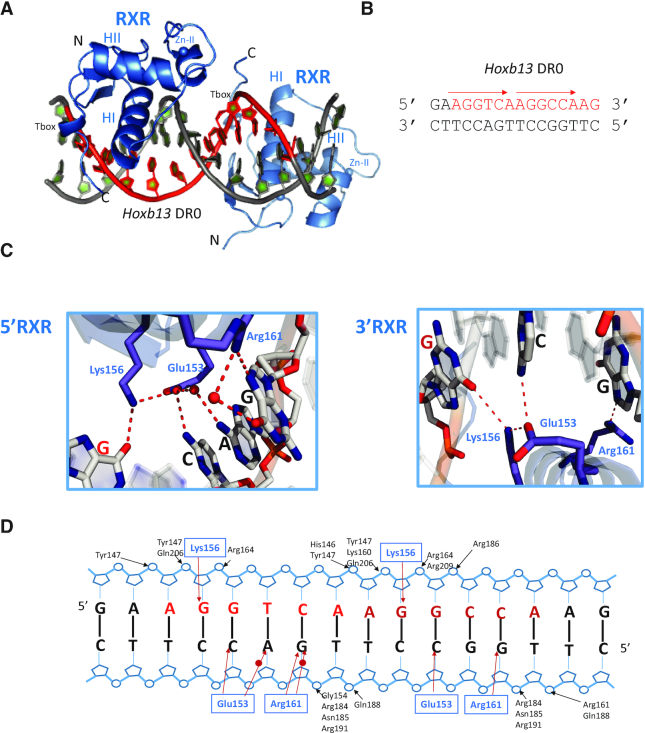
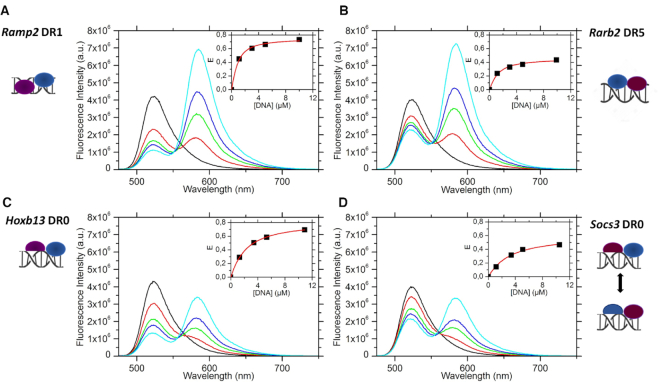
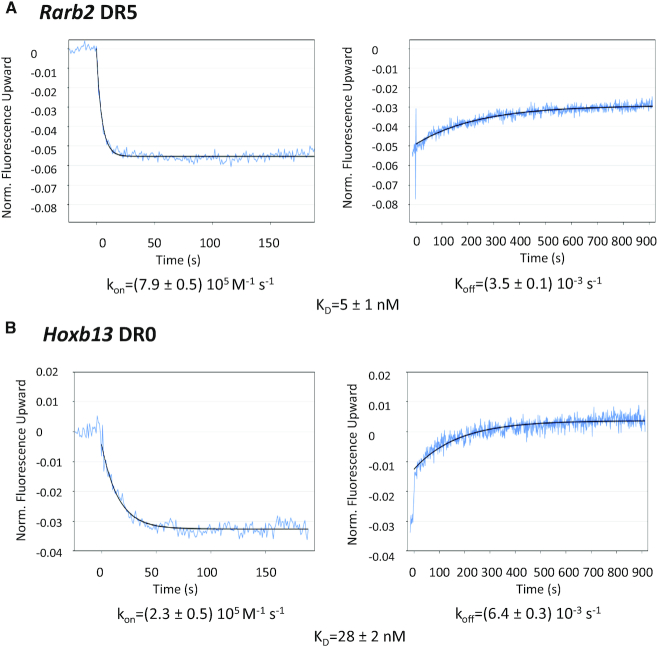
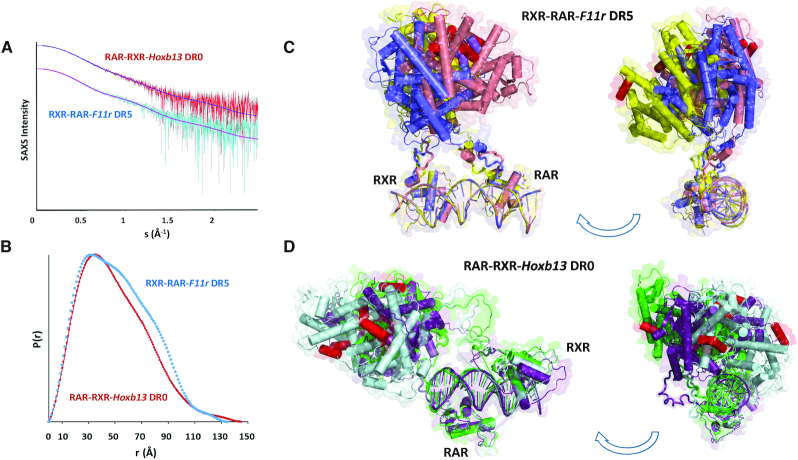
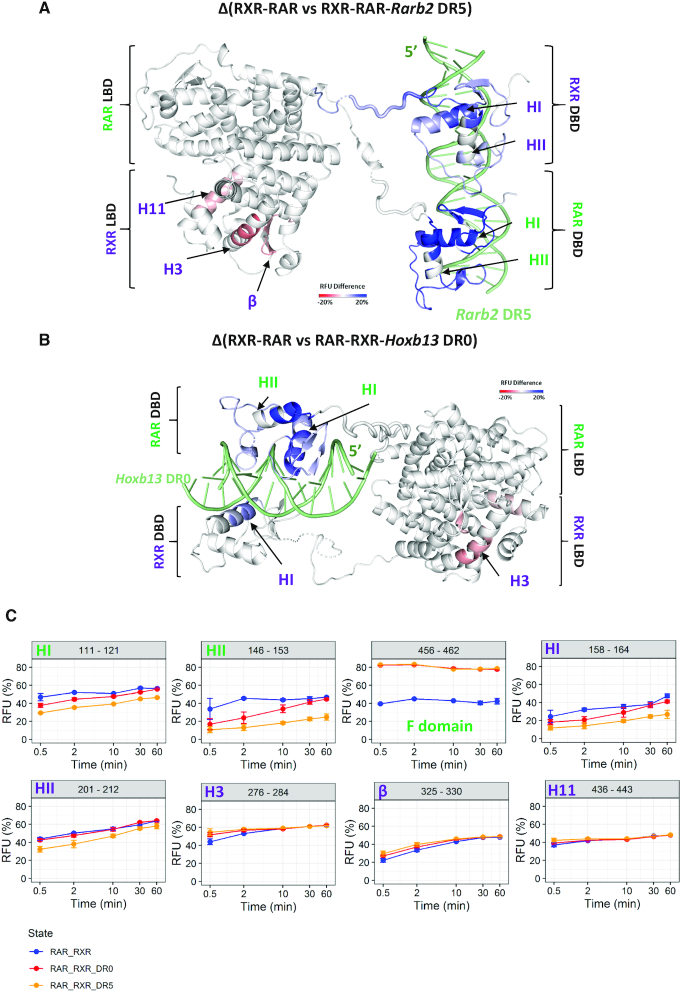
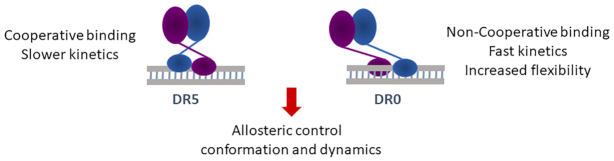
Retinoic acid receptors (RARs) as a functional heterodimer with retinoid X receptors (RXRs), bind a diverse series of RA-response elements (RAREs) in regulated genes. Among them, the non-canonical DR0 elements are bound by RXR-RAR with comparable affinities to DR5 elements but DR0 elements do not act transcriptionally as independent RAREs. In this work, we present structural insights for the recognition of DR5 and DR0 elements by RXR-RAR heterodimer using x-ray crystallography, small angle x-ray scattering, and hydrogen/deuterium exchange coupled to mass spectrometry. We solved the crystal structures of RXR-RAR DNA-binding domain in complex with the Rarb2 DR5 and RXR-RXR DNA-binding domain in complex with Hoxb13 DR0. While cooperative binding was observed on DR5, the two molecules bound non-cooperatively on DR0 on opposite sides of the DNA. In addition, our data unveil the structural organization and dynamics of the multi-domain RXR-RAR DNA complexes providing evidence for DNA-dependent allosteric communication between domains. Differential binding modes between DR0 and DR5 were observed leading to differences in conformation and structural dynamics of the multi-domain RXR-RAR DNA complexes. These results reveal that the topological organization of the RAR binding element confer regulatory information by modulating the overall topology and structural dynamics of the RXR-RAR heterodimers.


Figures

Figure 1.
Figure 1.
Crystal structure of RXR–RAR DBDs-Rarb2 DR5. (A) Overall structure. The spheres indicate the Zn atoms. RXR is shown in blue and RAR in purple. (B) Sequence of Rarb2 DR5. (C) Specific interactions of RXR and RAR DBDs to Rarb2 DR5. Left: View along the DNA-recognition helix of RXR showing residues Glu153, Lys156, Arg161 and their direct base contacts. Right: corresponding view of Rarb2 DR5 recognition by RAR DBD showing residues Glu106, Arg109 and Arg113. Hydrogen-bonds and water molecules are shown as red dotted lines and red spheres, respectively. (D) Schematic view of the RXR–RAR DBDs-Rarb2 DR5 contacts calculated with NUCPLOT with a 3.9 Å distance cutoff. Bridging water molecules are shown as red circles. (E) Dimerization interface that involves residues from the second Zn module of RXR and the pre-finger region of RAR. Hydrogen bond and Van der Waals interactions are shown by red and grey dashed lines, respectively. Right: Electrostatic surface representation of the complex (red, negative; blue, positive; light gray, neutral).
Figure 2.
Figure 2.
Crystal structure of RXR–RXR DBDs-Hoxb13 DR0. (A) Overall structure of RXR–RXR–DNA complex. The spheres indicate the Zn atoms. (B) Sequence of Hoxb13 DR0. (C) Specific interactions of RXR homodimer DBDs to Hoxb13 DR0. Left: View along the DNA-recognition helix of 5′ RXR. Right: The corresponding view of 3′ RXR. Hydrogen-bonds and water molecules are shown as red dotted lines and red spheres, respectively. (D) Schematic view of the RXR–RXR DBDs-Hoxb13 DR0 contacts calculated with NUCPLOT with a 3.9 Å distance cutoff. Bridging water molecules are shown as red circles.
Figure 3.
Figure 3.
Polarity of DNA bound RXR–RAR complexes. Fluorescence spectra of OG488-RARA ΔAB-RXRA ΔAB in the absence (black curve) and in the presence of increasing concentrations of DNA-TAMRA5/6 (red, green, blue and cyan curves correspond respectively to DNA/protein ratios of 1, 3, 5 and 10). In each panel, the inset represents the evolution of the FRET efficiency as a function of DNA concentration. The FRET efficiency (square marks) was deduced from the decrease of the donor emission. The red curve represents the best fit to Equation (1). (A) [RAR-RXR] = 0.73 μM titrated by Ramp2 DR1 (kd = 0.5 μM, Esat = 0.75), (B) [RAR–RXR] = 0.81 μM titrated by Rarb2 DR5 (kd = 0.8 μM, Esat = 0.46), (C) [RAR-RXR] = 0.78 μM titrated by Hoxb13 DR0 (kd = 1.8 μM, Esat = 0.81) and (D) [RAR-RXR] = 0.78 μM titrated by Socs3 DR0 (kd = 2.7 μM, Esat = 0.61).
Figure 4.
Figure 4.
Kinetic analysis of RXRA ΔAB-RARA ΔAB interacting with (ARarb2 DR5 and (B) Hoxb13 DR0 using the switchSENSE technology. The raw data are superimposed by global exponential fits. The kon, koff and KD values are indicated.
Figure 5.
Figure 5.
Solution structure models of multi-domain RXR–RAR–DNA complexes. (A) The final averaged SEC-SAXS data and the computed model fits to the data for RXRA ΔAB–RARA ΔABF-F11r DR5 and RARA ΔABF-RXRA ΔAB-Hoxb13 DR0. (B) The p(r) profiles calculated from the SAXS data showing changes in the distribution of real-space distances on comparing the DR5 or DR0 complexes. (CD) Refined rigid-body models of RXR–RAR-F11r DR5 and RAR-RXR-Hoxb13 DR0 heterodimers showing changes in the position and tilt of the DR5 or DR0 response elements bound to the RAR–RXR DNA binding domains relative to the ligand binding domains. For each complex, three representative refined rigid-body models are shown in different colors (blue, pink and yellow for RXR–RAR–F11r DR5 and cyan, purple and green for RAR–RXR–Hoxb13 DR0). In all models, helices H12 of RXR and RAR are colored in red.
Figure 6.
Figure 6.
Conformational dynamics of RXR–RAR upon DNA binding. Export of RFU differences on RXRA ΔAB-RARA ΔAB heterodimer structure upon Rarb2 DR5 (A) and Hoxb13 DR0 (B) bindings determined by HDX-MS. Export is performed for 0.5 min deuteration experiments. RFU differences are color scaled from red (deprotection) to blue (protection) upon DNA binding (–20% to 20% range of RFU difference), while white regions are non-affected or non-covered. Secondary structures exhibiting statistically validated differences for the magnitude are indicated in green for RAR and in purple for RXR. (C) Deuterium uptake of selected perturbed peptides upon DR0 and DR5 binding plotted as a function of deuteration time. Blue, red and orange curves correspond to RXR–RAR, RAR–RXR–Hoxb13 DR0 and RXR–RAR–Rarb2 DR5 states respectively. The corresponding secondary structures are indicated for each plot.
Figure 7.
Figure 7.
Differences in the binding mode of the RXR–RAR to DR5 or DR0 response elements.

Similar articles

Cited by

References

    1. Chambon P. The nuclear receptor superfamily: a personal retrospect on the first two decades. Mol. Endocrinol. 2005; 19:1418–1428. - PubMed
    1. Benbrook D.M., Chambon P., Rochette-Egly C., Asson-Batres M.A.. History of retinoic acid receptors. Subcell. Biochem. 2014; 70:1–20. - PubMed
    1. di Masi A., Leboffe L., De Marinis E., Pagano F., Cicconi L., Rochette-Egly C., Lo-Coco F., Ascenzi P., Nervi C.. Retinoic acid receptors: from molecular mechanisms to cancer therapy. Mol. Aspects Med. 2015; 41:1–115. - PubMed
    1. Gronemeyer H., Gustafsson J.A., Laudet V.. Principles for modulation of the nuclear receptor superfamily. Nat. Rev. Drug Discov. 2004; 3:950–964. - PubMed
    1. Perissi V., Rosenfeld M.G.. Controlling nuclear receptors: the circular logic of cofactor cycles. Nat. Rev. Mol. Cell Biol. 2005; 6:542–554. - PubMed

Publication types